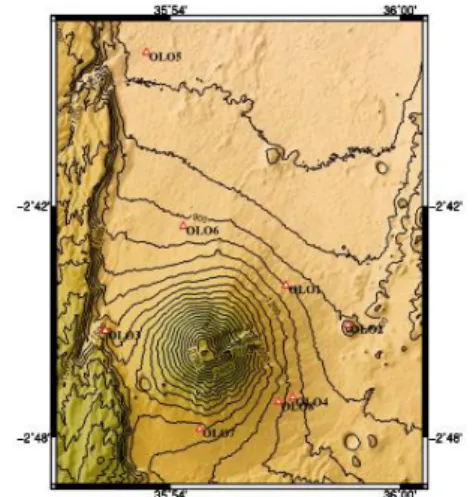
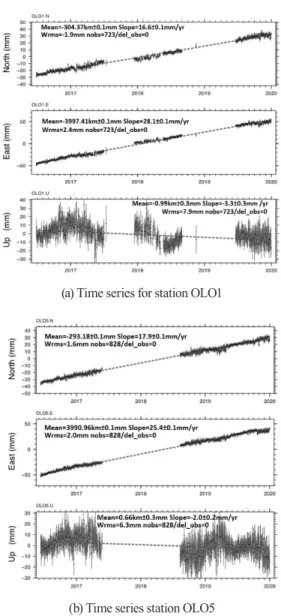
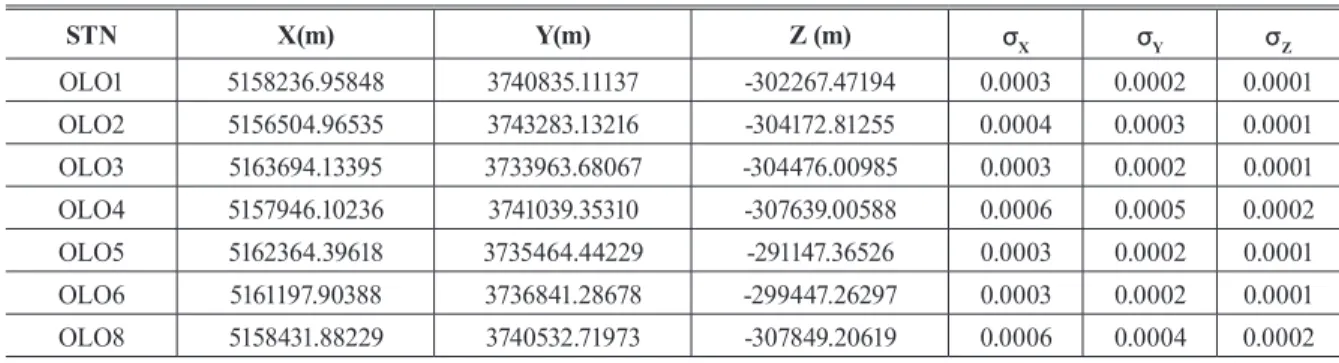
Crustal Movement at Ol Doinyo Lengai based on GPS Measurements
6
0
0
전체 글
(2)
(3)
(5)
(6)
수치
관련 문서
contest-based and ( ).. Sport for all movement 4.. 사회체육, 생활체육, 평생체육.. Sport for all movement.. 2) 선진국의 사회체육 표어.. Recreation for
O3 Search TRIPs with intermediate stop at a city 5 times/day OL O4 Create a new CLIENT record 500 times/day OL O5 Make a reservation 20,000 times/day OL , / y O6 Delete
Houses of Parliaments, London (Sir Barry & Pugin)... Houses of
For this study—our third on global workforce trends, follow- ing studies in 2014 and 2018—Boston Consulting Group and The Network surveyed some 209,000 people in 190 countries
Azure Data Factory (ADF) is a cloud-based data integration service that allows you to orchestrate and automate data movement and data transformation. Ingesting data can
Thepl antspeci esappeared i n bi ol ogyⅡ textbook publ i shed by the 7th educati onal process and those pl anted at some hi ghschool campuses were comparati vel y studi ed.The
Pol y(2, 3, 4, 5-tetraphenyl )si l ol es (1 1 1, so cal l ed pol ysi l ol e, PTPS) shown i n Scheme1possessboth 2, 3, 4, 5-tetraphenyl -1-si l acycl openta- 2, 4-di
Keywords: Anti-Soviet & Anti-Communist Movement, North Korea, Sinuiju Incident, Anti-Trusteeship Movement, Land Reform, Provincial, City and County People's
