Print ISSN: 2288-4637 / Online ISSN 2288-4645 doi:10.13106/jafeb.2020.vol7.no12.095
Linkage Between Exchange Rate and Stock Prices: Evidence from Vietnam
Van Cuong DANG
1, Thi Lanh LE
2, Quang Khai NGUYEN
3, Duc Quang TRAN
4Received: September 01, 2020 Revised: October 26, 2020 Accepted: November 05, 2020
Abstract
The study investigates the asymmetric effect of exchange rate changes on stock prices in Vietnam. We use the nonlinear autoregressive- distributed lag (ARDL) analysis for monthly data from 2001:01 to 2018:05, based on VN-Index stock price collected from Ho Chi Minh Stock Exchange (HOSE); the nominal exchange rate is separated into currency depreciation and appreciation through a partial sum decomposition process. Asymmetry is estimated both in the long-run relationship and the short-run error correction mechanism. The research results show that the effect of exchange rate changes on stock prices is asymmetrical, both in the short run and in long run. Accordingly, the stock prices react to different levels to depreciation and appreciation. However, the currency appreciation affects a stronger transmission of stock prices when compared to the long-run currency depreciation. In the absence of asymmetry, the exchange rate only has a short-run impact on stock prices. This implies a symmetrical assumption that underestimates the impact of exchange rate changes on stock prices in Vietnam. This study points to an important implication for regulators in Vietnam. They should consider the relationship between exchange rate changes and stock prices in both the long run and the short run to manage the stock and foreign exchange market.
Keywords: Stock Prices, Exchange Rates, Asymmetric, Nonlinear ARDL JEL Classification Code: C32, F31, G15
productivity. The exchange rate is not only important because it affects foreign trade, but through which the exchange rate will have an impact on other aspects of the economy such as domestic prices, production inflation, job or unemployment.
Exchange rate is also known as one of an external corporate governance in controlling firm risk (Nguyen & Dang, 2019;
Nguyen, 2020). Today with a market economy, exchange rates are becoming extremely important financial instruments in the process of macroeconomic management. In particular, the relationship between stock prices and exchange rates receives increasing interest in macro and financial studies.
This, in part, is due to the policies of financial liberalization and international financial market globalization that have encouraged an increase in international capital flows, both for investment and portfolio diversification (Phylaktis &
Ravazzolo, 2005).
In recent times, most governments have tended to use exchange rates more flexibly. In developed economies, the purpose of exchange rate interventions is to reasonably maintain organized monetary relations and overcomes the negative major fluctuations of the world. Meanwhile, in developing countries, the purpose of exchange rate interventions is to create a suitable exchange rate regime, meeting the risk reduction and damage targets of exchange rate fluctuations on the stock market. The flow-oriented exchange
1. Introduction
The exchange rate is considered a tool to measure the value between currencies and, thus, acts as a competitive tool in international trade, an economic management tool, which has a strong impact on prices of a country. Specifically, as a role of comparing the purchasing power of currencies, the exchange rate becomes an effective tool to calculate and compare the value of domestic currency with the value of foreign currency and domestic goods prices at international prices, domestic labor productivity with international labor
1
First Author and Corresponding Author. Researcher, School of Public Finance, University of Economics Ho Chi Minh City, Vietnam [Postal Address: 59C Nguyen Dinh Chieu, Ward 6, District 3, Ho Chi Minh City, 700000, Vietnam] Email: [email protected]
2
Researcher, School of Finance, University of Economics Ho Chi Minh City, Vietnam
3
Researcher, School of Banking, University of Economics Ho Chi Minh City, Vietnam
4
Researcher, School of Finance, University of Economics Ho Chi Minh City, Vietnam
© Copyright: The Author(s)
This is an Open Access article distributed under the terms of the Creative Commons Attribution Non-Commercial License (https://creativecommons.org/licenses/by-nc/4.0/) which permits unrestricted non-commercial use, distribution, and reproduction in any medium, provided the original work is properly cited.
rate models argue that the changes in the exchange rate affect international competitiveness, and in turn influences real income and output as well as stock prices, which are the discounted present value future cash flows of organizations (Dornbusch & Fischer, 1980). On the other hand, a feedback effect from stock prices to exchange rates follows a stock- oriented model (Branson, 1981; Frankel, 1992; Gavin, 1989).
Stock market innovation affects aggregate demand and money demand through wealth effect and liquidity.
Some studies have eased symmetric assumptions and found support for the asymmetric effect of exchange rate changes on stock prices (Bartram, 2004; Hsu et al., 2009;
Koutmos & Martin, 2003; Miller & Reuer, 1998; Nguyen
& Do, 2020). For instance, Bartram (2004) estimates both linear and nonlinear regression models to show that exchange rate changes (sensitivity) represent nonlinear structures.
For these studies, the disadvantage is that it is impossible to distinguish between long-run and short-run asymmetric effects in the impact of exchange rate changes. This is important because the exchange rate affects cash flows and stock prices at different time intervals (e.g., short-run, long- run or both).
With the recent development in nonlinear cointegration analysis, Shin et al. (2014) have proposed a nonlinear autoregressive distributed lag (NARDL) model framework as a counterpart to the well-known symmetric ARDL model of Pesaran et al. (2001). This new analytical framework is able to integrate asymmetry in both long-run relationships and short-run correction mechanisms. Through the partial total decomposition process, a basic variable can be separated into both positive and negative components to analyze dynamic and nonlinear asymmetry. Using the NARDL model, recent studies have found evidence of asymmetric exchange rate effects on stock prices (Ajayi & Mougouė, 1996; Bahmani-Oskooee & Saha, 2015, 2016, 2018; Cheah et al., 2017; Cuestas & Tang, 2017; Kumar & Paramanik, 2020) According to the author’s knowledge, studies of the same topic in Vietnam have not mentioned the potential non-linear dynamic relationship between exchange rates and stock prices. That makes the research results unconfirmed (affirmed) the existence of a close long-run relationship between the variables. Stemming from these shortcomings, this study conducted an assessment of asymmetric (nonlinear) relationships that may exist in the relationship between exchange rates and stock prices in Vietnam.
In this study, we take part in a stream of research on the long-run relationship between exchange rates and stock prices, and investigate the role of asymmetry in the impact of exchange rate changes on stock prices in Vietnam. In particular, the study examined both short-run and long- run symmetrical asymmetries in the relationship between both variables. In order to achieve this goal, the study uses NARDL of Shin et al. (2014), for the data on Vietnam in the
period 2001:01–2018:05, including stock prices, exchange rates, consumer price (inflation) and broad money supply.
2. Literature Review
Concentrating on the effect of exchange rate on stock prices, many studies focus on short-run Granger causality and possible long-run relationships between stock prices and exchange rates (Alagidede et al., 2011; Effiong, 2016;
Fowowe, 2015; Granger et al., 2000; Lee & Zhao, 2014;
Lin, 2012; Nieh & Lee, 2001; Pan et al., 2007; Phylaktis &
Ravazzolo, 2005). In addition, there are other studies using variations of the GARCH model to investigate volatility spillover transmission between two variables (Andreou et al., 2013; Apergis & Rezitis, 2001; Salisu & Oloko, 2015;
Tule et al., 2018; Zhao, 2010). So far, empirical evidences from these studies have not been consistent and clear. This is because the relationship between stock prices and exchange rates is studied in the bivariate or multivariate framework using different econometric methods for different time periods (including or excluding crisis periods), different data frequencies (daily, monthly and quarterly), different measures of stock prices and exchange rates (nominal or real) and for different economies (developed, emerging and developing).
2.1. Linear Relationship
Granger et al. (2000) focus on developing countries in East Asia including Hong Kong, Indonesia, Japan, Korea, Malaysia, the Philippines, Singapore, Thailand and Taiwan, which are influenced by the 1997 financial crisis. Using Granger causality test and co-integration Gregory-Hansen, the authors analyze the relationship between stock prices and exchange rates, through daily data from Mach 1, 1986, to November 14, 1997, and show that changing exchange rates affect (in the same way) stock prices in Japan and Thailand.
For Taiwan, this relationship is reversed, that is, the stock price affects the exchange rate (the inverse correlation).
The authors found a two-way relationship between the two
markets (stock and foreign exchange) in Indonesia, Korea,
Malaysia and the Philippines, similar to the findings of
Bahmani-Oskooee and Sohrabian (1992) for the United
States. However, the Singapore market does not show any
model of relationship. Through the Granger causality test,
the study find evidence of exchange rates that have a positive
effect on stock prices in eight of the nine countries. Nieh
and Lee (2001) also use daily data during the period from
October 1, 1993, to February 15, 1996; through the two-
step Engle-Granger method and Johansen’s maximum co-
integration test, the authors do not find any cointegration
(long-run) relationship between the exchange rate and
the stock prices in the markets such as Canadian, French,
German, Italian, Japanese, English and American schools.
Only one-day short-run relationship exists in G7 markets.
Similar results are found by Smyth and Nandha (2003) for markets in Bangladesh, India, Pakistan and Sri Lanka in the period from January 2, 1995, to November 23, 2001.
Through the two-step Engle-Granger method and Johansen co-integration, there is no long-run equilibrium between the exchange rate and the stock price. Exchange rate impact on stock prices in India and Sri Lanka, but there is no evidence of causality in Bangladesh and Pakistan.
Considering the experience of countries in crisis, Lean et al. (2005) explore weekly data from January 1, 1991, to December 31, 2002, for Hong Kong, Indonesia, Singapore, Malaysia, Korea, the Philippines and Thailand to study the scenario before and after the crisis and the impact of the terrorist attacks on 9/11. The authors apply both OLS-based co-integration and Granger causality. For all countries, except the Philippines and Malaysia, the study find no evidence of Granger causality between stock prices and exchange rates in the period before the Asian financial crisis. During the crisis, the authors found evidence of causality between two variables. The results show that there is no cointegration relationship between variables before or during the Asian crisis in 1997, but after the September 11 terrorist attack, the weaker cointegration between variables was found.
Another study about seven Asian countries (Hong Kong, Japan, Korea, Malaysia, Singapore, Taiwan and Thailand) of Pan et al. (2007) applied Granger causality and copper testing methods of Johansen’s cointegration to check the link between stock prices and exchange rates, using daily data from January 1988 to October 1998. They conclude that there is no long-run equilibrium relationship between exchange rates and stock prices. For Hong Kong, Japan, Malaysia and Thailand, there is a significant causal relationship from exchange rates to stock prices before the Asian financial crisis and during the financial crisis, the authors found see causal relationship from exchange rate to stock price in all markets except Malaysia.
Rahman and Uddin (2009) explore monthly data from January 2003 to June 2008 for Bangladesh, India and Pakistan and methods of Johansen co-integration and Granger causality testing. Again, the authors find no evidence of the presence of a long-run relationship between stock prices and exchange rates, nor did they find causality in any direction between turn. The findings imply that market participants cannot use the information of any of the two markets (stocks and foreign exchange) to help forecast the remaining market. Referring to the Australian market, using daily data from January 2, 2003, to June 30, 2006, Richards et al. (2007) have studied the relationship between two variables. By using Johansen co-integration test, the authors show that both stock prices and exchange rates are cointegration in the long term. The Granger causality test has supported the portfolio approach when showing changes in stock prices affecting exchange
rate changes. However, using weekly data from January 1989 to December 2006, Kutty (2010) cannot support cointegration relations in Mexico, although some evidences of short-run Granger causality be found. Considering the Chinese market, the dynamic relationship between exchange rates and stock prices is studied by Zhao (2010), using monthly data from January 1991 to June 2009. Applying Johansen cointegration method, the results show that there is no stable long-run equilibrium relationship between real multilateral RMB exchange rates and stock prices. The origin and magnitude of the spreads are verified through VAR and multivariate GARCH (MGARCH) models. From the foreign exchange market to the stock market, there is no mean spillover effect but there is a bi-directional volatility spillover effect.
Most of the studies mentioned above are based on a parallel analysis framework, including exchange rate and stock prices. Many other studies use multivariate models, adding other control variables to the regression model. For example, Tian and Ma (2010) have studied the relationship between stock prices and macroeconomic variables such as exchange rates, money supply, industrial production (IPI) and consumer price index (CPI), using monthly data from December 1995 to December 2009 for China. The results from the ARDL model show that before the financial liberalization in 2005, there was no linkage between the exchange rate and the Shanghai stock price index. After liberalization, cointegration relations appeared. Money supply and exchange rate affecting stock prices with a positive correlation in China and CPI last month also affected Granger causality to stock prices.
Parsva and Lean (2011) use explanatory variables
including interest rate, inflation rates and oil prices as the
main determinants of stock prices in Egypt, Iran, Jordan,
Kuwait, Oman and Saudi Arabia. Using monthly data from
January 2004 to September 2010, the authors estimated the
model using the Johansen cointegration method and Granger
causality. The authors find that, in the long run, all variables
are cointegration. Both short and long term have a two-way
causal relationship between stock prices and exchange rates
in Egypt, Iran and Oman before the crisis. In Kuwait market,
causality runs from exchange rate to stock price in short
term. Comparing the pre- and post-crisis periods, there is not
much difference in the behavior of exchange rates and stock
returns. Oil prices were also included in the model of Basher
et al. (2012), the study of monthly data usage from January
1988 to December 2008 to check the relationship between
the price of stock in the emerging market. In addition, the
model also includes real global economic activity as one of
the variables affecting oil prices. Using the structural VAR
model and through the impulse response analysis, the authors
find that the shock to increase oil prices would reduce the
emerging market prices and the US dollar exchange rate in
the short run.
2.2. Nonlinear Relationship
In a recent survey, Bahmani-Oskooee and Saha (2015) observed two common characteristics in previous studies.
First, the relationship between stock prices and exchange rates is a short-run phenomenon That is, both variables do not cointegrate in the long run. Second, exchange rate changes are assumed to have symmetrical effect on the stock price, which means that the depreciation and appreciation of the domestic currency affect the stock prices by the same magnitude, but in the opposite direction. The fact that stock prices can react asymmetrically to exchange rate changes, has now been widely recognized in many studies. Such asymmetry can be explained by market valuation, hysteresis and asymmetric hedging (Koutmos & Martin, 2003). Pricing- to-market (PTM) simply relates to an enterprise pricing mechanism with a level of competition in the international market. Asymmetric PTM occurs when a domestic export business is facing an increase in the price of the domestic currency, preferring to maintain the foreign currency price and reduce the margin to minimize the risk of declining sales. A lesser PTM can happen with the appreciation of the domestic currency as businesses choose to lower prices to increase sales volume and market share. Meanwhile, a larger PTM may occur in the depreciation of the domestic currency as businesses face volume restrictions and the only option is to increase foreign prices to buy all goods on the market.
A hysteretic behavior manifests itself when new market participants are drawn to a current market when the currency depreciates and continues to remain in the market once the currency rises. This creates an asymmetric competitive effect, and therefore, the exchange rate sensitivity is asymmetric, because cash flow may not increase when currency depreciation, but decreases when currency appreciation.
Finally, asymmetric hedging can occur when organizations use currency options to hedge against exchange rate changes.
Enterprises with foreign currency receivables (payable) may hedge against currency depreciations (appreciations), but remain unhedged against currency appreciations (depreciations). Such behavior creates an asymmetric impact on cash flow. In summary, regardless of the source of the asymmetry, the basic argument is that asymmetry will lead to different levels of the stock price effect due to the appreciation and depreciation of the corresponding currency.
Consequently, some studies have attempted to provide evidence of the existence of asymmetric exchange rate sensitivity effects on stock returns. These studies are mainly done at the sector level. For example, Miller and Reuer (1998) investigate asymmetric industry sensitivity for exchange rate changes for 239 US manufacturing firms. The authors argue that for a small part of businesses, sensitivity to depreciation and currency appreciation is asymmetrical. Koutmos and Martin (2003) disaggregate exchange rate changes into
increasing and decreasing components by using the concept of partial aggregation and estimating exchange rate sensitive models for nine sectors in Germany, Japan, England and America. The authors find significant asymmetric exchange rates in about 40% of the country-sector model with a more pronounced expression in the financial sector and in the non- consumer sector.
Meanwhile, Hsu et al. (2009) provide little evidence to support the sensitivity of asymmetric exchange rates on stock price indices of 33 industries in Japan. However, based on correlation analysis (i.e. the correlation between positive and negative developments), the authors argue that only the pharmaceutical, real estate and air transport industries show similarities. asymmetric mandarin; and therefore asymmetric sensitivity. While extending the scope, these studies cannot investigate short-run and long-run (sensitive) effects of asymmetric exchange rates. To address short-run and long- run asymmetries in the relationship between stock prices and exchange rates, recent studies have used nonlinear ARDL (NARDL) framework for asymmetric cointegration and error-correction modeling of Shin et al. (2014). Bahmani- Oskooee and Saha (2015) investigate the impact of exchange rate changes on stock prices, using US data in multivariate frameworks, including other determinants of stock prices such as levels economic activity, price and money supply.
The authors found empirical support for asymmetry in the case of exchange rate changes on stock prices. Similarly, Bahmani-Oskooee and Saha (2016) expand similar analysis for 11 countries and find evidence that changes in the asymmetric exchange rate impact on stock prices, despite major effects is short.
Cuestas and Tang (2017) also investigate the asymmetric exchange rate sensitivity of 31 Chinese industries, using both monthly data from August 2006 to December 2015 and the NARDL analysis framework. The authors find an asymmetric exchange rate sensitivity for some non-export industries, which could have originated from a high rate of imported inputs. In addition, industry profits show late sensitivity effects and have a rapid adjustment to new equilibrium in a short period of time (about several months), making sensitive exchange rates long. limited or very small. Cheah et al.
(2017) analyze Malaysian exchange rates with monthly data from January 1993 to December 2015. The authors found significant short-run and long-run effects of the exchange rate. stock prices. This relationship is not asymmetrical with stock prices responding to the depreciation of the currency but not with the appreciation of the currency.
In summary, from the above studies, it can be seen that
the linear assumption in the relationship between the price
of stock and the exchange rate is a not-so-assumption, since
the reaction of stock prices to changes of the exchange rate
(price increase or depreciation) may vary both in direction
and level. In other words, the relationship between exchange
rates and stock prices can be asymmetric (nonlinear). The studies in Vietnam, whether put in a multivariate or parallel model, have not yet concluded (affirmed) the significant long-run relationship between the two markets. The studies, despite trying to show some signs or evidence of the impact of exchange rates on stock prices in the short and long term, are still based on the assumption of symmetry in the relationship between the two variables. The above implementation does not comprehensively capture the impact of exchange rates on stock prices (Effiong & Bassey, 2019). Stemming from the research gap, we aim to conduct an investigation of the relationship between exchange rate and stock prices in Vietnam market in the framework of linear ARDL and nonlinear (NARDL) to answer for questions about the existence of asymmetric effects in the relationship between exchange rate changes and stock prices in Vietnam.
3. Methods and Data 3.1. The Linear ARDL
There are many methods that can be used to analyze cointegration relations for variables. Among them, there are two common methods, including residual-based methods introduced by Engle and Granger (1987), and the maximum-likelihood-based approach based on by Johansen and Juselius (1990). Both of these methods require variables correlated with each other at the same level, i.e., being stationary at the same order (Engle & Granger, 1987;
Johansen & Juselius, 1990). In case that the above condition is not satisfied, the ARDL is an optimal alternative because it does not require variables have to be stationary at the same order, even with mixed orders of integration (Pesaran et al., 2001). Therefore, empirical research does not need to address a stationary test when using the ARDL method to verify co-integration. Besides, ARDL method has many other advantages:
- First, the ARDL method can be implemented for smaller sample sizes than Johansen co-integration techniques (Ghatak & Siddiki, 2001).
- Second, when some of the explanatory variables in the model are endogenous, the ARDL may yield non-biased long-run estimated coefficients with t-value (Narayan &
Smyth, 2005).
- And third, the ARDL can estimate the short-run and long-run effects of independent variables on explanatory variables in a single equation without solving multiple simultaneous equations (Bentzen & Engsted, 2001).
In order to test the role of asymmetry in the impact of exchange rate changes on stock prices in Vietnam, We base on a multivariate model of stock price determination
used in many previous studies (Bahmani-Oskooee &
Saha, 2015, 2016) which accounts for the effect of other macroeconomic variables in addition to the exchange rate as follows:
sp
t= β
0+ β
1er
t+ β
2cp
t+ β
3m2
t+ ε
t, (1) where, ε
tis the remainder; β
iare long-run parameters;
sp
tis the stock price index; er
tis the exchange rate; cp
tis the consumer price index measured by the total price; and m2
tis the measure of nominal money supply. All variables are represented as natural logarithms. Based on the exchange rate-driven model of the exchange rate, the coefficient of β
1can be positive or negative depending on whether the lower domestic currency valuation leads to higher export earnings or increased production costs.
Similarly, the impact of consumer prices (or inflation) may be negative or positive. Fama and Jensen (1983) hypothesized a negative relationship: inflation increases input prices and production cost which in turn reduces a firm’s profit margin and stock prices. In contrast, equity stocks are expected to serve as an hedge against inflation, so that stock prices and inflation move in the same direction in the long run. Therefore, studies have argued for a negative short-run and a positive long-run relationship between stock prices and inflation (Anari & Kolari, 2001). For the relationship between money supply and stock prices, positive and negative impacts are confirmed in many studies. A positive effect exist when an increase in money supply leads to a decrease in interest rates which stimulates an increase in domestic investment, aggregate output and stock prices, whereas a negative effect could manifest following Fame’s argument on the effect of inflation since increase in money supply could lead to inflationary pressures on the economy.
Table 1: Variable description
Variables Measurement Expected
signs Source
sp Natural logarithm of
stock prices HOSE
er Natural logarithm of
exchange rates +/− Datastream
cp Natural logarithm of consumer price index
+/− IFS
m2 Natural logarithm of broad money supply (M2)
+/− IFS
Note: HOSE: Ho Chi Minh Stock Exchange; IFS: International
financial statistics.
Equation (1) represents long-run cointegration equations with parameters capturing the long-run effects of each explanatory variables. Convert equation (1) to error correction modeling form, in which the change in sp
t(i.e.
stock returns, determined by ∆sp
t= sp
t− sp
t−1) is related to the last period’s disequilibrium and possible variations induced by changes in the explanatory variables yields:
0 1 1 2 1 3 1 4 1
1 0 0
0
2
2 ,
t t t t t
p q r
' ' '
i t i i t i i t i
i i i
s '
i t i t
i
sp sp er cp m
sp er cp
m
λ λ λ λ λ
θ γ δ
ϑ µ
− − − −
− − −
= = =
−
=
∆ = + + + +
+ ∆ + ∆ + ∆
+ ∆ +
∑ ∑ ∑
∑
(2)
where, µ
tis an iid process. Equation (2) is equivalent to the ARDL model of Pesaran et al. (2001), which combines both long-run and short-run relationships of the research variables. Short-run effects are determined based on the estimated coefficients preceded by the first difference, while the long-run effects are obtained from the factors λ
2, λ
3, λ
4standardized on λ
1. In order to verify the long-run relationship between variables, we conduct co-integration testing based on F-test, assuming as follows:
H0: λ
1= λ
2= λ
3= λ
4= 0 (no long-run relationship) and H1: λ
1≠ λ
2≠ λ
3≠ λ
4≠ 0 (long-run relationship)
Pesaran et al (2001) provide two critical value bounds.
The upper-value bound is obtained by assuming all variables are I (1) and lower-value bound is obtained by assuming all variables are I (0). If the statistical value F is calculated to be greater than the upper limit value, we reject the null hypothesis, i.e. there is cointegration between the variables.
3.2. The Nonlinear ARDL
The ARDL model assumes the linear symmetry effect of the explanatory variables on the dependent variable. In the case of exchange rate changes, stock prices respond symmetrically to changes in the domestic currency. In other words, depreciation and currency appreciation affect stock prices with the same magnitude in opposite directions.
However, as mentioned, exchange rate changes can cause asymmetric changes on stock prices both in the long term and short term, either in the same direction or the opposite direction (i.e., above or below balanced relationship). As Shin et al. (2014) presented, expressing ARDL of equation (2) is a symmetric linear combination of random regressions, which may be too restrictive to take into account nonlinearity symmetrical and nonlinear in economic relations. Therefore, the authors improve the traditional model with an alternative:
NARDL model, allowing asymmetric properties in long-run cointegration relationships and short-run error correction mechanisms. According to Shin et al. (2014), to verify the asymmetric cointegration relationship, as well as consider the asymmetric effect of changing the exchange rate on stock prices, the variable er_t is made into components. Individual accumulation: positive and negative as follows:
0
,
t t t
er er er = +
++ er
−where, er
t+and er
t−, respectively positive changes (reflecting high valuation) and negative (reflecting low valuation) of VND, er
0reflect the constant of VND. Positive and negative constituent variables are obtained from the following cumulative process:
( )
1 j 1
t t
,0 ,
t j
j j
er
+er
+max er
= =
= ∑ ∆ = ∑ ∆ (3)
( )
1 1
t t
,0 ,
t j j
j j
er
−er
−min er
= =
= ∑ ∆ = ∑ ∆ (4)
The new model becomes a nonlinear model (the nonlinear definition derives from the constructs of two new variables er
t+and er
t−). Combining equations (3) and (4) and equation (1), we obtain the nonlinear equation (5) in the long run:
0 1 1 2 3
2 ,
t t t t t t
sp = β + β
+er
++ β
−er
−+ β cp + β m + ε (5) And the error correction model:
( )
0 1 1 2 1 2 1 3 1
4 1 '
1
0 0
0
2
2 ,
t t t t t
p
t i t i
i
q r
' ' '
i t i i t i i t i
i i
s '
i t i t
i
sp sp er er cp
m sp
er er cp
m
λ λ λ λ λ
λ θ
γ γ δ
ϑ µ
+ + − −
− − − −
− −
=
+ + − −
− − −
= =
= −
∆ = + + + +
+ +
+ + +
∆
∆ ∆
+ +
∆
∆
∑
∑ ∑
∑
(6)
In it, all the variables have been defined before. The long-run estimates of each constituent in the exchange rate
are
21
β λ λ
+
= −
+for the price increase, and β
−= − λ λ
2−/
1for
the discount; meanwhile, γ
i+'and γ
i−'are short-run estimates
of price increases and discounts, respectively. Therefore,
equation (6) allows the long-run relationship between stock
prices and positive and negative components of the exchange
rate. In addition, the model also allows the presence of
asymmetric properties both in the short and long term, either
in the short term, or in the long term. Similarly equation (2),
i.e., the ARDL model, equation (6) allows testing asymmetric
long-run relationships between variables through F-statistic
test, long-run coefficients of the first lag variables:
H0: λ
1= λ
2+= λ
2−= λ
3= λ
4= (no long-run relationship) and
H1: λ
1≠ λ
2+≠ λ
2−≠ λ
3≠ λ
4≠ 0 (long-run relationship) Shin et al. (2014) confirmed that the ARDL method of Pesaran et al. (2001) can be applied to the nonlinear model in equation (6), therefore, the usual F-test standards of Pesaran et al. (2001) may also apply.
3.3. Data
In order to investigate the asymmetric relationship between exchange rate changes and stock prices in the Vietnamese market, the study uses a multivariate model, which contains variables including the VN-Index stock price,
exchange rate, multilateral nominal exchange rate (NEER), M2 and inflation (consumer price index). Monthly data for 2001:01 to 2018:05 are collected from various sources of Ho Chi Minh Stock Exchange (HOSE), Datastream and International Financial Statistics (IFS).
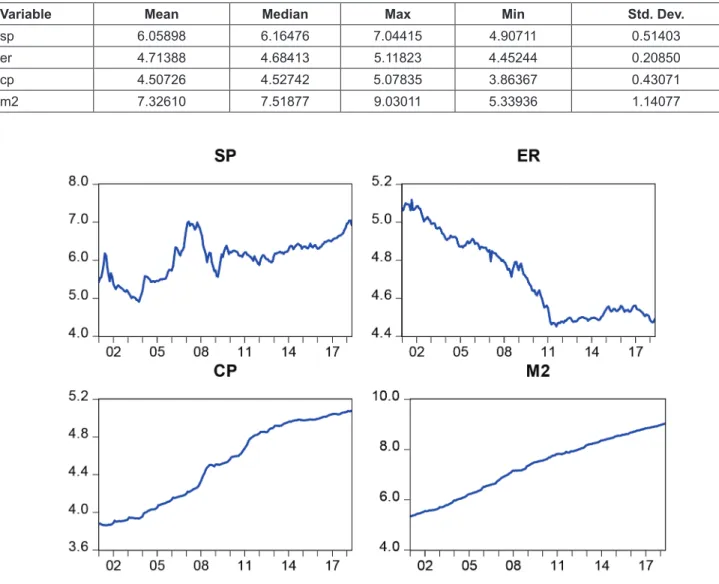
Where, monthly VN-Index data is calculated by averaging the VN-Index closed at the end of each trading day of the month. All variables are converted to logarithm for analysis. In addition, we have set up a binary dummy (brk) to capture the consequences of the 2008 global financial crisis. Based on the way to determine the start and end of the crisis of Luchtenberg and Vu (2015), the dummy variable brk is 1 in the period from August 2007 to March 2009 and is 0 in the remaining periods. Descriptive statistics and trends of variables are presented in Table 2 and Figure 1.
Table 2: Descriptive statistics
Variable Mean Median Max Min Std. Dev.
sp 6.05898 6.16476 7.04415 4.90711 0.51403
er 4.71388 4.68413 5.11823 4.45244 0.20850
cp 4.50726 4.52742 5.07835 3.86367 0.43071
m2 7.32610 7.51877 9.03011 5.33936 1.14077
Figure 1: Trend of variables
4. Empirical Results 4.1. Unit Root Test
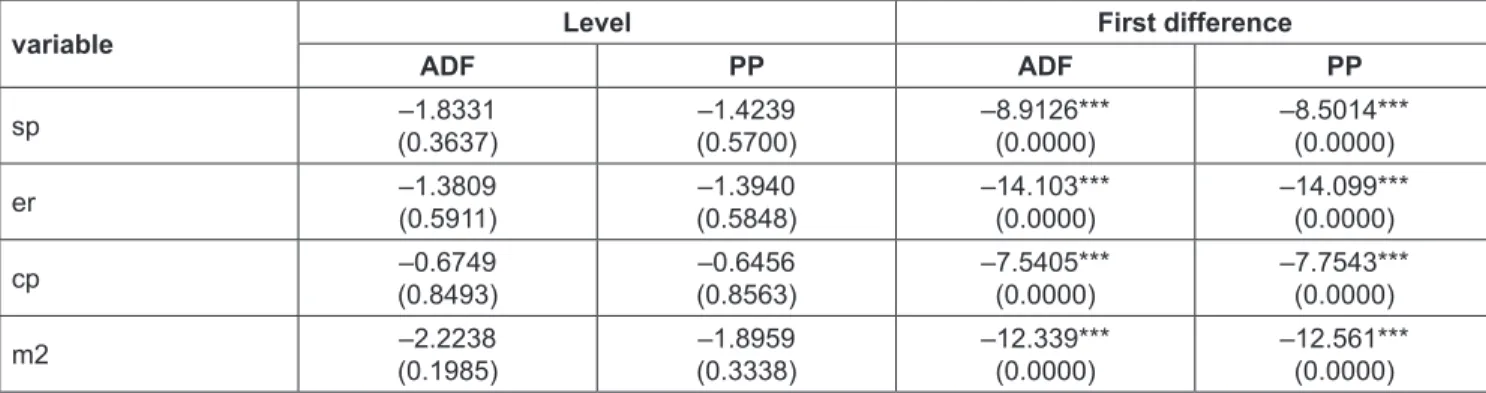
Although the ARDL or NARDL does not require a unit root test to check whether the variables are stationary at the same levels, both models apply I(0), I(1) or a mixture of them. However, before estimating ARDL and NARDL as well as verifying long-run cointegration relationship between variables, we conduct two unit root tests, including ADF (Augmented Dickey-Fuller) and PP (Philips-Perron) to avoid the presence of variables at the second difference, i.e., I(2); because of this case, F statistics becomes insignificant (Nkoro & Uko, 2016). The results in Table 3 show all of variables are stationary at the first difference (I(1)), while no variable is stationary at the second difference. Therefore, we can regress both ARDL and NARDL completely.
4.2. Test of Linear and Nonlinear Cointegration After testing for stationarity, we are going to conduct both ARDL and NARDL. Due to the relatively long monthly data, the maximum lagged level for the explanatory variables can be up to 4, the optimal lagged level of variables are determined based on AIC. Before analyzing the model results, we conduct cointegration tests (long-run relationship) between variables. Cointegration test is a test of F-statistics
based on the long-run coefficients of lag variables of the first difference in equation (2) – for symmetric cointegration test, and equation (6) – for control asymmetric copper bonding.
Table 4 shows that the F statistics obtained from the ARDL equation is 2.3088, less than the lower bound value at the significance 10% (2.37). Meanwhile, the F statistics in the NARDL is 4,0361, greater than the upper critical value at the significance 5% (3.49). The results show that the null hypothesis (without cointegration relation) can only be rejected in the NARDL. In other words, in the framework of linear models, there is no long-run relationship between variables; however, when referring to asymmetric properties (nonlinearity), the NARDL validates asymmetric cointegration relationships. This is an important finding, because the assumption of symmetry has not fully assessed the relationship between stock prices and its defined variables, similarly confirmed by Effiong and Bassey (2019).
4.3. ARDL Results
4.3.1. Short-Run Estimation Results
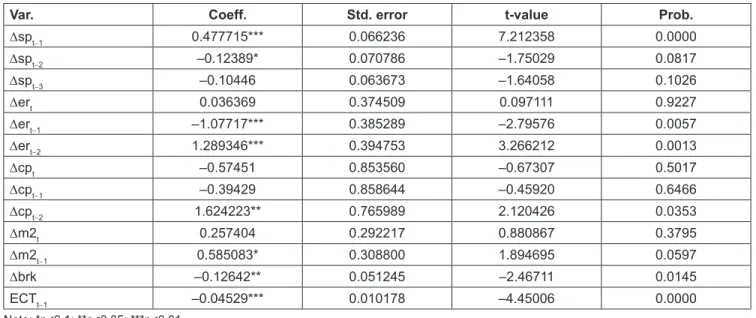
First, we present short-run results of the linear ARDL model to see if stock prices are influenced by short-run determinants. First, the exchange rate has an impact on the stock prices in the Vietnamese market, the coefficients of both the first and the second lag are significant.
Table 3: Unit root test
variable Level First difference
ADF PP ADF PP
sp –1.8331
(0.3637) –1.4239
(0.5700) –8.9126***
(0.0000) –8.5014***
(0.0000)
er –1.3809
(0.5911) –1.3940
(0.5848) –14.103***
(0.0000) –14.099***
(0.0000)
cp –0.6749
(0.8493) –0.6456
(0.8563) –7.5405***
(0.0000) –7.7543***
(0.0000)
m2 –2.2238
(0.1985) –1.8959
(0.3338) –12.339***
(0.0000) –12.561***
(0.0000) Note: ***p<0.01.
Table 4: Results of cointegration test
Model F - Statistic Bound (lower – upper) at significance level
Conclusion
10% 5% 1%
ARDL(4,3,3,2) 2.3088 (k=3) 2.37 – 3.2 2.79 – 3.67 3.65 – 4.66 Not accepted
NARDL(4,5,2,0,2) 4.0361 (k=4)** 2.2 – 3.09 2.56 – 3.49 3.29 – 4.37 Accepted
Note: **p<0.05.
However, the signs of these variables are inconsistent, so it is impossible to confirm the direction of the exchange rate effect on the stock prices in the short run. The effect of inflation is presented by Δcp, but only the second lag of this variable is statistically positive significant. This implies that an increase in consumer price will push up the stock prices in the short run. Similarly, increasing money supply stimulates stock prices, as evidenced by positive and negative coefficient of money supply at the first lag.
Finally, from the coefficient of binary variable brk, the 2007-2009 global financial crisis brings many negative consequences on Vietnam’s stock market in the short run, when the coefficient of dummy variable is negative significant. This is an important finding, because of previous studies in Vietnam, referring to the stock market have not illustrated negative impacts from the financial crisis. The term ECT is statistically negative significant (–0,04529).
This coefficient indicates that after the system shock, stock prices return to equilibrium with a rate of 4.529% per month.
4.3.2. Long-Run Regression Results
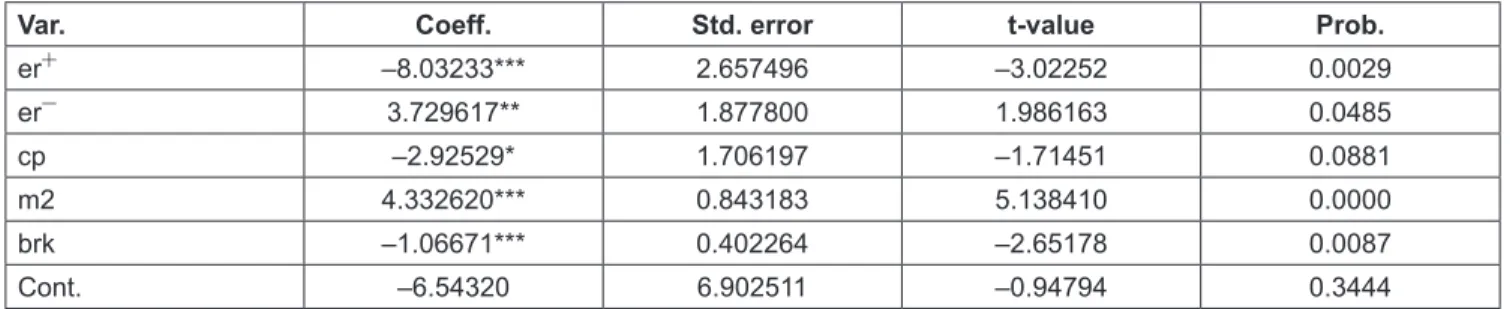
The long-run regression results are obtained from linear models. As shown in the previous section, the results of F-test cannot reject the null hypothesis H (no cointegration relation), in other words, there is no long-run relationship between stock prices and its determinants. The results of Table 5 also confirm in part when the exchange rate coefficient is not statistically significant. In other words, the exchange rate only affects the stock prices in the short run, but in the long run. The surveys of Bahmani-Oskooee and Saha (2015, 2016, 2018), Cheah et al.
(2017), and Cuestas and Tang (2017) state that there is a short- run relationship between stock prices and exchange rates when the symmetry adjustment process is assumed. However, we still find strong evidence of both negative and positive impacts of inflation and money supply on stock prices. The results may be clearly stated in the next section, when analyzing the results from the nonlinear framework, NARDL, where long-run asymmetric relationships are found between variables.
Table 5: The estimation results with dependent variable ∆sp
Var. Coeff. Std. error t-value Prob.
∆sp
t−10.477715*** 0.066236 7.212358 0.0000
∆sp
t−2–0.12389* 0.070786 –1.75029 0.0817
∆sp
t−3–0.10446 0.063673 –1.64058 0.1026
∆er
t0.036369 0.374509 0.097111 0.9227
∆er
t−1–1.07717*** 0.385289 –2.79576 0.0057
∆er
t−21.289346*** 0.394753 3.266212 0.0013
∆cp
t–0.57451 0.853560 –0.67307 0.5017
∆cp
t−1–0.39429 0.858644 –0.45920 0.6466
∆cp
t−21.624223** 0.765989 2.120426 0.0353
∆m2
t0.257404 0.292217 0.880867 0.3795
∆m2
t−10.585083* 0.308800 1.894695 0.0597
∆brk –0.12642** 0.051245 –2.46711 0.0145
ECT
t−1–0.04529*** 0.010178 –4.45006 0.0000
Note: *p<0.1; **p<0.05; ***p<0.01.
Table 5: The estimation results of the ARDL (4,3,3,2)
Var. Coeff. Std. error t-value Prob.
er –0.09846 2.646434 –0.03720 0.9704
cp –6.52381** 3.293863 –1.98059 0.0491
m2 2.832467*** 1.023770 2.766702 0.0062
brk –1.31407 0.818258 –1.60594 0.1100
Cont. 14.98622 20.19358 0.742128 0.4589
Note: *p<0.1; **p<0.05; ***p<0.01.
Next, we address some tests to choose the appropriateness of the regression model. Diagnostic tests of the model including serial correlation, heteroskedasticity, functional form and normal distribution. Table 6 shows that the linear model violates two assumptions including heteroskedasticity and normal distribution.
4.4. NARDL Model Results 4.4.1. Short-Run Results
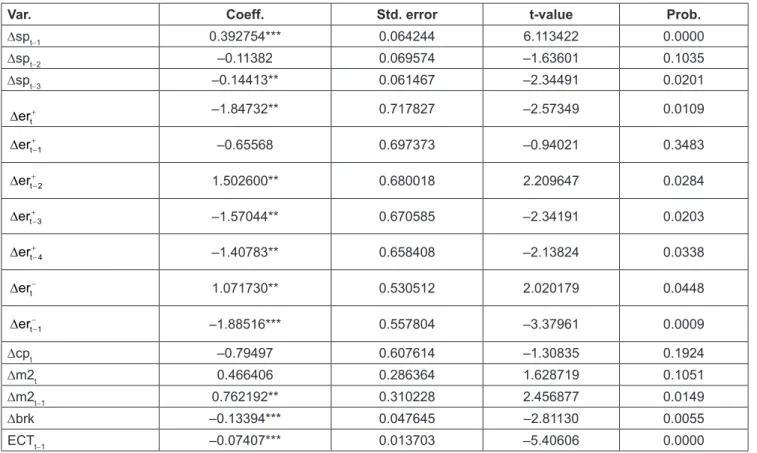
Similar to the presentation of ARDL results, in this section, we derive from short-run regression results.
By separating the exchange rate changes into positive components (representing currency appreciation) and
negative composition (currency depreciation), the model now contains four exogenous variables, instead of three variables in linear model. First, exchange rate changes affect stock prices in the short run, similar to the results in a linear framework. Differencing variables of positive and negative components are statistically significant, except that the coefficient of variance is divided into positive at the first lag. However, the sign of the coefficients is still inconsistent. Therefore, we have not been able to confirm the relationship between the price appreciation (depreciation) and the stock price in the short run. However, unlike the ARDL, the NARDL results do not show any significant short-run relationship between inflation and stock prices, but confirm the positive relationship between nominal M2 and stock prices. The evidence is that the coefficient of inflation variance is not statistically significant but money supply is significant.
In addition, the first difference of brk is still statistically negative significant that confirms again the negative impact of the global financial crisis on Vietnam’s stock market. The term of ECT is negative and significant, supporting the argument on the relationship between price control and long-run determinants. On the other hand, this coefficient is higher in the linear model, indicating a faster rate of return to the long- run equilibrium of the stock price in the nonlinear framework.
Table 6: The results of diagnostic tests
Test Statistic value Probability
Serial correlation LM 1.336895 0.2652 Heteroskedasticity 3.363420*** 0.0000
Normality test 30.30401*** 0.0000
Functional Form 1.063117 0.2891
Note: ***p<0.01.
Table 7: The estimation results with dependent variable ∆sp
Var. Coeff. Std. error t-value Prob.
∆sp
t−10.392754*** 0.064244 6.113422 0.0000
∆sp
t−2–0.11382 0.069574 –1.63601 0.1035
∆sp
t−3–0.14413** 0.061467 –2.34491 0.0201
∆ er
t+–1.84732** 0.717827 –2.57349 0.0109
+−
∆ er
t 1–0.65568 0.697373 –0.94021 0.3483
+−
∆ er
t 21.502600** 0.680018 2.209647 0.0284
+
∆ er
t 3−–1.57044** 0.670585 –2.34191 0.0203
+
∆ er
t 4−–1.40783** 0.658408 –2.13824 0.0338
∆ er
t−1.071730** 0.530512 2.020179 0.0448
−