Print ISSN: 2288-4637 / Online ISSN 2288-4645 doi:10.13106/jafeb.2021.vol8.no9.0045
An Application of the Smart Beta Portfolio Model:
An Empirical Study in Indonesia Stock Exchange
Ika Putera WASPADA
1, Dwi Fitrizal SALIM
2, Putri FARISKA
3Received: May 15, 2021 Revised: July 24, 2021 Accepted: August 02, 2021
Abstract
Stock price fluctuations affect investor returns, particularly, in this pandemic situation that has triggered stock market shocks. As a result of this situation, investors prefer to move their money into a safer portfolio. Therefore, in this study, we approach an efficient portfolio model using smart beta and combining others to obtain a fast method to predict investment stock returns. Smart beta is a method to selects stocks that will enter a portfolio quickly and concisely by considering the level of return and risk that has been set according to the ability of investors. A smart beta portfolio is efficient because it tracks with an underlying index and is optimized using the same techniques that active portfolio managers utilize. Using the logistic regression method and the data of 100 low volatility stocks listed on the Indonesia stock exchange from 2009–2019, an efficient portfolio model was made. It can be concluded that an efficient portfolio is formed by a group of stocks that are aggressive and actively traded to produce optimal returns at a certain level of risk in the long-term period. And also, the portfolio selection model generated using the smart beta, beta, alpha, and stock variants is a simple and fast model in predicting the rate of return with an adjusted risk level so that investors can anticipate risks and minimize errors in stock selection.
Keywords: Capital Asset Pricing Model, Portfolio, Smart Beta, VaR, Indonesian Stock Exchange JEL Classification Code: D81, G11, G12, G13, G17
1. Introduction
Asset pricing models describe the prices or expected rates of return of financial assets, which are claims traded in financial markets. In 1952 Markowitz introduce portfolios, which were used to manage several assets by considering the level of return and risk. Sharpe made a Capital Asset Pricing Model (CAPM) model to assess an asset based on the market as a benchmark. The Capital Asset Pricing Model (CAPM) describes the relationship between systematic risk and expected return for assets,
1
First Author. Lecturer. Faculty of Economics and Business, Universitas Pendidikan Indonesia, Indonesia.
Email: [email protected]
2
Lecturer. Faculty of Economics and Business, Telkom University, Indonesia. Email: [email protected]
3
Corresponding Author. Lecturer. Faculty of Economics and Business, Telkom University, Indonesia [Postal Address: Telekomunikasi Street, No. 1, Buah Batu, Dayeuhkolot, Bandung, West Java, 40257, Indonesia] Email: [email protected]
© Copyright: The Author(s)
This is an Open Access article distributed under the terms of the Creative Commons Attribution Non-Commercial License (https://creativecommons.org/licenses/by-nc/4.0/) which permits unrestricted non-commercial use, distribution, and reproduction in any medium, provided the original work is properly cited.
particularly stocks. CAPM is widely used throughout finance for pricing risky securities and generating expected returns for assets given the risk of those assets and cost of capital. The Sharpe ratio, often known as the CAPM, assesses portfolio performance based on standard deviation. Risk is quantified in the CAPM using a normal return distribution or an efficient market; however, the market is inefficient and the rate of return obtained is abnormal, therefore the performance predictions given by the CAPM are inaccurate and can be misleading to investors (Bernardo & Ledoit, 2000). This is in line with research conducted by Malkiel and Saha (2005), who stated that abnormal returns from mutual funds will significantly affect future return predictions. Based on the statement above, the Sharpe ratio began to be questioned by a number of researchers.
To anticipate abnormal returns, it is necessary to assess
the assets. According to Zakamouline (2010), portfolio
performance can be measured through risk assessment
using the value at risk (VaR) approach, but VaR can only
be used to filter stocks with high and low volatility. VaR
can also be used for certain conditions even if the market
as a benchmark produces abnormal returns. A market that
produces abnormal returns is a market that has an up and
down condition simultaneously, which will have an impact on market price movements. And with daily data, results for predicting stock returns are more accurate than monthly data (Phuoc et al., 2018).
To significantly reduce the level of portfolio risk, the Conditional Value at Risk (CVaR) can be used (Sivaramakrishnan & Stamicar, 2017). Meanwhile, to measure stock returns to the market as a benchmark, it can be calculated using the Alpha approach. A positive alpha is used to measure performance and a large contribution is needed to achieve positive alpha because the market does not run efficiently. This is in line with research conducted by Jarrow (2010), who stated that investors who invest in mutual funds must be careful of investment managers who offer positive alpha. It is very difficult to get these results because the market as a benchmark does not run efficiently. According to Buser (2015), for small assets that are actively managed, choosing stocks with an alpha value close to zero will be beneficial, but the concept of diversity becomes a big concern and can weaken the alpha value of the portfolio. Portfolio diversification, according to Huynh and Dang (2020), will offer a significant risk, despite the fact that this study used loan portfolio diversification in the banking system.
Many studies have been conducted to achieve portfolio optimization, one of which is the creation of a portfolio with a Covariance Matrix. In recent years, however, a new approach to index investing—smart beta—has started to gain traction among investors. Smart beta refers to an enhanced indexing strategy that seeks to exploit certain performance factors in an attempt to outperform a benchmark index. In this sense, smart beta differs fundamentally from a traditional passive indexing strategy (Bender et al., 2014; Kahn & Lemmon, 2015).
Nguyen et al. (2020) provided the practical application of a linear shrinkage framework on the Vietnam stock market. The empirical results showed that the shrinkage of the covariance matrix for portfolio optimization gives promising results for the investors on the Vietnam stock market. The shrinkage method helps the investors to produce the optimal portfolio in the sense of having higher profits with lower levels of risk compared to the portfolio of the traditional SCM method. Moreover, the portfolio turnover of the shrinkage method is always kept at low magnitudes, and this makes the shrinkage portfolios save much transaction costs and reduce the liquidity risks in the trading process. In addition, the ability of the shrinkage method in making profits is once again confirmed by the alpha coefficient that achieves a high positive value. Based on the explanation above, this research will develop a portfolio model using the smart beta, alpha, and Value at Risk (VaR).
2. Literature Review
2.1. Capital Asset Pricing Model (CAPM)
The Capital Asset Pricing Model (CAPM) states that there is a positive relationship between beta and return, but the robustness test of the CAPM conducted by researchers such as Fama and MacBeth (1973), Haugen and Heins (1975), Black et al. (1972) predicted the relationship between the rate of return and the risk is flatter than what the CAPM predicted. Then the CAPM continues to be tested in a return prediction model based on beta values. But, Baker et al.
(2011) and Clarke et al. (2006), found a negative relationship between beta and return. As a predictor of alpha value, positive alpha cannot be separated from the beta factors that shape it. The more exact the factors in a predictive model, the higher the investment return generated (Cochrane, 2005).
Beta values are not based on constant values alone but are highly dependent on the period of observation (Grinblatt &
Titman, 1989).
2.2. Smart Beta
Smart beta was introduced by Arnott et al. (2005), where smart beta aims to find a method in finding factors that have an impact on increasing stock returns. According to Marsh and Pfleiderer (2016), a portfolio must make changes to achieve a return that is consistent with the market’s return, as well as recognizing the indicator that will influence the portfolio’s return. Research in smart beta has different conclusions, but according to Amenc et al. (2016), a smart beta method is used as a marketing strategy for investment companies to attract their potential investors to buy their investment products.
Smart beta is a method used to predict the best return on short-term investments (Hodges et al., 2017). According to Grinold (2018), portfolio design should be based on investment objectives adjusted to the factors that affect the return. In addition, the design of a portfolio must have scenarios to overcome the risks and diversifying reliability because it can significantly increase long-term investment returns (Gosling, 2010).
2.3. Low Volatility
Investing in low volatility assets is a smart beta method that has an impact on increasing the Sharpe ratio perfor- mance in inefficient market conditions (Ghayur et al, 2013).
Prior to the concept of volatility, the anomaly concept was
first known based on the movement of an asset as documented
by Black et al. (1972). Stocks with low volatility conditions
have higher performance than high volatility stocks which
can be calculated using the CAPM method. This is in line with the opinions expressed by Frazzini and Pedersen (2014), Baker and Haugen (2012), and Blitz et al. (2013). Anomalies will occur in both emerging and non-emerging countries.
Even the impact of the anomaly will be stronger if it is calculated using a simple volatility calculation from the CAPM.
When the market experiences anomalies, it has an impact on the level of price fluctuations and if there is a prediction bias, investors will act rationally (Blitz et al., 2014). These results are based on leverage and short-selling conditions.
Investors minimize high risk and maximize utility by focusing exclusively on the average of return variances over a single period, with complete and logically processed data, indicating that the market is efficient (such as assets divided perfectly, no transaction fees, perfect liquidity, and no taxes). Stocks that have a low beta have good performance when compared to stocks that have a high beta value (Fama & French, 1972), and stocks with low volatility in global markets (non- emerging) have good performance (Ang et al., 2009).
Meanwhile, it is recommended that when determining the level of volatility, the same weight be applied based on the variance of each stock in the portfolio (Blitz & Vliet, 2007), which will result in the best Sharpe performance from the portfolio guided by the minimum variance as suggested by Clarke et al. (2006).
2.4. Hypotheses
Portfolio theory, CAPM theory, and a smart beta approach have been combined to create a novel method that tries to find a smart model of several variables that are assumed to influence stock returns. The implementation of the smart beta will ultimately have an impact on investors’ decisions in choosing which stocks to include in the portfolio. This study tries to create a model to calculate stock returns and can predict whether the stock returns are aggressive (above the market return) or non-aggressive (below the market return).
The model will be formed by combining the variables beta (Sharpe, 1964), alpha (Jensen, 1968), and value at risk studied by Fogler (1982) and Haugen and Heins (1975). This study has the following hypotheses:
H1: Beta has a significant effect on stock returns.
H2: Alpha has a significant effect on stock returns.
H3: Value at Risk has a significant effect on stock returns.
3. Research Methods
The sample selection was determined based on VaR from the 2009–2019 monthly stock return data on the Indonesia Stock Exchange. From this calculation, 100 low volatility
stocks were obtained. The stock return obtained is calculated based on:
0
0 t i
p p
R p
= −
While Beta can be used to calculate SLOPE, Alpha for INTERCEPT, and VAR for Value at Risk, these figures are derived from the movement of monthly stock returns, which can be done in MS Excel or by using the formula:
BETA =
2 im i
m
=
ALPHA =
i= E R (
i) −
i. E R (
m)
VAR =
2 2
1
( ( ))
n it i
i
R E R
= = − n
The model that will be formed is guided by the CAPM model which uses a risk-free rate (represents the interest an investor would expect from a risk-free investment over a specified period of time) for the risk premium which can be calculated using the following model:
( )
i b m f
R = + a R − R
In testing the relationship between the dependent and independent variables, this study uses logistic regression.
According to Ali et al. (2018), logistic regression is used with the aim of finding optimal stock return prediction opportunities and ultimately forming an efficient portfolio that is in accordance with the objectives of this study, which can be calculated by the following formula:
( ) ( ) ( )
i b m f a m f v m f
R = + a R − R + R − R + R − R
Where is the beta of the stock,
b is the stock of
aalpha, and is a Value at Risk of the stock; it is written in
vthe logistic regression model with the following formula:
( )
( )
1 2 3
1 2 3
1
a X X X
i f a X X X
R R e e
+ + +
+ + +
− =
+
From the above model, aggressive stocks can be grouped
which is represented by binary code 1. An aggressive stock is
a higher-risk investment that can potentially produce higher
returns (above market returns) than more conservative
stocks, but also has equal potential for bigger losses. Non-
aggressive stocks are groups of stocks that have returns less
than the market returns. By using logistical calculations, it is
possible to look for opportunities from a number of factors that make up a model (Zandi et al., 2018).
4. Results and Discussion 4.1. Empirical Results
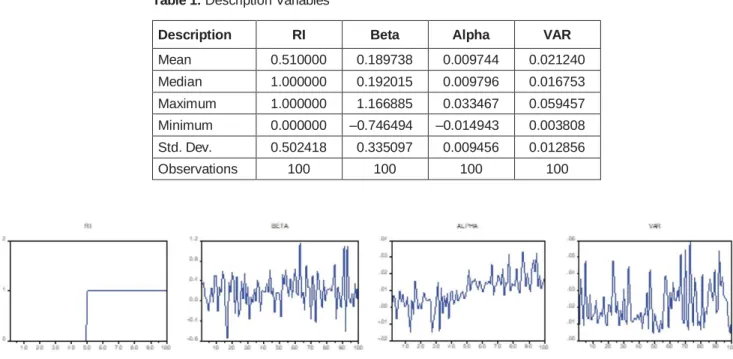
For the accuracy of the smart beta model produced in this study, a significance level of 5% or <0.05 is used. The results of the description of the independent variables are beta, alpha, and VaR as follows (Table 1).
By using 100 stocks, it can be concluded from Table 1 that there are 51 stocks that have stock returns above the market and 49 stocks below the market. This can be seen from the stock returns that have been categorized into binary codes 1 and 0. Code 1 is a stock that has a return above the market and is grouped into the aggressive stock category, and code 0 is a non-aggressive stock where the stock return obtained is below the market return.
The results of the beta variable show that there are companies that have a positive value of more than 1. This means that if the market’s risk is 1, the stock’s risk is 1.5 times that of the market, implying that stocks with a high level of fluctuation that outperforms the market will have an impact on stock returns. If viewed from the alpha value, it can be seen that there is a sample that has a negative value, this indicates that the return obtained is below the market value. The stock is grouped into stocks that are not aggressive and fail to achieve a return above
the market. While the VaR variable’s findings show that there is no negative value; this is due to the VaR variable’s function, which measures the level of fluctuation in price movements that would affect returns. Theoretically, there is no negative risk, and when the standard deviation value is considered, it can be determined that there is no excessive bias and that the data can explain the interpretation for each variable that is useful for achieving research objectives.
Figure 1 shows the movement of the data on each of the independent and dependent variables. Stock returns categorized in binary 1 and 0 indicate that more than half of the samples are in category 1 and the rest are in category 0. While in the beta variable, there is an average variation between positive and negative values. This indicates that the risk of stocks to the market varies widely in a sample of 100 low volatility stocks in Indonesia.
Furthermore, for the alpha variable, it can be seen that on average, the return of 100 stocks is above the market which can be seen in more than half the movement of the candle above the value of 0. Only a few stocks have negative alpha values. While VaR does not have a negative value, this result proves that there is no negative risk, so that the inherent meaning of every investment will be inherent in risk. The size of the risk depends on the investor interpreting the risk (Rizal et al., 2018).
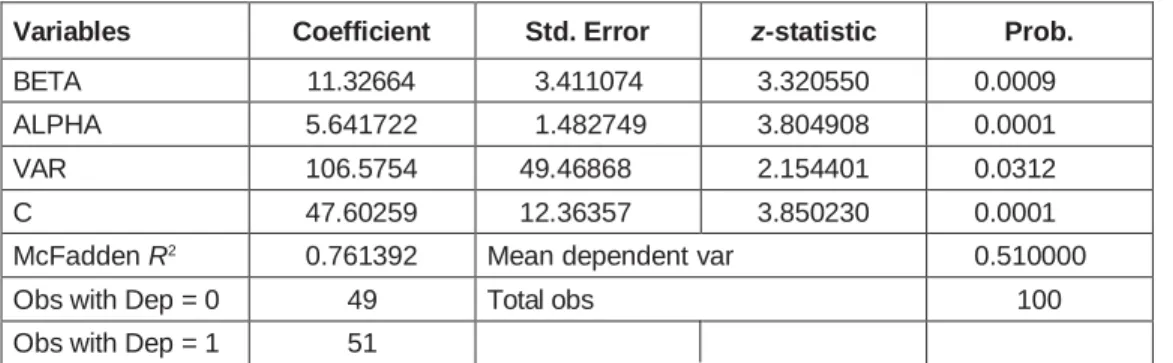
Based on the results of logistic regression, the beta variable has a positive effect on stock returns, so it can be concluded that H1 is accepted. This result is in line with
Table 1: Description Variables
Description RI Beta Alpha VAR
Mean 0.510000 0.189738 0.009744 0.021240
Median 1.000000 0.192015 0.009796 0.016753
Maximum 1.000000 1.166885 0.033467 0.059457
Minimum 0.000000 –0.746494 –0.014943 0.003808
Std. Dev. 0.502418 0.335097 0.009456 0.012856
Observations 100 100 100 100
Figure 1: Smart Bata Graph
previous research conducted by Fama and MacBeth (1973), Haugen and Heins (1975), and Black et al. (1972) but contradicts with research conducted by Baker et al. (2011) and Clarke et al. (2010). This result also proves that an increase in the stock beta will have an impact on increasing stock returns. This is because stocks move in sync with market movements, and the higher the beta value of a stock, the higher the risk associated with market risk.
Variable alpha has a positive effect on stock returns in other words H2 is accepted. It may be argued that the higher the stock of alpha value, the larger the impact on stock returns that outperform the market. If the beta of the stock is 1, then the level of stock risk will be the same as the market, and vice versa if the market moves down, the stock will fall following the magnitude of the decline in the market (Table 2).
VaR has a positive effect on stock returns, so H3 is accepted. These results are in line with research by Sivaramakrishnan and Stamicar (2017) and Zakamouline (2010). So it can be concluded that high stock volatility will have a positive impact on stock returns. Stock price fluctuations will have an impact on the returns obtained by investors and investors will be faced with high uncertainty or risk.
bis a beta variable or can be referred to as market risk which is the advantage of Sharpe’s CAPM model (Sharpe, 1964).
ais an alpha variable that shows stock returns compared to market returns.
vis the Value at Risk (VaR) risk which is calculated from the fluctuation level of stock returns. The logistic regression model in this study is as follows:
( )
( )
1 2 3
1 2 3
47.6 11.3 5.6 106.5
47.6 11.3 5.6 106.5
1
X X X
i f X X X
R R e e
+ + +
+ + +