Print ISSN: 2288-4637 / Online ISSN 2288-4645 doi:10.13106/jafeb.2021.vol8.no5.0839
Optimum Risk-Adjusted Islamic Stock Portfolio Using the Quadratic Programming Model: An Empirical Study in Indonesia
Noor Saif Muhammad MUSSAFI1, Zuhaimy ISMAIL2
Received: February 10, 2021 Revised: April 05, 2021 Accepted: April 15, 2021
Abstract
Risk-adjusted return is believed to be one of the optimal parameters to determine an optimum portfolio. A risk-adjusted return is a calculation of the profit or potential profit from an investment that takes into account the degree of risk that must be accepted to achieve it. This paper presents a new procedure in portfolio selection and utilizes these results to optimize the risk level of risk-adjusted Islamic stock portfolios.
It deals with the weekly close price of active issuers listed on Jakarta Islamic Index Indonesia for a certain time interval. Overall, this paper highlights portfolio selection, which includes determining the number of stocks, grouping the issuers via technical analysis, and selecting the best risk-adjusted return of portfolios. The nominated portfolio is modeled using Quadratic Programming (QP). The result of this study shows that the portfolio built using the lowest Value at Risk (VaR) outperforms the market proxy on a risk-adjusted basis of M-squared and was chosen as the best portfolio that can be optimized using QP with a minimum risk of 2.86%. The portfolio with the lowest beta, on the other hand, will produce a minimum risk that is nearly 60% lower than the optimal risk-adjusted return portfolio. The results of QP are well verified by a heuristic optimizer of fmincon.
Keywords: Islamic Stock Portfolio, Risk-Adjusted Return, Technical Analysis, Portfolio Optimization, Quadratic Programming JEL Classification Code: C44, C61, G32
certain time-frame. Besides, each investment mechanism is always associated with two opposing problems, particularly risk and return. Both are strongly related and are important benchmarks in investment decision-making. As a broad rule in the economy, one who seeks lower risk must expect lower return too and vice versa.
In recent years, Islamic stock investment is claimed to experience rapid growth in some countries such as Bahrain, Egypt, Indonesia, Kuwait, Malaysia, Pakistan, Qatar, Saudi Arabia, Turkey, and United Arab Emirates (Hussain et al., 2015). This Islamic stock or ethical-based investment does not only obtain a broader acceptance but also recorded better performance appreciation compared to the conventional stocks. As with conventional, the investors also hope to gain profit from their Islamic stock investment. To meet this target, they need to have a virtuous strategy, particularly on risk reduction.
Portfolio risk is a chance that the combination of assets or units, within the investments that you own, fails to meet financial objectives. Each investment within a portfolio carries its own risk, with higher potential return typically meaning higher risk. There are numerous approaches that have been used by scholars to reduce portfolio risk.
1 First Author. [1] Department of Mathematics, UIN Sunan Kalijaga, Indonesia [2] Department of Mathematical Sciences, Universiti Teknologi Malaysia, Malaysia. Email: [email protected]
2 Corresponding Author. Department of Mathematical Sciences, Universiti Teknologi Malaysia, Malaysia [Postal Address: No. 21 Jalan Sejahtera 9, Taman Desa Skudai 81300, Skudai, Johor Bahru, Malaysia] Email: [email protected]
© Copyright: The Author(s)
This is an Open Access article distributed under the terms of the Creative Commons Attribution Non-Commercial License (https://creativecommons.org/licenses/by-nc/4.0/) which permits unrestricted non-commercial use, distribution, and reproduction in any medium, provided the original work is properly cited.
1. Introduction
Optimum stock portfolio relates to the group of stocks with the highest return-to-risk combination of investments.
The optimal portfolio is a term used to refer to Efficient Frontier with the highest return-to-risk combination given the specific investor›s tolerance for risk. This choice is frequently favored by investors, even risk-averse (someone who avoids taking risk) investors, in making long-term investments.
They argue that the optimum portfolio is theoretically based on estimation from historical data. Commonly, the historical data considers the historical price of a stock based on a
Shadkam (2014) filtered all the Tehran stocks with reference to FC (first Clustering, then Factor analysis method) while Pratiwi and Yunita (2015) did a comparative study on selecting portfolios using a single index model and constant correlation model. Škrinjarić and Šego (2019) applied a Grey Relational Analysis (GRA) approach that considers market factors, return distribution characteristics, and financial statements on portfolio selection. On the other hand, in terms of portfolio optimization, Mussafi (2012) optimized securities (stock, bond, and money market of US) using Mean-Variance Optimization. Yousfat (2015) used the Lagrange multiplier approach to select the optimum portfolio of the Malaysian stock exchange, Nguyen et al.
(2020) employed linear shrinkage of covariance in producing a high return of the portfolio, and Ginting et al. (2021) replaced Markowitz mean-variance by the mean-ARCH model to obtain optimal portfolio in Indonesia Composite Stock Index.
In this paper, we explore another approach in considering the ideal number of stocks for a portfolio and classifying the stocks by considering technical analysis that is dissimilar from what was done by Shadkam (2014) and Pratiwi and Yunita (2015). Moreover, we outspread the paper of Škrinjarić and Šego (2019), Yousfat (2015), and Mussafi (2012) by adding the final selection procedure of stock portfolio using risk-adjusted performance, namely M-squared, introduced by Modigliani brothers in Bhati and Parashar (2019) and Hsieh (2013). This will help investors to evaluate returns taking into account portfolio risk associated with the market proxy risk. We also extend the paper of Nguyen et al. (2020) and Ginting et al. (2021) by formulating the portfolio model using Quadratic Programming and implementing the model using MATLAB to quickly obtain the result. Last but not least, the datasets used in previous studies mainly deal with conventional stock index, however, this paper will use a dataset from one of the Islamic stock indices in Indonesia.
The objective of this paper is to construct the optimal risk- adjusted Islamic stock portfolio using specific procedures namely obtaining the number of issuers included in the portfolio, classifying the stocks into four groups with altered risk indicators, and confirming the final risk-adjusted- performance. Besides, we will also minimize the risk of the nominated portfolio by executing a Quadratic Programming (QP) model and considering stock weighting for investment.
This paper is arranged as follows. First, we deliver literature on Islamic stock, descriptive statistics, risk indi- cators used in technical analysis, risk-adjusted performance, and Quadratic Programming. We then proceed with the discussion on the methods used in this study. Next, we present our results and discussion. We end the paper with a conclusion section.
2. Literature Review
2.1. Islamic Stock PortfolioA stock is a general term used to describe the ownership certificates of any company and a stock portfolio is a collection of stocks that you invest in with the hope of making a profit. As stated earlier, Islamic stock has shown great potential for growth and profitability in some countries. For instance, according to Setiawan and Kanila Wati (2019), the development of Sharia mutual funds in Indonesia has been increasing due to the increase in the number of products and total Net Asset Value (NAV).
In 2018, there were 224 products registered under Otoritas Jasa Keuangan (OJK), a sharp increase from 48 products registered in 2010. In terms of NAV, by the end of 2018, a total of IDR 34.5 trillion funds is being managed, a 556.34% increase from 2010 (Otoritas Jasa Keuangan, 2019). Surprisingly, for 2018, 61 of the products are Islamic stocks with a total NAV of IDR 10.38 trillion (Setiawan &
Kanila Wati, 2019).
Some researchers also exposed that the performance of Islamic stocks tends to be equal or even better than the conventional stocks in terms of return (Karim et al., 2014;
Kare & Fu (2014) and stable during the financial crisis or abnormal situation (Moh’d Mahmoud et al., 2012; Ho et al., 2014). Furthermore, these Islamic stocks need to comply with shariah standards or Islamic law of transactions (Muamalat).
As mentioned in Alam et al. (2017), the OJK classifies stocks as shariah-compliant if the issuer company affirms that its business activities and management are conducted based on the shariah principles and it is not convoluted in any of the following businesses: (1) Gambling; (2) Conventional bank; (3) Producing, distributing, trading and/or providing products or services that are forbidden by the National Shariah Board-MUI; (4) Trading of risk that contain gharar (uncertainty).
2.2. Descriptive Statistics and Properties used in Technical Analysis
Suppose that a stock has a measurement horizon of one week. Returns are measured from the end of the preceding week, denoted by t – 1, to the end of the current week, denoted by t. Jorion (2007) defined geometric rate of return rt (logarithmic of the price) and geometric mean return Rt for t = 1, ..., n as follows
r P
P R
r
t t n
t t
t t
n
= =
−
∑
=ln
1
and 1 (1)
One of the most common standard measures of risk is based on standard deviation. Suppose rit denotes return for i–th asset (with i = 1, ..., N ) at the time t = 1, ..., T and ri is the mean rate of return. As mentioned in Elton et al. (2014), the standard deviation and average squared deviation (variance) on the i–th asset are
σ = − σ
= −
= =
∑
(rit Tri)∑
(r Tr)t
T it i
t T 2
1
2 2
1
and (2)
Typically, the variance-covariance matrix has a variance along with the diagonal element and the covariance appears in the off-diagonal element (Nguyen et al., 2020). The formula for calculating the covariance between any two assets i, j is
cov(R R, ) ( )( )
T r r r r
i j it i jt j
t T
= − −
∑
=1
1
(3)
The subsequent significant term of risk is the beta coefficient. It measures the systematic risk of individual stock in comparison to the unsystematic risk of the entire stock market. Let Rp be the return on individual stock and Rm be the return on the joint-stock market, the beta coefficient can be expressed as
β =Cov
Var
( , )
( ) R R
R
p m
m (4)
The Treynor ratio is reliant upon a portfolio’s beta that is, the sensitivity of the portfolio’s returns to movements in the market to judge risk (Hsieh, 2013). Let rp be portfolio return, rf be risk-free rate, and βp be beta of the portfolio, then
Treynor ratio=rp−rf
βp (5)
The last risk indicator used to measure the potential of losses is Value at Risk (VaR). It is lower α–percentile than a random variable (Sarykalin, Serraino, & Uryasev, 2008).
Let X be a random variable with the cumulative distribution function F zX( )=P X z X{ ≤ }, may represent either loss or gain. The VaR of X with confidence level α ∈[ , ]0 1 is
VaRα( )X =min{z F zX( )≥α} (6) In a range of portfolios or a set of stocks, let w be the weight of stocks in the portfolio, μ be the expected return of stocks in the portfolio, and ∑ be the variance-covariance matrix. Hartono (2013) consecutively employed the following formula for obtaining portfolio expected return and portfolio standard deviation.
E R( p)=wTµ and σp =(w wTΣ )
1
2 (7)
2.3. Risk-Adjusted Performance
Modigliani risk-adjusted performance (also known as M2) is a measure of the risk-adjusted returns of some investment portfolio. It measures the returns of the portfolio, adjusted for the risk of the portfolio relative to that of some benchmark (e.g., the market). The measure of M2 can be interpreted as the difference between the scaled excess return of a portfolio and that of the market, where the scaled portfolio has the same volatility as the market. Technically, M2 is derived from the widely used Sharpe ratio, but it has the significant advantage of being in units of percent return (as opposed to the Sharpe ratio – an abstract, dimensionless ratio of limited utility to most investors), which makes it dramatically more intuitive to interpret. Bhati and Parashar (2019) proved that M2 is the most comprehensive and robust risk-adjusted return measure compared to other ratios. Suppose rp is the return of a portfolio, rm is the return of market proxy, rf is the risk-free rate, σp is the standard deviation of a portfolio, and σm is the standard deviation of market proxy (Hsieh, 2013). The M2 ratio can be established as follow:
M r r r r
p m p f
p
m f
m
2 = × −
− −
σ σ σ (8)
2.4. Optimization and Quadratic Programming Optimization can be labeled as the collection of techniques, methods, procedures, and algorithms that can be used to find the optimum solution. Before this, optimization was primarily implemented for Linear Programming problems, however, currently, many experts implement optimization for Nonlinear Programming problems, particularly on complex problems. Consider the following Nonlinear Programming problem
Minimize ( )
( ) , ...,
( ) , ...,
f x
g x i m
h x i
i i
subject to for
for
≤ =
= =
0 1
0 1 ll
x X∈ ,
(9)
where f, g1, ..., gm, h1, ..., hl are functions defined on Rn, X is a subset of Rn, and x is a vector of n components x1, ..., xn. Equation 9 must be solved for the values of the variables x1, ..., xn that satisfy the constraints function (both inequality gi(x) and equality hi(x)) while minimizing the objective function f. The set X might typically include lower and upper bounds on the variables (Mokhtar & Hanif, 2006).
Quadratic Programming (QP) is one of the Nonlinear Programming methods. QP is the process of solving certain mathematical optimization problems involving quadratic functions. Specifically, one seeks to optimize (minimize or maximize) a multivariate quadratic function subject to linear constraints on the variables. Observe that the below quadratic program represents a special class of Nonlinear Programming problems in which the objective function is quadratic while the constraints are linear. As mentioned in Mokhtar and Hanif (2006) and Mussafi (2012), suppose c is an n–vector, b is an m–vector, A is a m × n matrix, and H is a n × n symmetric matrix, the standard QP is defined as
min
. ,
1 2
0 x Hx c x s t Ax b x
T + T
= ≥
(10)
As can be seen in Equation 10, since the feasible set is polyhedral and H is symmetric and positive semidefinite, the objective function is convex.
2.5. Heuristic Method
The heuristic method is an approximate algorithm that is used to verify constantly improving solutions that will outcome in acceptable answers, i.e., not differ too much from the exact solution. One way to come up with approximate answers to a problem is to use a heuristic, a technique that guides an algorithm to find good choices. When an algorithm uses a heuristic, it no longer needs to exhaustively search every possible solution, so it can find approximate solutions more quickly. It is an iterative search that holds stochastic approximation in generating new candidate solutions and/or in deciding whether these substitute their predecessors while still integrating some instrument that allows improvements (Gilli & Schumann, 2012).
As one of the heuristic methods, Sequential Quadratic Programming (SQP) was proven to solve nonlinear program- ming (Eq. 9). SQP generates convergent iteration to the solution of the problem by solving a sequence of quadratic programming that approximates the exact solution (Morales, 2012). MATLAB provides an SQP based nonlinear programming solver by applying “fmincon”. The syntax finds a local constrained minimum of a scalar function of multivariable starting at an initial estimate (MathWorks Inc, 2020).
2.6. Percentage Error
Percent error (sometimes referred to as fractional difference) measures the accuracy of a measurement by the discrepancy between a measured or experimental value E and a true or accepted value A (Taylor, 1997). It can be adopted to test the accuracy level of the model. The closer the percentage is to zero, the better the accuracy. The percent error is calculated from the following equation:
Percent Error=|E A− |×
A 100 (11)
3. Materials and Methods
The data collected for this study is secondary data that are publicly published via relevant websites (Yahoo Finance and Investing.com). The dataset contains 3 years weekly closing data price of active Islamic stock index company associated with JII from 1st June 2016 to 31st May 2019 (156 weeks). The samples for this study include all issuers registered on Jakarta Islamic Index (JII), which are Islamic-compliant investments.
JII constituents consist of 30 most liquid Islamic shares on Indonesia Stock Exchange (IDX). Constituents in the index must be listed in the review of Daftar Efek Syariah (DES) that is published twice a year, in May and November, by Otoritas Jasa Keuangan (OJK). The monetary policy of Bank Indonesia, particularly related to interest, is also considered as a proxy of risk rate during the same period. Last but not the least, the profile, regulation, and list of issuers corresponding to JII are obtained from the websites of OJK and IDX.
This chapter also illuminates the research methodology including the strategies to solve the problems. The method used by this research is descriptive quantitative method. Descriptive research is a quantitative research method that attempts to collect quantifiable information for statistical analysis of the population sample. It is a popular market research tool that allows us to collect and describe the demographic segment›s nature. The historical close price of the stocks is analyzed using descriptive statistics. Next, portfolio selection is done by considering the ideal number of stocks in a portfolio.
Owning too few different stocks means an investor does not diversify his investment while handling too many stocks will prove to be too complicated to any investor. Thus, factors like country invested in, time horizon, and systematic risk need to be factored upon. This research will calculate the systematic risk or volatility for each possibility.
The next step is grouping the issuers into four portfolio groups using technical analysis. This analysis relies on four investment risk indicators such as variance, beta, Treynor ratio, and Value at Risk (VaR). These indicators are chosen based on investor preferences in this research, namely, risk- averse (an investor who prefers a lower return with known risk rather than a higher return with unknown risk). Variance indicates the dispersion of returns obtained from standard deviation and VaR which predicts worst-case loss with a specific confidence level over a period of time. Furthermore, both the beta and Treynor ratios measure the systematic risk of portfolios. The portfolio selection stage ends with selecting the best risk-adjusted return of the portfolio by employing the M-squared method. This method has been used by Bhati and Parashar (2019) to study the Indian mutual fund industry, where they found that it is the most comprehensive
risk-adjusted measure compared to other measures such as Sharpe and Jensen Alpha.
After having the designated portfolio, then the study continues with portfolio optimization. This process starts with computing some related variables, such as variance-covariance matrix, geometric mean return, and expected return, to be added into the QP model. The objective of the model is to reduce the variance or risk of Islamic stock portfolio investment by assuming the investor as risk-averse. Note that short selling, an act that speculates on the decline in a stock price is not allowed.
After that, a computational program is constructed based on the corresponding QP model to acquire the optimal risk and stock weighting. Additionally, the results of QP will be verified using the heuristic method to approach the true optimum. To find out the accuracy of the calculation, the percent error between the exact solution and the heuristic will be applied.
4. Results and Discussion
4.1. Descriptive StatisticsIDX regularly updates the list of 30 issuers of JII every six months based on a list of DES released by OJK.
Meanwhile, the Board of Commissioners of OJK routinely
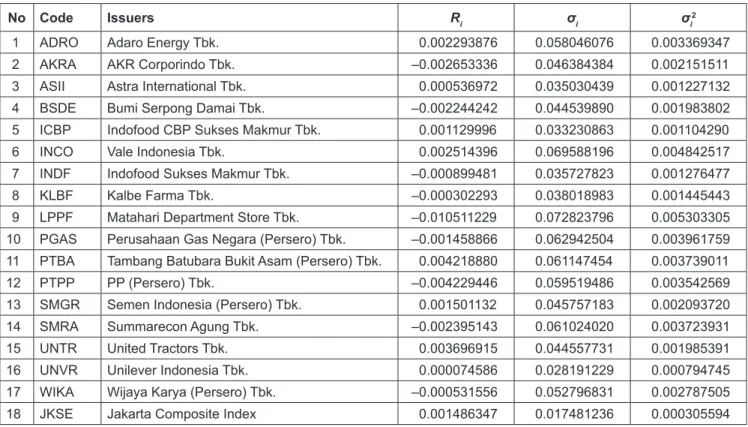
Table 1: 17 Issuers Listed on JII Along with Composite Index and their Relevant Descriptive Statistics
No Code Issuers Ri σi σi 2
1 ADRO Adaro Energy Tbk. 0.002293876 0.058046076 0.003369347
2 AKRA AKR Corporindo Tbk. –0.002653336 0.046384384 0.002151511
3 ASII Astra International Tbk. 0.000536972 0.035030439 0.001227132
4 BSDE Bumi Serpong Damai Tbk. –0.002244242 0.044539890 0.001983802
5 ICBP Indofood CBP Sukses Makmur Tbk. 0.001129996 0.033230863 0.001104290
6 INCO Vale Indonesia Tbk. 0.002514396 0.069588196 0.004842517
7 INDF Indofood Sukses Makmur Tbk. –0.000899481 0.035727823 0.001276477
8 KLBF Kalbe Farma Tbk. –0.000302293 0.038018983 0.001445443
9 LPPF Matahari Department Store Tbk. –0.010511229 0.072823796 0.005303305
10 PGAS Perusahaan Gas Negara (Persero) Tbk. –0.001458866 0.062942504 0.003961759 11 PTBA Tambang Batubara Bukit Asam (Persero) Tbk. 0.004218880 0.061147454 0.003739011
12 PTPP PP (Persero) Tbk. –0.004229446 0.059519486 0.003542569
13 SMGR Semen Indonesia (Persero) Tbk. 0.001501132 0.045757183 0.002093720
14 SMRA Summarecon Agung Tbk. –0.002395143 0.061024020 0.003723931
15 UNTR United Tractors Tbk. 0.003696915 0.044557731 0.001985391
16 UNVR Unilever Indonesia Tbk. 0.000074586 0.028191229 0.000794745
17 WIKA Wijaya Karya (Persero) Tbk. –0.000531556 0.052796831 0.002787505
18 JKSE Jakarta Composite Index 0.001486347 0.017481236 0.000305594
evaluates the shariah implementation of all listed issuers also every six months. From June 1, 2016, until May 31, 2019 (six rounds of evaluation done by IDX), only 18 issuers are consistently listed in JII. Unfortunately, from the 18 issuers, only the historical price of TLKM cannot be accessed via either Yahoo Finance or Investing.com.
Therefore, Table 1 shows only 17 issuers and a composite index, namely Jakarta Composite Index (JKSE).
Furthermore, based on the weekly prices obtained, the average rate of return was calculated for each stock (Eq. 1).
Besides, standard deviation and variance as risk measures were counted as well (Eq. 2).
4.2. Portfolio Selection
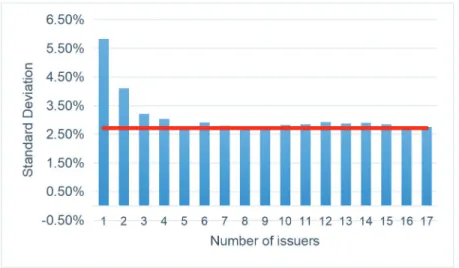
One of the central issues on portfolio selection is how to consider the ideal number of the portfolio (a set of stocks) among all stocks listed on any index. Elton et al. (2014) found that the choice of the number of issuers included in a portfolio may be influenced by the volatility (standard deviation). For this sample, the ideal number of issuers for a portfolio is 5 out of 17 since Figure 1 shows that the increase in the number of issuers does not significantly change the value of standard deviation. Note that the horizontal red line
Figure 1: Observation on the Number of Issuers and their Volatility represents the lowest standard deviation. The calculation of
the standard deviation of the portfolio (Eq. 7) is obtained by supposing the equal weight in any arbitrary number of issuers and its corresponding variance-covariance matrix (Eq. 3).
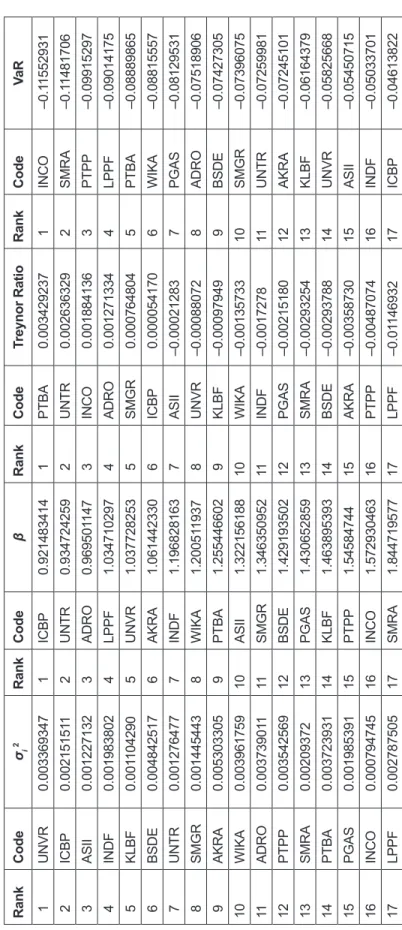
Hence, the portfolio grouping will then be built on the ideal number of 5 issuers. The portfolio selection depends on four indicators: (1) the lowest variance; (2) the lowest beta; (3) the highest Treynor ratio; and (4) the lowest Value at Risk (VaR). Table 2 displays the result of sorted data of four indicators (Eq. 2, 4, 5, and 6 for computation). Note that according to the interest rate issued by the official website of Bank Indonesia from 2016 to 2019, the average interest rate is 5.16% per year. Since this research is weekly-based data, 52 should divide the annual interest rate so that the risk-free rate Rf of 0.09914% is obtained. As can be seen in Table 1, the return and risk of composite index are Rm = 0.1486%
and σm = 1.7481%, respectively. Based on Table 2, we can summarize the four groups of the portfolio as follows:
• Group 1 (five best
variances) : UNVR, ICBP, ASII, INDF, KLBF
• Group 2
(five best betas) : ICBP, UNTR, ADRO, LPPF, UNVR
• Group 3 (five best
Treynor ratio) : PTBA, UNTR, INCO, ADRO, SMGR
• Group 4
(five best VaR) : INCO, SMRA, PTPP, LPPF, PTBA
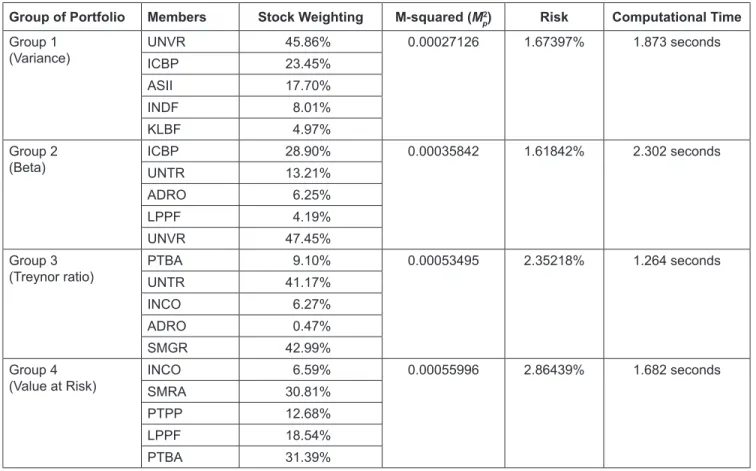
The phase of portfolio selection ends with the ultimate selection. It is done by obtaining the best risk-adjusted return among the four portfolios above using the M-squared method (see Table 3 for the results). Using Equation 8, the portfolio
of group 4 has the highest ratio value of 0.00055996, while group 1 obtained the lowest ratio of 0.00027126. Therefore, the portfolio of group 1 representing the lowest VaR was selected as the best risk-adjusted stock portfolio.
4.3. Portfolio Optimization
The last stage of this research is constructing the optimization model for the risk-adjusted Islamic stock portfolio, i.e., portfolio of group 4, using QP. The common mathematical model of Equation 10 can be adjusted to the problem of portfolio optimization by outlining the objective and constraints functions. Suppose stocks S1, S2, ..., Sn (n ≥ 2) have random returns. Let μi, σi, and xi consecutively represent the geometric mean return of the stock Si, the standard deviation of stock Si, and the proportion of the total fund invested in the portfolio (set of stock i). For i ≠ j, ρij denotes the correlation coefficient of stocks Si and Sj. Let μ = [μ1, ..., μn]T, and H = (σij) be the n × n symmetric covariance matrix. One can represent the expected return and variance of the resulting portfolio x = (x1, ..., xn) as follows:
E x x x x x
x x x x Hx
n n T
ij i i j
j i j T
[ ] ... ,
[ ]
,
= + + + =
=
∑
=1 1µ 2 2µ µ µ
ρ σ σ and
Var ,, whereρii≡1. (12)
Since variance is always nonnegative, it follows that xTHx ≥ 0 for any x, i.e., H is positive semidefinite.
Nevertheless, it will be assumed in fact as a positive definite, which is essentially equivalent to assuming there are no redundant assets in our collection S1, S2, ..., Sn.
Table 2: Sorted Data of all Risk Indicators RankCodeσi 2RankCodeβ RankCodeTreynor RatioRankCodeVaR 1UNVR0.0033693471ICBP0.9214834141PTBA0.0034292371INCO–0.11552931 2ICBP0.0021515112UNTR0.9347242592UNTR0.0026363292SMRA–0.11481706 3ASII0.0012271323ADRO0.9695011473INCO0.0018841363PTPP–0.09915297 4INDF0.0019838024LPPF1.0347102974ADRO0.0012713344LPPF–0.09014175 5KLBF0.0011042905UNVR1.0377282535SMGR0.0007648045PTBA–0.08889865 6BSDE0.0048425176AKRA1.0614423306ICBP0.0000541706WIKA–0.08815557 7UNTR0.0012764777INDF1.1968281637ASII–0.000212837PGAS–0.08129531 8SMGR0.0014454438WIKA1.2005119378UNVR–0.000880728ADRO–0.07518906 9AKRA0.0053033059PTBA1.2554466029KLBF–0.000979499BSDE–0.07427305 10WIKA0.00396175910ASII1.32215618810WIKA–0.0013573310SMGR–0.07396075 11ADRO0.00373901111SMGR1.34635095211INDF–0.001727811UNTR–0.07259981 12PTPP0.00354256912BSDE1.42919350212PGAS–0.0021518012AKRA–0.07245101 13SMRA0.0020937213PGAS1.43065285913SMRA–0.0029325413KLBF–0.06164379 14PTBA0.00372393114KLBF1.46389539314BSDE–0.0029378814UNVR–0.05825668 15PGAS0.00198539115PTPP1.5458474415AKRA–0.0035873015ASII–0.05450715 16INCO0.00079474516INCO1.57293046316PTPP–0.0048707416INDF–0.05033701 17LPPF0.00278750517SMRA1.84471957717LPPF–0.0114693217ICBP–0.04613822
Table 3: Risk-Adjusted Return and Risk (SD) of the Computational Result of all Portfolios
Group of Portfolio Members Stock Weighting M-squared (M2 p) Risk Computational Time Group 1
(Variance) UNVR 45.86% 0.00027126 1.67397% 1.873 seconds
ICBP 23.45%
ASII 17.70%
INDF 8.01%
KLBF 4.97%
Group 2
(Beta) ICBP 28.90% 0.00035842 1.61842% 2.302 seconds
UNTR 13.21%
ADRO 6.25%
LPPF 4.19%
UNVR 47.45%
Group 3
(Treynor ratio) PTBA 9.10% 0.00053495 2.35218% 1.264 seconds
UNTR 41.17%
INCO 6.27%
ADRO 0.47%
SMGR 42.99%
Group 4
(Value at Risk) INCO 6.59% 0.00055996 2.86439% 1.682 seconds
SMRA 30.81%
PTPP 12.68%
LPPF 18.54%
PTBA 31.39%
Also assume that the set of the admissible portfolio is a nonempty polyhedral set represented as X := {x : Ax = b, Cx
≥ d}, where A is m × n a matrix, b is m–dimensional vector, C is p × n matrix, and d is p–dimensional vector. In particular, one of the constraints in the set X is xi
i n
=
∑
= 1 1.
Furthermore, since it is assumed that H is positive definite, the variance is a strictly convex function of the portfolio variables and there exists a unique portfolio X that has the minimum variance. Let’s denote this portfolio with xmin and its return αT xmin with R . Note that xmin is an efficient portfolio. The target is to find the minimum risk portfolio of the stocks 1 to n that yields at least a target value of the expected return. Mathematically, this formulation together with Equation 12 produces a QP problem for portfolio optimization:
min . .
, .
x
T T
T
i i
n
x Hx c x s t x R
x x
1 2
1 0
1
+
≥
= ≥
∑
=µ (13)
According to Equation 12, the objective function is referred to as a variance-covariance matrix. The first constraint is expressed by geometric mean return with expected return no less than the target value R while the second constraint indicates that the sum of all solutions must be 1. Moreover, portfolio optimization in this segment will be focused on the portfolio of group 4 (INCO, SMRA, PTPP, LPPF, and PTBA) because it is the best risk-adjusted Islamic stock portfolio. Also, the geometric mean return ∝ can be obtained (Eq. 1) and suppose its upper bound is R = 0.04.
Furthermore, variance-covariance matrix of H5×5 can be calculated by applying Equation 2 for the diagonal elements and Equation 3 for the non-diagonal elements.
µ=
− − −
[0 002514396. 0 00239514. 0 00422945. 0 010511229 0 004219. . ] annd
H5 5
0 004842517 0 000745693 0 001624139 0 001144618 0 0021
× =
. . . . . 447
0 000745693 0 003723931 0 001459463 0 000928625 0 000278 0 0
. . . . .
. 001624139 0 001459463 0 003542569 0 001279046 0 001268 0 001144
. . . .
. 6618 0 000928625 0 001279046 0 005303305 0 000428 0 00214697 0 0
. . . .
. . 000278425 0 001268341. 0 00042775 0 003739. .
Figure 2: The Output of the m-file Program (MATLAB) Assume that INCO, SMRA, PTPP, LPPF, and PTBA are
symbolized by variables xA, xB, xC, xD, and xE. Replacing H5×5, μ, and R into Equation 13, portfolio optimization for the best risk-adjusted portfolio can be constructed as follows.
minx 0 0048425 0 0037239 0 0035425 0 0053033 0
2 2 2
2
. . .
. .
x x x
x
A B C
D
+ +
+ + 0003739 2 0 0007456
2 0 0016241 2 0 001114
x2 x x
x xA C E A B
+ ×
+ × + ×
( . )
( . ) ( . 44
2 0 002147 2 0 0014594 2 0 0009286
x x
x x x x
x x
A D
A E B C
B
)
( . ) ( . )
( .
+ × + ×
+ × DD B E
C D C E
x x
x x x x
) ( . )
( . ) ( . )
(
+ ×
+ × + ×
+
2 0 0002784 2 0 001279 2 0 0012683 2
2 0 0004277
0 0025143 0 0023951 0 0042294 0
×
− −
−
. )
. . .
x x
xA D E xB xC
s.t.
.. . .
, , , ,
0105112 0 004219 0 05 1
x x
x x x x x
x x x x x
D E
A B C D E
A B C D E
+ ≥
+ + + + =
≥ 00
minx 0 0048425 0 0037239 0 0035425 0 0053033 0
2 2 2
2
. . .
. .
x x x
x
A B C
D
+ +
+ + 0003739 2 0 0007456
2 0 0016241 2 0 001114
x2 x x
x x
E A B
A C
+ ×
+ × + ×
( . )
( . ) ( . 44
2 0 002147 2 0 0014594 2 0 0009286
x x
x x x x
x x
A D
A E B C
B
)
( . ) ( . )
( .
+ × + ×
+ × DD B E
C D C E
x x
x x x x
) ( . )
( . ) ( . )
(
+ ×
+ × + ×
+
2 0 0002784 2 0 001279 2 0 0012683 2
2 0 0004277
0 0025143 0 0023951 0 0042294 0
×
− −
−
. )
. . .
x x
xA D E xB xC
s.t.
.. . .
, , , ,
0105112 0 004219 0 05 1
x x
x x x x x
x x x x x
D E
A B C D E
A B C D E
+ ≥
+ + + + =
≥ 00
(14)
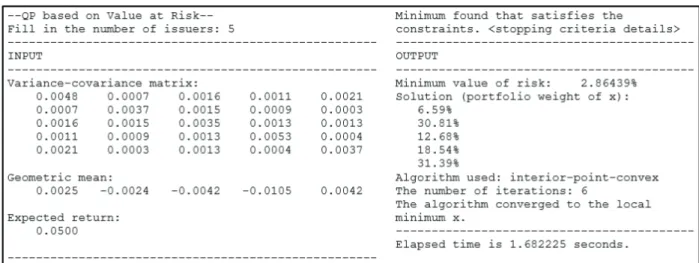
The mathematical model in Equation 14 reflects a financial engineering equation. It can then be solved technically using a numerical computing environment such as MATLAB software. To solve this problem, computer programming deals with MATLAB m-file through the help of optimization toolbox particularly optimizations and quadprog (Brandimarte, 2013; MathWorks Inc, 2020). The output of the proposed m-file program that consumes no more than 2 seconds is shown in Figure 2.
Figure 2 recapitulates the minimum value of risk and asset allocation of investment for each stock in the group 4
portfolio. It can be obviously seen that PTBA holds the biggest fund allocation with 31.39%, while SMRA holds the second highest with 30.81% (0.57% difference). This is followed by LPPF and PTPP with 18.54% and 12.68%
respectively. Lastly, only 6.59% of the total fund is distributed to INCO. Table 3 provides the computational result of portfolio optimization.
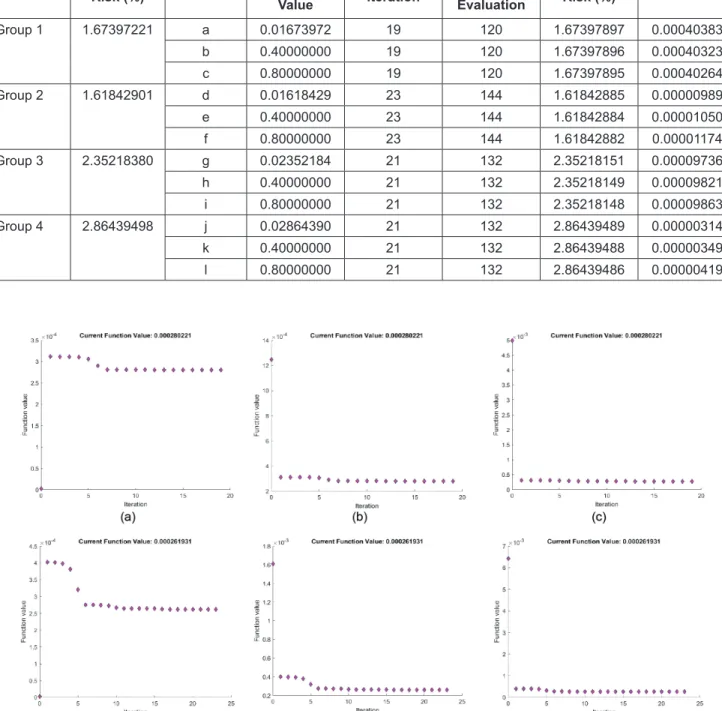
The results of Figure 2 and Table 3, which reflect the exact method, will then be verified using the heuristic method, i.e., Sequential Quadratic Programming (SQP) to approximate the exact solution. By applying “optimoptions”
and a gradient-based optimizer of “fmincon” provided in the MATLAB optimization toolbox, the output of all group 1 portfolios is shown in Table 4.
The experiment includes several aspects: optimal risk, initial conditions, number of iterations, and number of evaluations of objective functions. In detail, optimal risk corresponds to the standard deviation of optimal value (variance) whereas the number of evaluations of objective functions refers to computational complexity (Khan et al., 2020). To prove the consistency, statistical results were generated by repeating each portfolio group 3 times with various initial conditions. One of the initial conditions is obtained from the result of the risk value of QP while the rest are assumed to have initial conditions, respectively, x0 = 0.4 and x0 = 0.8. Figure 3 shows the graphs representing twelve experiments generated by fmincon through the syntax of
“optimplotfval”.
Accordingly, in the calculation of the percent error, there is no significant difference in the results between the risk value of the exact and heuristic method (Table 4). Therefore, it can be inferred that the heuristic method of fmincon has good measurement accuracy.
Table 4: The Output of the Fmincon Heuristic Method (MATLAB) Group of
Portfolio
QP (Exact)
Experim.
Fmincon ( Heuristic)
Percent Error
Risk (%) Initial
Value Iteration Funct.
Evaluation Risk (%)
Group 1 1.67397221 a 0.01673972 19 120 1.67397897 0.00040383
b 0.40000000 19 120 1.67397896 0.00040323
c 0.80000000 19 120 1.67397895 0.00040264
Group 2 1.61842901 d 0.01618429 23 144 1.61842885 0.00000989
e 0.40000000 23 144 1.61842884 0.00001050
f 0.80000000 23 144 1.61842882 0.00001174
Group 3 2.35218380 g 0.02352184 21 132 2.35218151 0.00009736
h 0.40000000 21 132 2.35218149 0.00009821
i 0.80000000 21 132 2.35218148 0.00009863
Group 4 2.86439498 j 0.02864390 21 132 2.86439489 0.00000314
k 0.40000000 21 132 2.86439488 0.00000349
l 0.80000000 21 132 2.86439486 0.00000419
Figure 3: The Optimal Plot of Function Evaluation of all Portfolios Under Varying Initial Conditions. (a)–(c) Took 19 Iterations to Converge to an Optimal Point. (d)–(f) Took 23 Iterations to Reach an Optimal Point. (g)–(l) Took 21 Iterations to Acquire an Optimal Point
Figure 3: (Continued)
5. Conclusion
Portfolio risk reflects the overall risk for a portfolio of investments. It is the combined risk of each individual investment within a portfolio. The risk of the portfolio is one of the main concerns discussed in long-term investing.
As a risk instrument, the level of volatility may be used as an alternative reference for determining the “ideal” number of stocks in a portfolio. The observation from this research showed that from the 17 stocks studied, the optimum number of stocks in a portfolio is 5, any additional stock has no obvious effect on portfolio risk performance. Furthermore, the portfolio of group 4 performs better in terms of relevant risk indicators such as variance, beta, and Treynor ratio (M-squared test). This implies that the portfolio created using the lowest Value at Risk (VaR) beats the market proxy benchmark on a risk-adjusted basis. Value at risk (VaR) is a measure of the risk of loss for investments. It estimates how much a set of investments might lose (with a given probability), given normal market conditions, in a set time- period such as a day. Therefore, it can be concluded that the portfolio of group 4 forms the best risk-adjusted return of the Islamic stock portfolio for this study.
The portfolio problem can be modified based on the QP by supposing variance as the objective function and
expected return as one of the constraint functions. The portfolio optimization of group 4 using QP to obtain the best risk-adjusted return portfolio yields a minimum risk of 2.86% with 1.68 seconds computing time. The portfolio comprises 31.39% of PTBA, 30.81% of SMRA, 18.54% of LPPF, 12.68% of PTPP, and 6.59% of INCO. Moreover, the stock’s weighting percentage on the portfolio may be used by investors to allocate their investment funds. Nevertheless, referring to Table 3, the best risk-adjusted return portfolio optimized using QP still fails to produce the best risk, where the lowest risk is produced by the portfolio of group 2 with 1.62% compared to group 4 risk of 2.86%. A gradient- based optimizer of fmincon successfully verifies the results generated by the exact approach of QP. Additionally, the result of the percent error calculation, which is very close to zero, indicates good measurement accuracy between the exact and heuristic approaches.
References
Alam, M. M., Akbar, C. S., Shahriar, S. M., & Elahi, M. M.
(2017). The Islamic shariah principles for investment in the stock market. Qualitative Research in Financial Markets, 9(2), 132–146. https://doi.org/10.1108/QRFM-09- 2016-0029
Bhati, M. T., & Parashar, P. (2019). M 2: An inclusive measure of portfolio risk-adjusted return. IOSR Journal of Engineering, 9(5), 37–42. http://iosrjen.org/Papers/vol9_issue5/Series- 13/6.%2037-42.pdf
Brandimarte, P. (2013). Numerical methods in finance and economics: A MATLAB-based introduction. New York:
John Wiley & Sons.
Elton, E. J., Gruber, M. J., Brown, S. J., & Goetzmann, W. N.
(2014). Modern portfolio theory and investment analysis (9th ed.). New York: John Wiley & Sons. https://doi.org/10.1017/
CBO9781107415324.004
Gilli, M., & Schumann, E. (2012). Heuristic optimization in financial modeling. Annals of Operations Research, 193(1), 129–158. https://doi.org/10.1007/s10479-011-0862-y
Ginting, J., Ginting, N. W., Putri, L., & Nidar, S. R. (2021). Optimal portfolio models for an inefficient Market. Journal of Asian Finance, Economics, and Business, 8(2), 57–64. https://doi.
org/10.13106/jafeb.2021.vol8.no2.0057
Hartono, J. (2013). Portfolio theory and investment analysis (8th ed.). Yogyakarta: BPFE.
Ho, C. S. F., Abd Rahman, N. A., Yusuf, N. H. M., & Zamzamin, Z.
(2014). Performance of global Islamic versus conventional share indices: International evidence. Pacific-Basin Finance Journal, 28, 110–121. https://doi.org/10.1016/j.pacfin.2013.09.002 Hsieh, H. H. (2013). A review of performance evaluation measures
for actively-managed portfolios. Journal of Economics and Behavioral Studies, 5(12), 815–824. https://doi.org/10.22610/
jebs.v5i12.455
Hussain, M., Shahmoradi, A., & Turk, R. (2015). An overview of Islamic finance (Working Paper WP/015/20). International Monetary Fund. https://www.imf.org/external/pubs/ft/
wp/2015/wp15120.pdf
Jorion, P. (2007). Value at risk: The new benchmark for managing financial risk (3rd ed.). New York: McGraw-Hill.
Karim, B. A., Datip, E., & Shukri, M. H. M. (2014). Islamic stock market versus the conventional stock market. International Journal of Economics, Commerce and Management, II(11), 1–9.
Khan, A. H., Cao, X., Katsikis, V. N., Stanimirovic, P., Brajevic, I., Li, S., & Nam, Y. (2020). Optimal portfolio management for engineering problems using nonconvex cardinality constraint:
A computing perspective. IEEE Access, 8, 57437–57450.
https://doi.org/10.1109/ACCESS.2020.2982195
Kare, K. R., & Fu, M. (2014). Do shariah compliant stocks perform better than conventional stocks? A comparative study of stocks listed on the Australian stock exchange. Asian Journal of Finance & Accounting, 6(2), 155. https://doi.org/10.5296/ajfa.
v6i2.6072
MathWorks Inc. (2020). Global optimization toolbox user’s guide R2020a. Natick, MA: Global Publishers.
Moh’d Mahmoud, A., Waleed, H., & Wafaa, M. (2012). The impact of the global financial crisis 2008 on the Amman stock
exchange. Journal of Distribution Science, 10(7), 13–22.
https://doi.org/10.15722/jds.10.7.201207.13
Mokhtar, S. B., & Hanif, D. S. C. M. S. (2006). Nonlinear programming: Theory and algorithms (3rd ed.). New York:
John Wiley & Sons, Inc.
Morales, J. E L. (2012). A sequential quadratic programming algorithm with an additional equality constrained phase. IMA Journal of Numerical Analysis, 17(1), 553–579. https://doi.
org/10.1093/imanum/drq037
Mussafi, N. S. M. (2012). Optimization of the risk portfolio using the Markowitz MVO model. AdMathEdu: Jurnal Ilmiah Pendidikan Matematika, Ilmu Matematika Dan Matematika Terapan, 1(1), 1–8. https://doi.org/10.12928/admathedu.
v1i1.4879
Nguyen, N., Nguyen, T., Tran, T., & Mai, A. (2020). Shrinkage model selection for portfolio optimization on Vietnam stock market. Journal of Asian Finance, Economics, and Business, 7(9), 135–145. https://doi.org/10.13106/JAFEB.2020.VOL7.
NO9.135
Otoritas Jasa Keuangan (OJK). (2019). Shariah mutual fund statistics. https://www.Ojk.Go.Id/Id/Kanal/Syariah/Data- Dan-Statistik/Reksa-Danayariah/Pages/Statistik-Reksadana- Syariah-- -Desember-2018.Aspx
Pratiwi, D. A., & Yunita, I. (2015). Optimal portfolio construction:
A case study of LQ45 Index in Indonesia Stock Exchange).
International Journal of Science and Research (IJSR), 4(6), 2525–2530. https://www.ijsr.net/get_abstract.php?paper_
id=SUB155903
Sarykalin, S., Serraino, G., & Uryasev, S. (2008). Value-at-risk vs.
conditional value-at-risk in risk management and optimization.
State-of-the-Art Decision-Making Tools in the Information- Intensive Age, 5(11), 270–294. https://doi.org/10.1287/
educ.1080.0052
Setiawan, C., & Kanila Wati, N. P. (2019). Factors affecting the performance of sharia equity funds in Indonesia. Iranian Journal of Management Studies, 12(4), 481–508. https://doi.
org/10.22059/ijms.2019.263411.673253
Shadkam, E. (2014). FC approach in portfolio selection of Tehran’s stock market. Journal of Asian Finance, Economics, and Business, 1(2), 31–37. https://doi.org/10.13106/jafeb.2014.
vol1.no2.31
Škrinjarić, T., & Šego, B. (2019). Using grey incidence analysis approach in portfolio selection. International Journal of Financial Studies, 7(1), 46–63. https://doi.org/10.3390/
ijfs7010001
Taylor, J. R. (1997). An introduction to error analysis. Sausalito, CA: University Science Books.
Yousfat, A. (2015). The portfolio selection by using quadratic programming approach case study of Malaysia stock exchange.
International Journal of Engineering and Technology, 7(4), 1361–1369. http://www.enggjournals.com/ijet//docs/IJET15- 07-04-328.pdf