Print ISSN: 2288-4637 / Online ISSN 2288-4645 doi:10.13106/jafeb.2020.vol7.no8.143
*Acknowledgements:
This research was funded by Vietnam Ministry of Education and Training under project number B2019-DNA-08.
1
First Author. The University of Danang - University of Economics, Danang, Vietnam. Email: [email protected]
2
Corresponding Author. The University of Danang - University of Economics, Danang, Vietnam [Postal Address: 71 Ngu Hanh Son Street, Danang, 550000, Vietnam] Email: [email protected]
3
The University of Danang, Danang, Vietnam. Email: [email protected]
© Copyright: The Author(s)
This is an Open Access article distributed under the terms of the Creative Commons Attribution Non-Commercial License (http://Creativecommons.org/licenses/by-nc/4.0/) which permits unrestricted noncommercial use, distribution, and reproduction in any medium, provided the original work is properly cited.
The Impacts of Oil Price and Exchange Rate on Vietnamese Stock Market*
Tra Ngoc NGUYEN
1, Dat Thanh NGUYEN
2, Vu Ngoc NGUYEN
3Received: May 24, 2020 Revised: June 07, 2020 Accepted: July 03, 2020
Abstract
This study aims to investigate the effect of oil price and exchange rate on the two Vietnamese stock market indices: VN index and HXN index. This study uses the daily data from August 1
st2000 to October 25
th2019 of the two Vietnamese stock indices: VN index and HNX index, the two oil price indices: BRENT and WTI, and the two exchange rates: US dollar to Vietnamese dong and Euro to Vietnamese dong.
Due to the presence of heteroskedasticity in our data, we use GARCH (1,1) regression model to perform our analysis. Our findings show that the oil price has a significant positive effect on the two Vietnamese stock market indices. In terms of the stock index volatility, both the VN index and HNX index volatilities are negatively impacted by the return of oil price. While the conclusion about the impact of oil price remained consistent through all three robustness tests, the effect of exchange rate on Vietnamese stock market indices is not consistent. We find thatchanges of the USD/VND exchange rate significantly impact the return and volatility of HNX index only in GARCH (1,1) setting.
Our analysis also survives a number of robustness tests.
Keywords: Stock Market Index, Oil Price, Exchange Rate, GARCH, Volatility JEL Classification Code: C32, F31, G15
1. Introduction
The stock market index is always a great concern of both policymakers and investors all over the world. Practically, the links between some key index such as oil price and exchange rate have been deemed significant due to their important role in the development of economy. Therefore, understanding the relationships between these variables and the stock market index assists investors in making investment decisions and helps policymakers in designing policies in order to maintain the market stabilization.The aim
of this paper is to examine the effects of the crude oil price and exchange rate on Vietnamese stock indices, namely, VN index and HNX index. Our analysis employs a daily data including 7,025 observations, ranging from August 1
st2000 until October 25
th2019.
Our study relies on two strands of literature, the first is the relationship between exchange rate and stock market and the second is the relationship between oil price and stock market. The relationship between exchange rate and stock market has been a topical subject of previous literature.
However, the diverse results from previous studies show no consensus on the relationship between exchange rate and stock market. Early research by Aggarwal (1981), and Giovannini and Jorion (1987) show a negative relationship between exchange rate and stock return in the U.S. Ajayi and Mougoue (1996) shows that currency depreciation has a negative short-run and long-run effect on stock market.
Similarly, Kim (2003) found a negative relationship between
the return of S&P500 and the dollar exchange rate. Chiange et
al. (2000) discovered that exchange rate is negatively related
to several Asian stock markets by using bivariate GARCH
model. The same pattern was also found in India by Agrawal
(2010) and in Nigeria by Olugbenga (2012). Also, Lee and
Zhao (2014) found negative long-run and short-run causality
from exchange rate to the prices of Chinese stock market.
In contrast, there are also studies that show a positive relationship between the exchange rate and stock return.
Ibrahim and Aziz (2003) discovered a positive relationship between Malaysian stock prices and exchange rates in Malaysia over the period 1977-1998. Kurihara (2006) found a positive relationship between exchange rate and stock return when examined their relationship during the Quantitative Easing Policy 2001-2006 in Japan. Narayan and Narayan (2010) investigate the impact of oil price and exchange rate on Vietnam stock price. They found that exchange rate has a significant positive effect on stock prices in the long run.
Lee and Brahmasrene (2019) also found that exchange rate (Korean Won/USD) is positively related to Korean stock prices.
In addition, other studies suggest that there is no significant relationship between exchange rate and stock return. Nieh and Lee (2001) did not find long run relationship between exchange rate and stock in the G7 countries.
Smiech and Papiez (2013) studied the causality between fossil fuel prices, exchange rate and stock market and found no significant causal relationship between exchange rate and stock return. However, Wallid et al. (2011), using Markov switching EGARCH model, suggested that the relationship between the two variables are regime dependent, and so it can change between different periods.
Another strand of the literature deal with the volatility transmission between exchange rate and stock market. Most studies confirm the volatility interaction between the two markets. Yang and Doong (2004) analyzed the volatility transmission between stock market and exchange rate for G7. They employed the EGARCH model and find significant volatility spillover from stock market to the exchange rate while the opposite transmission was faint. Aloui (2007) came to the same conclusion for the US and EU market.
By employing the MGARCH model, Zhao (2010) finds bidirectional volatility spillovers between exchange rate and stock market in China. Phan et al. (2015) find that the price volatility of exchange rate can be used to predict the volatility of stock market and vice versa.
Besides exchange rate, the effects of oil price on stock market has been extensively studied such as Basher and Sadorsky (2006), Narayan and Narayan (2010), Aloui et al. (2013), Echchabi and Azouzi (2017), Youssef and Mokni (2019) and Nguyen and Nguyen (2020).
iBasher and Sadorsky (2006) investigated 21 emerging markets and find the relationship between oil and stock to be positive. A study by Aloui et al. (2013) also finds a positive correlation between oil and stock for six Central and Eastern Europe countries. Echchabi and Azouzi (2017) found that oil price fluctuations significantly impact the prices of Omani stock market while movements in stock market don’t affect oil prices. More recently, Youssef and Mokni (2019) studied the impact of oil shocks on the stock market of both oil-importing
and exporting countries using the DCC-FIGARCH. They find the responses of stock markets to oil price shocks are time-varying and positive for both oil-importing and exporting countries. Nevertheless, the impact of oil shocks is higher in oil-exporting countries. In the case of Vietnam, Narayan and Narayan (2010) find that oil, exchange rate and stock market are cointegrated. Nguyen and Nguyen (2020) showed that crude oil price can be very useful in forecasting the Vietnamese stock market return.
Our study contributes to the literature in some important directions. First, we extend the literature examining the impacts of oil price and exchange rate on emerging stock market, i.e., Vietnam. Although a number of studies has been done on these relationships, there are only a few papers that address the impacts of both oil price and exchange rate, for example, Narayan and Narayan (2010), Smiech (2013) and Jain and Biswal (2016). Second, Vietnam is an interesting example. This country is different from the other emerging economies as it adopts a fixed exchange regime, and both exports and imports oil at the same time. Therefore, it is important to investigate the effect of oil price and exchange rate on Vietnamese stock market index.
Due to the presence of heteroskedasticity in our data, we employ the GARCH (1, 1) model to analyze the effect of oil price return and exchange rate return on Vietnam stock index return and volatility. The analysis shows that historical oil price has a significant positive effect on the two Vietnamese stock market indices, VN index and HNX index. In term of the stock index volatility, we find that both the VN index and HNX index volatilities are negatively impacted by the return of oil price. Differently, exchange rate return exhibits negative effects on stock index returns and positive effect on the volatility of VN index and HNX index returns. We also employ some robustness tests, namely: (1) different oil price and exchange rate; (2) different model specification, i.e. EGARCH (1, 1); and (3) different sub-sample.
The remainder of this paper proceeds as follows. The next section describes our data and empirical model. Section III presents the findings from our main results as well as those from robustness tests. Finally, we provide concluding remarks in the last section.
2. Data and Methodology 2.1. Data
Table 1 provides descriptions of all the variables used
in this research. All specific data were downloaded from
Investing.com database. Our sample data is at daily frequency
and starts from August 1
st2000 and end on October 25
th2019. Finally, we end up with 7,025 observations, except for
the HNX index return, which has only 5,213 observations as
the index was introduced on July 18
th2005.
Table 1: Variables description
Variable Description
R
VNIVN index return
R
BRENTBrent oil futures price return
R
USUS Dollar to Vietnamese Dong exchange rate return
R
HNXHNX index return
R
WTIWTI oil futures price return
R
EUREuro to Vietnamese Dong exchange rate return
2.2. Methodology
Following the previous literature, we separatemain regressionsin two following GARCH (1, 1) models:
( )
0 1 1 1
2
2 2 2
0 1 1
, ,
; 0
Index Index Indicator
t t t t
t t
t t t
R R R
N
β β β ε
ε σ
σ ω γε λσ
− −
− −
= + + +
→
= + + (1)
( )
0 2
2 2 2
0 1 1 1 1
0,
.
Index
t t
t t
Indicator
t t t t
R
N R β ε
ε σ
σ ω ω
−γε
−λσ
−= +
→
= + + + (2)
where, (1) is the estimation of stock index returns and (2) is the estimation of volatility of the stock index returns.
t is index time. R
Indexis our stock index returns, which are R
VNIand R
HNX. R
Indicatorincludes the return of BRENT oil price (R
BRENT) and the return of USD to VND exchange rate(R
US).
For robustness tests, we use various approaches such as using different oil price and exchange rate, using EGARCH (1, 1) model and using after financial crisis subsample.
3. Empirical Results 3.1. Preliminary Results
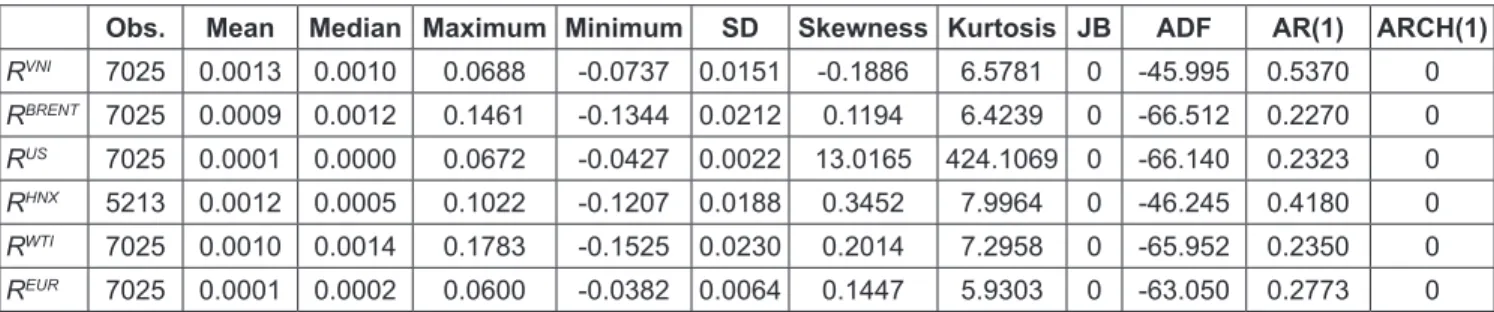
First, the descriptive statistics are reported in Table 2.
The main statistics include the number of observations, mean, median, maximum, minimum, standard deviation (SD), skewness, kurtosis, p-value of Jarque-Bera (JB) test, augmented Dickey-Fuller (ADF) test, autocorrelation AR(1) coefficient, and p-value of LM test for autoregressive conditional heteroskedasticity (ARCH). For stock market index returns, while the movements of VN index and HNX index are similar, there are slight differences in their mean return and volatility. On average, VN index daily return is higher, 0.0013, compares with 0.0012, and less volatile than HNX index return. Similarly, there is also not much difference between BRENT and WTI oil price return. The average return of BRENT is 0.09%, while the average return of WTI is 0.1%, which is only 0.01% higher. The standard deviation of BRENT return is 2.12%, which is marginally smaller than WTI standard deviation of 2.3%. For exchange rate, while the average return of USD/VND and EUR/VND have the same value of 0.01%, interestingly the EUR/VND return is almost three times more volatile than the USD/
VND return. The heterogeneity in various stock indices, oil prices and exchange rates support our approaches of using difference variables in examining the impact of them on Vietnamese stock market indices.
The results of the augmented Dicky-Fuller (ADF) tests show that all series are stationary. We also check the persistency of all variables by measuring their autoregressive AR(1) coefficients. The stock index returns are significantly more persistent than the other series. VN index and HNX index AR(1) coefficients are 0.537 and 0.418, respectively, while none of the remaining series has an AR(1) coefficient higher than 0.30. Moreover, all index returnshave strong ARCH effect, which are shown by the p-value of autoregressive heteroskedasticity (ARCH) test reported in the last column of Table 2.
Table 2 reports some descriptive statistics for VN index, Brent oil futures price, US Dollar to Vietnamese Dong exchange rate, HNX index, WTI oil futures price and Euro to Vietnamese Dong returns. The number of observations, mean, median, maximum, minimum, standard deviation (SD), skewness, kurtosis, p-value of Jarque-Bera (JB)
Table 2: Summary statistics
Obs. Mean Median Maximum Minimum SD Skewness Kurtosis JB ADF AR(1) ARCH(1)
R
VNI7025 0.0013 0.0010 0.0688 -0.0737 0.0151 -0.1886 6.5781 0 -45.995 0.5370 0
R
BRENT7025 0.0009 0.0012 0.1461 -0.1344 0.0212 0.1194 6.4239 0 -66.512 0.2270 0
R
US7025 0.0001 0.0000 0.0672 -0.0427 0.0022 13.0165 424.1069 0 -66.140 0.2323 0
R
HNX5213 0.0012 0.0005 0.1022 -0.1207 0.0188 0.3452 7.9964 0 -46.245 0.4180 0
R
WTI7025 0.0010 0.0014 0.1783 -0.1525 0.0230 0.2014 7.2958 0 -65.952 0.2350 0
R
EUR7025 0.0001 0.0002 0.0600 -0.0382 0.0064 0.1447 5.9303 0 -63.050 0.2773 0
test, augmented Dickey-Fuller (ADF) test, autocorrelation AR(1) coefficient, and p-value of LM test for autoregressive conditional heteroskedasticity (ARCH) are reported. The ADF unit root test is based on a model with an intercept but no time trend. The LM test for ARCH is based on a mean equation.
Next, we looking at Table 2 which reports the results of the following OLS regression:
0 1 1 1
β β
−β
−ε
= + + +
Index Index Indicator
t t t t
R R R ,
where, R
Indexis our stock index return that is R
VNIin the first three models and R
HNXin the last three models. R
Indicatorincludes the return of BRENT oil price and the return of USD to VND exchange rate.
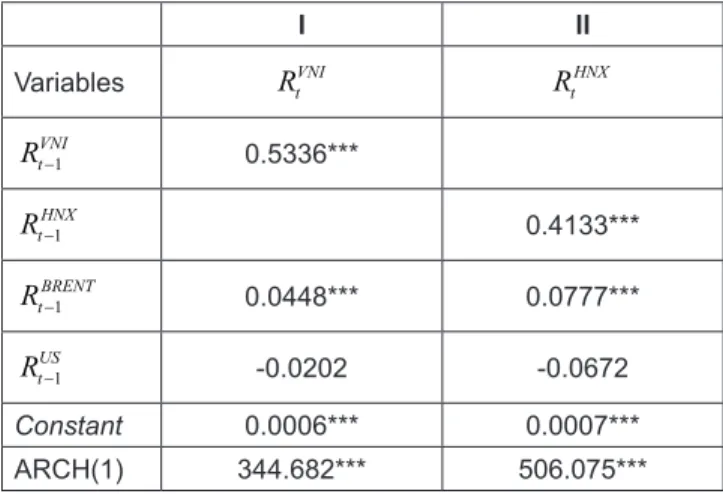
There are two predictive regressions that are estimated based on the stock index returns, VN index and HNX index, and two predictors, BRENT oil price return and USD/VND exchange rate return. The results of the test for ARCH(1) effect are reported in the last row of Table 3. The preliminary results show that the return of BRENT oil price has positive impacts on the stock index return, both VN index and HNX index. In detail, one percentage point increase in oil price return leads to 0.0448 and 0.0777 increase VN index and HNX index respectively. In addition, the impact of oil price return is statistically significant at 1% level in both model specifications (I) and (II). However, the test results show both models exhibit heteroskedasticity, the test values are both significant at 1% level.Therefore, thestandard regressions should not be applied in this case. Instead, ARCH-type models should be used for further analysis.
Table 3 reports the regression results of oil price and/or exchange rate effect on Viet Nam stock index. The regression model takes the following form:
0 1 1 1
β β
−β
−ε
= + + +
Index Index Indicator
t t t t
R R R ,
where, R Index _ is our stock index return, which is R_VNI in the first three models and R_HNX in the last three models. R Indicator _ includes the return of BRENT oil price and the return of USD to VND exchange rate.
The coefficients and standard errors are reported. The LM test statistics for ARCH (1) effect of the residuals for each regression are also reported in the last row.
3.2. Regression Results
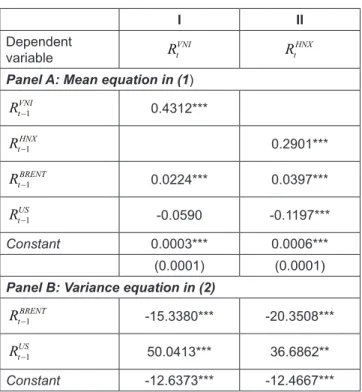
Due to the presence of heteroskedasticity, we employ the GARCH (1, 1) model to analyze the effect of oil price return and exchange rate return on Vietnam stock index return and volatility.The estimation results for the mean and variance equations are reported in Table 4.Similar to the preliminary results, we find thathistorical oil price return
can be a good predictor of stock index return and volatility.
The results in Panel A of Table 4 show a significant positive effectof historical BRENT oil price return onthe two stock indices, VN index and HNX index. The effect of oil price is statistically significant at 1% for both VN index and HNX index. Specifically, one percentage point increase in BRENT oil price return associates with 2.24 percentage points increase in the return of VN index and 3.97 percentage points increase in that of HNX index. These resultsare consistent with previous studies by Basher and Sadorsky (2006), Narayan et al. (2010), Youssef and Mokni (2019), and Nguyen and Nguyen (2019). In term of the relationship between oil price return and stock index volatility, looking at Panel B of Table 4,we find that both the VN index and HNX index volatilities are negatively impacted by the return of oil price. In other words, an increase in oil price return reduces the volatility of the stock market indices. Moreover, the effect of oil price return on return and volatility is stronger with VN-index than with HNX-index. In conclusion, the oil price return is shown to have a positive effect of Vietnamese stock market indices, in term of both return and volatility.
Differently, exchange rate return shows significant negative correlation only with HNX index return at 1%
confident level. One percentage point raise in USD/VND exchange rate return causes a 0.1197 percentage point drop in the HNX index return. As we use indirect quote, this result means an exchange rate depreciation has a negative impact on the stock index return. Regarding to the volatility of VN index and HNX index returns, exchange rate also has positive effect on both of these indices. The exchange rate coefficient is statistically significant at 1% in model (I) and 5% in model (II). This result is similar to what have been found by Nieh and Lee (2001), Gay (2008) or Zhao (2010).
So, in contrast to the effect of oil price, the exchange rate is Table 3: Preliminary results
I II
Variables R
VNItR
tHNX1 VNI−
R
t0.5336***
1
− HNX
R
t0.4133***
1 BRENT−
R
t0.0448*** 0.0777***
1
− US
R
t-0.0202 -0.0672
Constant 0.0006*** 0.0007***
ARCH(1) 344.682*** 506.075***
*, **, and *** denote significance at the 10%, 5% and 1% levels,
respectively.
shown to have negative effects on both stock index returns and their volatilities.
Table 4 reports the GARCH (1,1) regression results of oil price and/or exchange rate effect on Viet Nam stock index.
The regression model takes the following form:
0 1 1 1
β β
−β
−ε
= + + +
Index Index Indicator
t t t t
R R R ,
( 0, 2)
ε
t→ N σ
t,
2 2 2
0 1 1
σ
t= ω + γε
t−+ λσ
t−; (1)
β
0ε
= +
Index
t t
R ,
( 0, 2)
ε
t→ N σ
t,
2 2 2
0 1 1 1 1
σ
t= ω ω + R
tIndicator−+ γε
t−+ λσ
t−; (2)
where, R
tIndexis our stock index return at time t, which is R
tVNIin the first model and R
tHNXin the second model.
1
− Indicator
R
tincludes the return of BRENT oil price and the return of USD to VND exchange rate at time t-1. Panel A reports the coefficients and standard errors of the mean equation in (1) and Panel B reports the coefficients and standard errors of the variance equation in (2).
3.3. Robustness Tests
We apply a number of different setups to see whether our baseline regression results are still applied. Particularly, we use three robustness tests, namely: (1) different oil price and exchange rate; (2) different model specification, i.e.
EGARCH (1, 1); and (3) different sub-sample.
3.3.1. Different Oil Price and Exchange Rate
We examine the robustness of our previous findings by using different oil price and exchange rate. Instead of using the return of BRENT oil and USD/VND exchange rate, we perform the same estimation using WTI oil and EUR to VND exchange rate return as our exogenous regressors. The regression model takes the following form:
0 1 1 1
β β
−β
−ε
= + + +
Index Index Indicator
t t t t
R R R ,
( 0, 2)
ε
t→ N σ
t, σ
t2= ω
0+ γε
t2−1+ λσ
t2−1; (3)
β
0ε
= +
Index
t t
R , ε
t→ N ( 0, σ
t2) ,
2 2 2
0 1 1 1 1
σ
t= ω ω + R
tIndicator−+ γε
t−+ λσ
t−; (4)
where, R
tIndexis our stock index return at time t, which is R
tVNIin the first model and R
tHNXin the second model.
1
− Indicator
R
tincludes the return of WTI oil price and the return of EUR to VND exchange rate at time t-1.
We report some important results in column 2 and 3 of Table 5. First, the impacts of WTI oil price return on the stock index returns are similar to that of the baseline results.
The coefficient of R
WTIis negative and statistically significant at 1% level in both VN index and HNX index regression models. Compare to the previous findings, the EUR to VND exchange rate return has statistically insignificant effects on both VN index and HNX index returns.
In term of the effect on stock index volatility, the results are different. In particular, the WTI oil price return only has a negative effect on VN index return volatility, and this effect is significant at 10% level. It has no significant correlation with the volatility of HNX-index. In addition, the correlations between the EUR/VND return and the volatility of stock index returnsis heterogeneous across VN-index and HNX-index. Whilst an increase in EUR/VND predicts a decrease in volatility for VN index return, it has a positive effect on the volatility of HNX index.
Table 5 reports the robustness regression results of oil price and/or exchange rate effect on Viet Nam stock index.
We report the results using different oil price and exchange rate, EGARCH(1,1) model and different sub-sample, i.e. post financial crisis, respectively. Panel A reports the coefficients and standard errors of the mean equation in (3), Table 4: Estimation results
I II
Dependent
variable R
VNItR
tHNXPanel A: Mean equation in (1)
1 VNI−
R
t0.4312***
1
− HNX
R
t0.2901***
1
− BRENT
R
t0.0224*** 0.0397***
1 US−
R
t-0.0590 -0.1197***
Constant 0.0003*** 0.0006***
(0.0001) (0.0001)
Panel B: Variance equation in (2)
1 BRENT−
R
t-15.3380*** -20.3508***
1
− US
R
t50.0413*** 36.6862**
Constant -12.6373*** -12.4667***
*, **, and *** denote significance at the 10%, 5% and 1% levels,
respectively. Note that all the ARCH and GARCH terms are not
reported but they are significance at 1% level in all regressions.
while Panel B reports the coefficients and standard errors of the variance equation in (4). Note that all the ARCH and GARCH terms are significance at 1% level in all regressions. For EGARCH(1,1) model reported in column 4 and 5, the EARCH, absolute EARCH and EGARCH terms are significance at 1% level in all regressions, except the EARCH term of the variance equation in VN index model I is significance at 5% level.
3.3.2. Different Model
One of the greatest weaknesses of the GARCH (1, 1) model is that it cannot account for the asymmetric effects of positive and negative shocks. Therefore, to overcome this problem, we employ the EGARCH (1, 1) model.
iiiThe regression model takes the following form:
0 1 1 1
β β
−β
−ε
= + + +
Index Index Indicator
t t t t
R R R , ε
t→ N ( 0, σ
t2) ,
( )
2 0 1 1 211 1
ln σ ω γ ε α ε λσ ; σ
−−σ
−− −= +
t+
t+
t t
t t
(5)
β
0ε
= +
Index
t t
R , ε
t→ N ( 0, σ
t2) ,
( )
2 0 1 1 1 1 211 1
ln ln σ ω ω γ ε α ε λσ
σ
−σ
−− −
− −
= +
Indicator+
t+
t+
t t t
t t
R (6)
where, R
tIndexis our stock index return at time t, which is R
tVNIin the first model and R
tHNXin the second model.
1 Indicator−
R
tincludes the return of BRENT oil price and the return of USD to VND exchange rate at time t-1.
The regression results are presented in column 4 and 5 of Table 5. Consistent with the earlier results, BRENT oil price return is shown to have positive effect on stock market. An increase in oil price return helps to increase to stock market index returns and dampen the volatility of both VN index and HNX index. In contrast, the USD to VND exchange rate is shown to have no significant relationship with both stock returns and volatility.
3.3.3. Different Sub-sample
As we observe from the historical data, the period of high volatility for all variables coincides with the financial crisis 2007-2009. Therefore, to avoid the potential bias caused by the financial crisis, we re-estimate our GARCH (1, 1) model again for the post-crisis period to see if our result is robust.
A sub-sample that starts from January 1
st2010 and ends in October 25
th2019 is employed. The results are presented in column 6 and 7 of Table 5. Consistent with our main regression results, oil price return continues to positively impact on stock return and negative impact on stock index Table 5: Robustness tests
Different oil price and
exchange rate EGARCH (1,1) model Post financial crisis 2007- 2009
Dependent variable R
tVNIR
tHNXR
tVNIR
tHNXR
tVNIR
tHNXPanel A: Mean equation
1
− VNI
R
t0.4336*** 0.4432*** 0.3121***
1
− HNX
R
t0.2926*** 0.2984*** 0.2282***
Oil price return
1 WTI−
R
tor R
tBrent−10.0170*** 0.0337*** 0.0190*** 0.0484*** 0.0500*** 0.0387***
Exchange rate return
1 EUR−
R
tor
US−1R
t0.0091 0.0162 -0.0700 -0.0561 -0.1411** -0.1053**
Constant 0.0003*** 0.0006*** 0.0003*** 0.0004*** 0.0005*** 0.0005***
Panel B: Variance equation
1
− WTI
R
t-8.4576* -7.4872 -1.2297*** -1.3525*** -20.4050*** -14.1672**
1
− tEUR