©2020 JGC All rights reserved; www.jgc301.com
Research Article
Open Access
Gender differences in clinical outcomes of acute myocardial infarction undergoing percutaneous coronary intervention: insights from the KAMIR-NIH Registry
Myunhee Lee
1, Dae-Won Kim
1,#, Mahn-Won Park
1, Kyusup Lee
1, Kiyuk Chang
2, Wook Sung Chung
2, Tae Hoon Ahn
3, Myung Ho Jeong
4, Seung-Woon Rha
5, Hyo-Soo Kim
6, Hyeon Cheol Gwon
6,
In Whan Seong
7, Kyung Kuk Hwang
8, Shung Chull Chae
9, Kwon-Bae Kim
10, Young Jo Kim
11,
Kwang Soo Cha
12, Seok Kyu Oh
13, Jei Keon Chae
14, Ji-Hoon Jung
15; on behalf of KAMIR-NIH registry investigators
1Division of Cardiology, Daejeon St. Mary’s hospital, College of Medicine, The Catholic University of Korea, Seoul, South Korea
2Division of Cardiology, Seoul St. Mary’s hospital, College of Medicine, The Catholic University of Korea, Seoul, South Korea
3Gachon University, Gil Medical Center, Incheon, South Korea
4Chonnam National University Hospital, Gwangju, South Korea d Korea University
5Korea University Guro Hospital, Seoul, South Korea
6Seoul National University Hospital, Seoul, South Korea
7Sungkyunkwan Universtiy, Samsung Medical Center, Seoul, South Korea
8Chungnam National University Hospital, Daejeon, South Korea
9Chungbuk National University Hospital, Cheongju, South Korea
10Kyungpook National University Hospital, Daegu, South Korea
11Keimyung University Dongsan Medical Center, Daegu, South Korea
12Yeungnam University Hospital, Daegu, South Korea
13Pusan National University Hospital, Busan, South Korea
14Wonkwang University Hospital, Iksan, South Korea
15Chonbuk National University Hospital, Jeonju, South Korea
16Institute of Toxicology, Daejeon, South Korea
Abstract
Background There are numerous but conflicting data regarding gender differences in outcomes following percutaneous coronary in- tervention (PCI). Furthermore, gender differences in clinical outcomes with acute myocardial infarction (AMI) following PCI in Asian population remain uncertain because of the under-representation of Asian in previous trials. Methods A total of 13,104 AMI patients from Korea Acute Myocardial Infarction Registry-National Institute of Health (KAMIR-NIH) between November 2011 and December 2015 were classified into male (n = 8021, 75.9%) and female (n = 2547, 24.1%). We compared the demographic, clinical and angiographic characteris- tics, 30-days and 1-year major adverse cardiac and cerebrovascular events (MACCE) in women with those in men after AMI by using pro- pensity score (PS) matching. Results Compared with men, women were older, had more comorbidities and more often presented with non-ST segment elevation myocardial infarction (NSTEMI) and reduced left ventricular systolic function. Over the median follow-up of 363 days, gender differences in both 30-days and 1-year MACCE as well as thrombolysis in myocardial infarction minor bleeding risk were not observed in the PS matched population (30-days MACCE: 5.3% vs. 4.7%, log-rank P = 0.494, HR = 1.126, 95% CI: 0.8001.585; 1-year MACCE: 9.3% vs. 9.0%, log-rank P = 0.803, HR = 1.032, 95% CI: 0.8021.328; TIMI minor bleeding: 4.9% vs. 3.9%, log-rank P = 0.215, HR = 1.255, 95% CI: 0.8691.814). Conclusions Among Korean AMI population undergoing contemporary PCI, women, as compared with men, had different clinical and angiographic characteristics but showed similar 30-days and 1-year clinical outcomes. The risk of bleed- ing after PCI was comparable between men and women during one-year follow up.
J Geriatr Cardiol 2020; 17: 680693. doi:10.11909/j.issn.1671-5411.2020.11.006
Keywords: Acute myocardial infarction; Asian population; Gender difference; Percutaneous coronary intervention
#Correspondence to: [email protected]. Received: August 25, 2020; Revised: November 8, 2020; Accepted: November 27, 2020;
Published online: November 28, 2020
1 Introduction
Over the past decade, despite remarkable advances in medical and interventional therapeutics, ischemic heart dis- ease (IHD) remains the leading cause of death worldwide and its prevalence is still increasing and becoming a major cause of morbidity and mortality.
[1]Although the overall IHD mortality has declined over the past decade, the rate of decline for women compared with men has been slower in United States as well as in Korea, raising considerable in- terest about gender differences in clinical outcomes follow- ing IHD.
[1,2]Percutaneous coronary intervention (PCI) is the cornerstone of improving outcomes in acute myocardial infarction. But there is still ongoing debate over the gender differences in outcomes after PCI. Previous studies have shown that female has worse clinical outcomes following PCI compared with male,
[37]However, after adjustment of confounding variables (such as age, comorbidities and pro- cedure characteristics), sex disparities in outcomes after PCI have showed inconclusive or negative results.
[816]Owing to increased public awareness campaigns targeting women such as the American Heart Association’s Go red campaign, a decrease in gender gap in the treatment, implementation of evidence-based pharmacologic therapies and the develop- ment of new interventional technologies, it is unclear whe- ther the gender differences after PCI in AMI setting are still present in contemporary era. Therefore, we conducted this study to examine the association between sex and clinical outcomes after PCI among AMI patients using real world population in the current era.
2 Methods
2.1 Study design and patient population
The data were obtained from the database of the Korea Acute Myocardial Infarction Registry–National Institutes of Health (KAMIR-NIH). The KAMIR-NIH is a prospective, multi-center, web-based observational cohort study to de- velop the prognostic and surveillance index of Korean pa- tients with AMI from 15 centers in Korea and was sup- ported by a grant of Korea Centers for Disease Control and Prevention from May 2010 to June 2015. The study flow chart is displayed in Figure 1. Initially, 13,104 patients were included in this analysis. Among them, 2,193 patients who did not undergo PCI and 343 patients with missing data were excluded. The remaining 10,568 patients with AMI performing successful PCI were categorized into two groups according to sex (male: 8021 (75.9%), female: 2547 (24.1%)).
All participated centers are high-volume centers for coro- nary angiography (CAG) with PCI and have used the same
Figure 1. Study population. PCI: percutaneous coronary inter- vention; POBA: plain old balloon angioplasty.
study protocol. This study was approved by the institutional review board (IRB) of each participating institution and was conducted according to the Declaration of Helsinki. Written informed consent was obtained from all participants. Trained study coordinators at each participating institution collected the data using a standardized format. Standardized defini- tions of all variables were determined by steering committee board of KAMIR-NIH.
2.2 PCI procedure and medical treatment
CAG and PCI were performed according to the standard guidelines at the time of procedure.
[17]Antiplatelet therapy and administration of periprocedural anticoagulation were administered in accordance with the standard regimens.
Aspirin (loading dose, 200 mg) plus clopidogrel (loading dose, 300 or 600 mg) or ticagrelor (loading dose 180 mg) or prasugrel (loading dose 60 mg) were prescribed for all pa- tients before or during PCI. After the procedure, aspirin (100200 mg/day) was maintained indefinitely. Patients with drug-eluting stent (DES) were prescribed clopidogrel (75 mg/day), ticagrelor (90 mg twice/day), prasugrel (10 mg/day) for at least 12 months. The choice of procedural applications related to PCI such as pre-dilation, direct stent- ing, post-adjunct balloon inflation, use of imaging devices (e.g., intravascular ultrasound, optical coherence tomogra- phy, fractional flow reserve), and administration of glyco- protein IIb/IIIa-receptor blockers and the cardiac medications were left to the discretion of the treating physician.
2.3 Definitions
The diagnosis of AMI was based on the detection of a
raise and/or fall of cardiac biomarkers (creatine kinase-myo-
cardial band (CK-MB) and troponin I or T) with at least one value above the 99
thpercentile upper reference limit and with at least one of the following: symptoms of ischemia, new ischemic ECG changes, development of pathological Q waves, imaging evidence of new loss of viable myocardium or new regional wall motion abnormality in a pattern con- sistent with an ischemic etiology.
[18]Diabetes mellitus (DM) was defined as a fasting glucose concentration of ≥ 7.0 mmol/L, a blood glucose concentration of ≥ 11.0 mmol/L on a 75 g, 2 h oral glucose tolerance test, or the use of antidiabetic therapy. Hypertension (HTN) was defined as a history of a systolic blood pressure of ≥ 140 mmHg, a dia- stolic pressure of ≥ 90 mmHg, or the use of antihypertensive therapy. Dyslipidemia was defined as a fasting total choles- terol concentration of ≥ 220 mg/dL, a fasting triglyceride concentration of ≥ 150 mg/dL, or the use of antihyperlipi- demic therapy. Chronic kidney disease (CKD) was defined as a glomerular filtration on admission of < 60 mL/min per 1.73 m
2. The glomerular filtration rate was calculated ac- cording to the abbreviated Modification of Diet and Renal Disease Study formula.
[19]2.4 Primary and secondary endpoints
The primary endpoint was a one year major adverse car- diac and cerebrovascular events (MACCE), composite of cardiac death (CD), myocardial infarction (MI), target ves- sel revascularization (TVR) and cerebrovascular accident (CVA). All deaths were considered as cardiac unless an un- equivocal non-cardiac cause was established. CD was de- fined as any death due to a proximate cardiac cause such as MI, low-output failure, arrhythmia, unwitnessed death and all procedure-related deaths, including those related to con- comitant treatment.
[20]MI was defined as newly developed Q wave, raised CK-MB, troponin I or T above the normal ranges, typical ischemic symptom accompanied with ST elevation. TVR was defined as percutaneous or surgical revascularization of the stented lesion including 5 mm mar- gin segments and more proximal or distal, newly developed lesion. CVA were defined as a stroke or cerebrovascular accident with loss of neurological function caused by an ischemic or hemorrhagic event with residual symptoms at least 24 h after onset or leading to death. The secondary endpoints were all- cause death, heart failure, stent throm- bosis and thrombolysis in myocardial infarction (TIMI) major and minor bleeding
[21]at one year. Heart failure was defined as sudden worsening of the signs and symptoms of heart failure, which was measured as a left ventricular ejec- tion fraction (LVEF) of less than 40% during follow-up.
Stent thrombosis was evaluated according to the Academic Research Consortium Definitions.
[22]TIMI minor bleeding was defined as overt clinical bleeding associated with a fall
in hemoglobin of 3% to less than or equal to 5 g/dL or in hematocrit of 9% to less than or equal to 15% (absolute).
All adverse events were confirmed through the source documents, including medical records and telephone inter- views, and were also adjudicated by the Steering Committee of Chonnam National University Hospital.
2.5 Statistical analyses
Continuous variables are expressed as mean ± SD and categorical data are presented as absolute values and per- centages. Differences between the groups of categorical vari- ables were analyzed by chi-square or Fisher exact test as appropriate and differences between the groups of continu- ous variables were analyzed by the 2-tailed Student’s t test.
The incidences of the primary endpoints according to sex were estimated at 12 months and were displayed in tables and Kaplan-Meier curves. The log-rank test was performed to compare the incidences of the endpoints between the groups. Based on the significant variables (P < 0.05), pro- pensity score (PS) analysis was performed to reduce bias due to confounding variables. Baseline demographic, clini- cal and angiographic characteristics were compared within the PS matched group. PS was computed by non-parsimo- nious multiple logistic regression analysis (C-statistics = 0.927). Matching was performed with the use of a 1: 1 nearest neighbor matching, from initial 7 to 1 digit. We con- firmed the model reliability with goodness of-fit test (P = 0.273). In the matched cohort, paired comparisons were performed with the use of McNemar’s test for binary vari- ables and a paired t-test for continuous variables. All analy- ses were two-tailed, and clinical significance was defined as P < 0.05. All statistical analyses were performed using a Statistical Analysis Software (SAS, version 9.4, SAS Insti- tute, Cary, NC, USA).
3 Results
From May 2010 to June 2015, a total 10,568 patients with AMI at 15 medical centers in Korea who underwent successful revascularization were enrolled in this analysis.
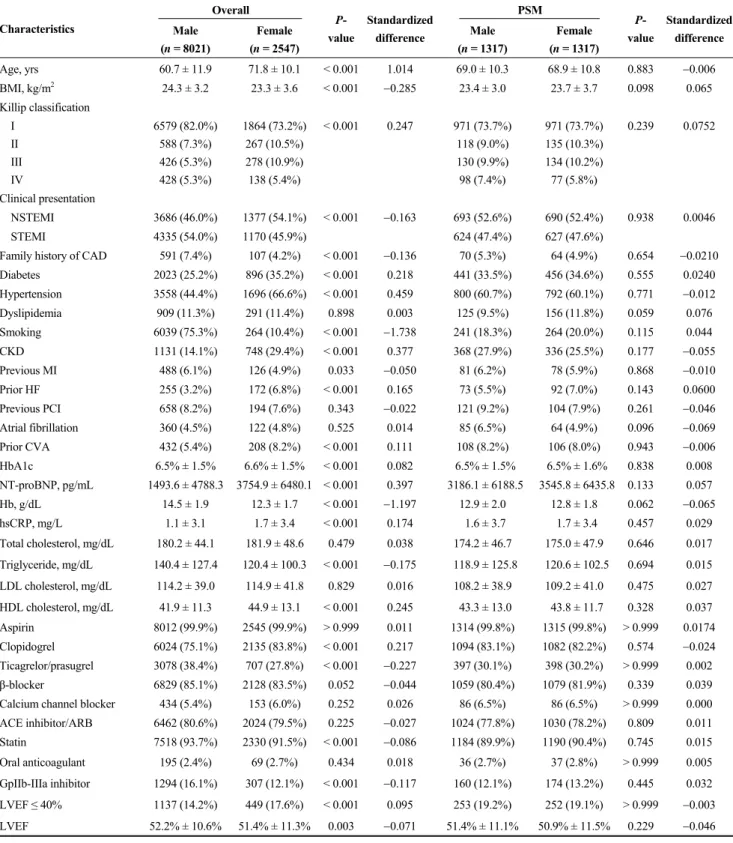
3.1 Baseline characteristics of study population Baseline demographic, clinical and laboratory character- istics were significantly different between sexes (Table 1).
Compared with men, women were significantly older (71.8
± 10.1 vs. 60.7 ± 11.9 years, P < 0.001), more likely to have
DM, HTN and CKD, which were known risk factors of
coronary artery disease (CAD). At the time of AMI presen-
tation, women were more frequently presented with
non-ST-segment elevation myocardial infarction (NSTEMI),
severe left ventricular (LV) systolic dysfunction (LVEF ≤
Table 1. Baseline demographic, clinical and laboratory characteristics in AMI patients in Crude and Propensity Score matched Population.
Overall PSM
Characteristics Male
(n = 8021)
Female (n = 2547)
P- value
Standardized
difference Male (n = 1317)
Female (n = 1317)
P- value
Standardized difference
Age, yrs 60.7 ± 11.9 71.8 ± 10.1 < 0.001 1.014 69.0 ± 10.3 68.9 ± 10.8 0.883 0.006
BMI, kg/m2 24.3 ± 3.2 23.3 ± 3.6 < 0.001 0.285 23.4 ± 3.0 23.7 ± 3.7 0.098 0.065
Killip classification
I 6579 (82.0%) 1864 (73.2%) < 0.001 0.247 971 (73.7%) 971 (73.7%) 0.239 0.0752
II 588 (7.3%) 267 (10.5%) 118 (9.0%) 135 (10.3%)
III 426 (5.3%) 278 (10.9%) 130 (9.9%) 134 (10.2%)
IV 428 (5.3%) 138 (5.4%) 98 (7.4%) 77 (5.8%)
Clinical presentation
NSTEMI 3686 (46.0%) 1377 (54.1%) < 0.001 0.163 693 (52.6%) 690 (52.4%) 0.938 0.0046
STEMI 4335 (54.0%) 1170 (45.9%) 624 (47.4%) 627 (47.6%)
Family history of CAD 591 (7.4%) 107 (4.2%) < 0.001 0.136 70 (5.3%) 64 (4.9%) 0.654 0.0210
Diabetes 2023 (25.2%) 896 (35.2%) < 0.001 0.218 441 (33.5%) 456 (34.6%) 0.555 0.0240
Hypertension 3558 (44.4%) 1696 (66.6%) < 0.001 0.459 800 (60.7%) 792 (60.1%) 0.771 0.012
Dyslipidemia 909 (11.3%) 291 (11.4%) 0.898 0.003 125 (9.5%) 156 (11.8%) 0.059 0.076
Smoking 6039 (75.3%) 264 (10.4%) < 0.001 1.738 241 (18.3%) 264 (20.0%) 0.115 0.044
CKD 1131 (14.1%) 748 (29.4%) < 0.001 0.377 368 (27.9%) 336 (25.5%) 0.177 0.055
Previous MI 488 (6.1%) 126 (4.9%) 0.033 0.050 81 (6.2%) 78 (5.9%) 0.868 0.010
Prior HF 255 (3.2%) 172 (6.8%) < 0.001 0.165 73 (5.5%) 92 (7.0%) 0.143 0.0600
Previous PCI 658 (8.2%) 194 (7.6%) 0.343 0.022 121 (9.2%) 104 (7.9%) 0.261 0.046
Atrial fibrillation 360 (4.5%) 122 (4.8%) 0.525 0.014 85 (6.5%) 64 (4.9%) 0.096 0.069
Prior CVA 432 (5.4%) 208 (8.2%) < 0.001 0.111 108 (8.2%) 106 (8.0%) 0.943 0.006
HbA1c 6.5% ± 1.5% 6.6% ± 1.5% < 0.001 0.082 6.5% ± 1.5% 6.5% ± 1.6% 0.838 0.008
NT-proBNP, pg/mL 1493.6 ± 4788.3 3754.9 ± 6480.1 < 0.001 0.397 3186.1 ± 6188.5 3545.8 ± 6435.8 0.133 0.057
Hb, g/dL 14.5 ± 1.9 12.3 ± 1.7 < 0.001 1.197 12.9 ± 2.0 12.8 ± 1.8 0.062 0.065
hsCRP, mg/L 1.1 ± 3.1 1.7 ± 3.4 < 0.001 0.174 1.6 ± 3.7 1.7 ± 3.4 0.457 0.029
Total cholesterol, mg/dL 180.2 ± 44.1 181.9 ± 48.6 0.479 0.038 174.2 ± 46.7 175.0 ± 47.9 0.646 0.017 Triglyceride, mg/dL 140.4 ± 127.4 120.4 ± 100.3 < 0.001 0.175 118.9 ± 125.8 120.6 ± 102.5 0.694 0.015 LDL cholesterol, mg/dL 114.2 ± 39.0 114.9 ± 41.8 0.829 0.016 108.2 ± 38.9 109.2 ± 41.0 0.475 0.027 HDL cholesterol, mg/dL 41.9 ± 11.3 44.9 ± 13.1 < 0.001 0.245 43.3 ± 13.0 43.8 ± 11.7 0.328 0.037 Aspirin 8012 (99.9%) 2545 (99.9%) > 0.999 0.011 1314 (99.8%) 1315 (99.8%) > 0.999 0.0174 Clopidogrel 6024 (75.1%) 2135 (83.8%) < 0.001 0.217 1094 (83.1%) 1082 (82.2%) 0.574 0.024 Ticagrelor/prasugrel 3078 (38.4%) 707 (27.8%) < 0.001 0.227 397 (30.1%) 398 (30.2%) > 0.999 0.002
β-blocker 6829 (85.1%) 2128 (83.5%) 0.052 0.044 1059 (80.4%) 1079 (81.9%) 0.339 0.039
Calcium channel blocker 434 (5.4%) 153 (6.0%) 0.252 0.026 86 (6.5%) 86 (6.5%) > 0.999 0.000 ACE inhibitor/ARB 6462 (80.6%) 2024 (79.5%) 0.225 0.027 1024 (77.8%) 1030 (78.2%) 0.809 0.011
Statin 7518 (93.7%) 2330 (91.5%) < 0.001 0.086 1184 (89.9%) 1190 (90.4%) 0.745 0.015
Oral anticoagulant 195 (2.4%) 69 (2.7%) 0.434 0.018 36 (2.7%) 37 (2.8%) > 0.999 0.005
GpIIb-IIIa inhibitor 1294 (16.1%) 307 (12.1%) < 0.001 0.117 160 (12.1%) 174 (13.2%) 0.445 0.032 LVEF ≤ 40% 1137 (14.2%) 449 (17.6%) < 0.001 0.095 253 (19.2%) 252 (19.1%) > 0.999 0.003
LVEF 52.2% ± 10.6% 51.4% ± 11.3% 0.003 0.071 51.4% ± 11.1% 50.9% ± 11.5% 0.229 0.046
Data are presented as mean ± SD,median (interquartile range), or n (%) where appropriate. ACE inhibitor: angiotensin-converting enzyme inhibitor; AMI:
acute myocardial infarction; ARB: angiotensin receptor blocker; BMI: body mass index; CAD: coronary artery disease; CKD: chronic kidney disease; CVA:
cerebrovascular accident; GpIIb-IIIa inhibitor: glycoprotein IIb/IIIa inhibitor; Hb: hemoglobin; HbA1c: glycated hemoglobin; HDL: high-density lipoprotein;
HF: heart failure; hsCRP: high sensitivity C-reactive protein; LDL: low-density lipoprotein; LVEF: left ventricular ejection fraction; NSTEMI:
non-ST-segment elevation myocardial infarction; NT-proBNP: N-terminal prohormone of brain natriuretic peptide; PCI: percutaneous coronary intervention;
PSM: propensity score matching; STEMI: ST-segment elevation myocardial infarction.
40%, 17.6% vs. 14.2%), had a higher incidence of a Killip class ≥ II, showed a higher level of proBNP and had lower hemoglobin. More women had a prior history of heart failure and CVA whereas men had a higher percentage of history of previous MI. During the index AMI hospitaliza- tion, women were treated more often with potent P2Y12 inhibitor (such as prasugrel and ticagrelor), while men more frequently received glycoprotein IIb/IIIa inhibitors. At dis- charge, both men and women were prescribed with similar percentage of antiplatelet agents, β-blocker and RAAS (renin angiotensin aldosterone system) inhibitors. There was no difference of baseline low-density lipoprotein cho-
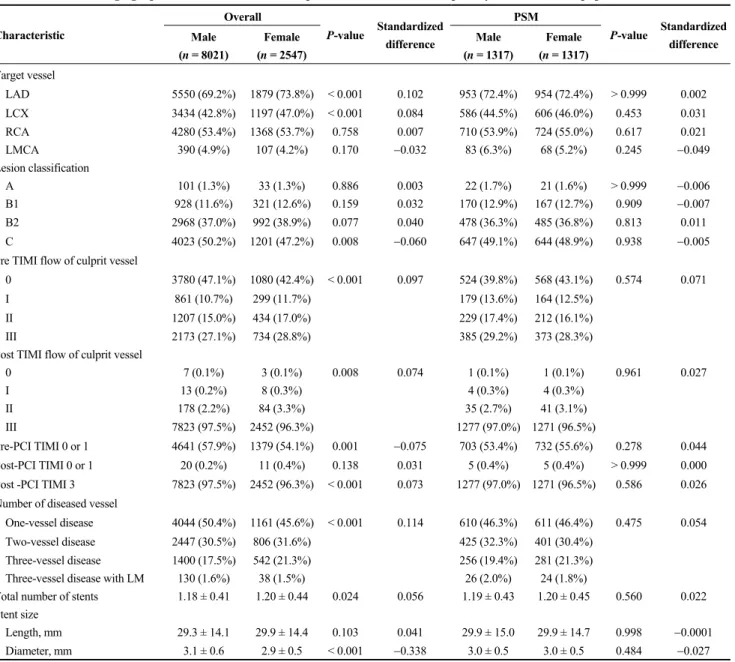
lesterol level between sexes whereas women had a slightly higher baseline high sensitivity C-reactive protein (hsCRP) level than men, but the mean hsCRP level was less than 2 mg/L at baseline in both groups. There were also signifi- cant differences in baseline angiographic characteristics between men and women as displayed in Table 2. The most common infarct-related artery was the left anterior de- scending artery (LAD) and women showed relatively higher proportion of LAD in target vessels and higher rates of multi-vessel diseases. But there were no significant differ- ences in the total number of stents and stent lengths between men and women.
Table 2. Baseline angiographic characteristics in AMI patients in Crude and Propensity Score matched population.
Overall PSM
Characteristic Male
(n = 8021)
Female (n = 2547)
P-value Standardized
difference Male (n = 1317)
Female (n = 1317)
P-value Standardized difference
Target vessel
LAD 5550 (69.2%) 1879 (73.8%) < 0.001 0.102 953 (72.4%) 954 (72.4%) > 0.999 0.002
LCX 3434 (42.8%) 1197 (47.0%) < 0.001 0.084 586 (44.5%) 606 (46.0%) 0.453 0.031
RCA 4280 (53.4%) 1368 (53.7%) 0.758 0.007 710 (53.9%) 724 (55.0%) 0.617 0.021
LMCA 390 (4.9%) 107 (4.2%) 0.170 0.032 83 (6.3%) 68 (5.2%) 0.245 0.049
Lesion classification
A 101 (1.3%) 33 (1.3%) 0.886 0.003 22 (1.7%) 21 (1.6%) > 0.999 0.006
B1 928 (11.6%) 321 (12.6%) 0.159 0.032 170 (12.9%) 167 (12.7%) 0.909 0.007
B2 2968 (37.0%) 992 (38.9%) 0.077 0.040 478 (36.3%) 485 (36.8%) 0.813 0.011
C 4023 (50.2%) 1201 (47.2%) 0.008 0.060 647 (49.1%) 644 (48.9%) 0.938 0.005
Pre TIMI flow of culprit vessel
0 3780 (47.1%) 1080 (42.4%) < 0.001 0.097 524 (39.8%) 568 (43.1%) 0.574 0.071
I 861 (10.7%) 299 (11.7%) 179 (13.6%) 164 (12.5%)
II 1207 (15.0%) 434 (17.0%) 229 (17.4%) 212 (16.1%)
III 2173 (27.1%) 734 (28.8%) 385 (29.2%) 373 (28.3%)
Post TIMI flow of culprit vessel
0 7 (0.1%) 3 (0.1%) 0.008 0.074 1 (0.1%) 1 (0.1%) 0.961 0.027
I 13 (0.2%) 8 (0.3%) 4 (0.3%) 4 (0.3%)
II 178 (2.2%) 84 (3.3%) 35 (2.7%) 41 (3.1%)
III 7823 (97.5%) 2452 (96.3%) 1277 (97.0%) 1271 (96.5%)
Pre-PCI TIMI 0 or 1 4641 (57.9%) 1379 (54.1%) 0.001 0.075 703 (53.4%) 732 (55.6%) 0.278 0.044
Post-PCI TIMI 0 or 1 20 (0.2%) 11 (0.4%) 0.138 0.031 5 (0.4%) 5 (0.4%) > 0.999 0.000
Post -PCI TIMI 3 7823 (97.5%) 2452 (96.3%) < 0.001 0.073 1277 (97.0%) 1271 (96.5%) 0.586 0.026 Number of diseased vessel
One-vessel disease 4044 (50.4%) 1161 (45.6%) < 0.001 0.114 610 (46.3%) 611 (46.4%) 0.475 0.054
Two-vessel disease 2447 (30.5%) 806 (31.6%) 425 (32.3%) 401 (30.4%)
Three-vessel disease 1400 (17.5%) 542 (21.3%) 256 (19.4%) 281 (21.3%)
Three-vessel disease with LM 130 (1.6%) 38 (1.5%) 26 (2.0%) 24 (1.8%)
Total number of stents 1.18 ± 0.41 1.20 ± 0.44 0.024 0.056 1.19 ± 0.43 1.20 ± 0.45 0.560 0.022 Stent size
Length, mm 29.3 ± 14.1 29.9 ± 14.4 0.103 0.041 29.9 ± 15.0 29.9 ± 14.7 0.998 0.0001
Diameter, mm 3.1 ± 0.6 2.9 ± 0.5 < 0.001 0.338 3.0 ± 0.5 3.0 ± 0.5 0.484 0.027
Data are presented as mean ± SD, median (interquartile range), or n (%) where appropriate. Lesion based on American College of Cardiology/American Heart Association lesion classification. AMI: acute myocardial infarction; LAD: left anterior descending artery; LCX: left circumflex artery; LMCA: left main coro- nary artery; RCA: right coronary artery; PSM: propensity score matching; TIMI: thrombolysis in myocardial infarction.
3.2 Clinical outcomes of the crude population
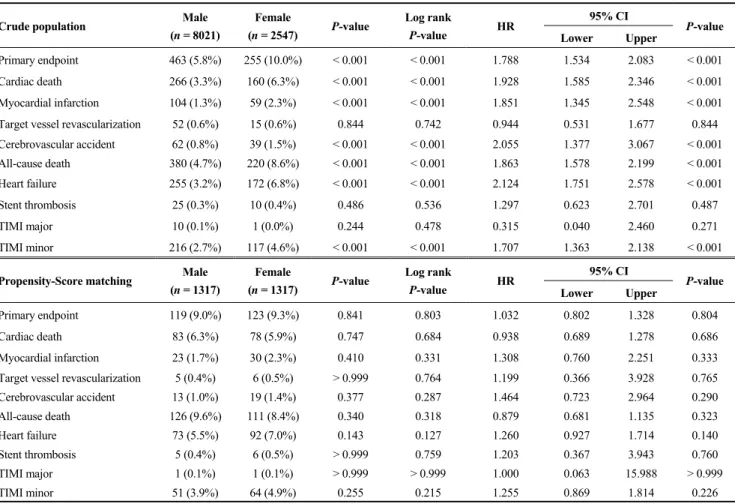
The unadjusted 1-year clinical outcomes among AMI pa- tients who underwent successful PCI are shown in Table 3 (upper panel). The cumulative rate of primary composite outcome was significantly higher in women than in men (463 (5.8%) vs. 255 (10.0%), HR (95% CI): 1.788 (1.534
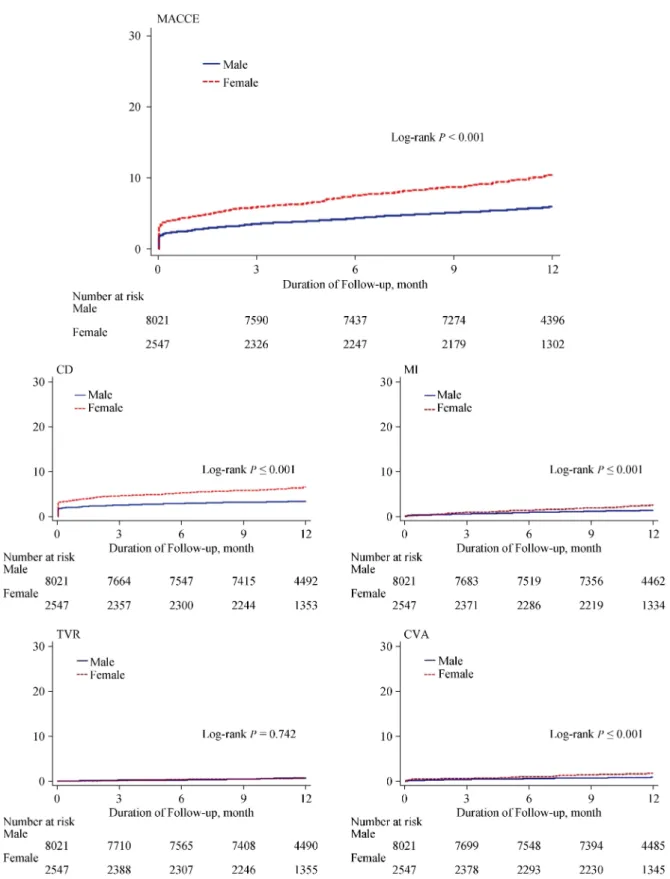
2.083), P < 0.001, Table 3 (upper panel)). Individually, the unadjusted cumulative incidence of cardiac death, MI and CVA within one year of the index MI event was signifi- cantly higher among women than among men (Table 3 (upper panel) and Figure 2). The contrast in the primary composite outcome between men and women was mainly driven by the increased risk for cardiac death in women (266 (3.3%) vs. 160 (6.3%), HR (95% CI): 1.928 (1.585
2.346), P < 0.001, Table 3 (upper panel) and Figure 2). In the secondary outcomes, the overall mortality rate was sig- nificantly higher in women than in men. (220 (8.6%) vs. 380 (4.7%), HR (95% CI): 1.863(1.5782.199), P < 0.001, Ta- ble 3 (upper panel)). Heart failure and TIMI minor bleeding occurred more frequently in women than in men (heart failure:
172 (6.8%) vs. 255 (3.2%), HR (95% CI): 2.214 (1.751
2.578), P < 0.001, TIMI minor: 117 (4.6%) vs. 216 (2.7%), HR (95% CI): 1.707 (1.3632.138), P < 0.001; Table 3 (upper panel)) whereas there was no difference in stent thro- mbosis and TIMI major bleeding between men and women (Table 3 (upper panel)). The Kaplan-Meier curve for the 1- year primary composite endpoint and individual components of primary endpoint are shown in Figure 2.
3.3 Clinical outcomes of the propensity score matched population
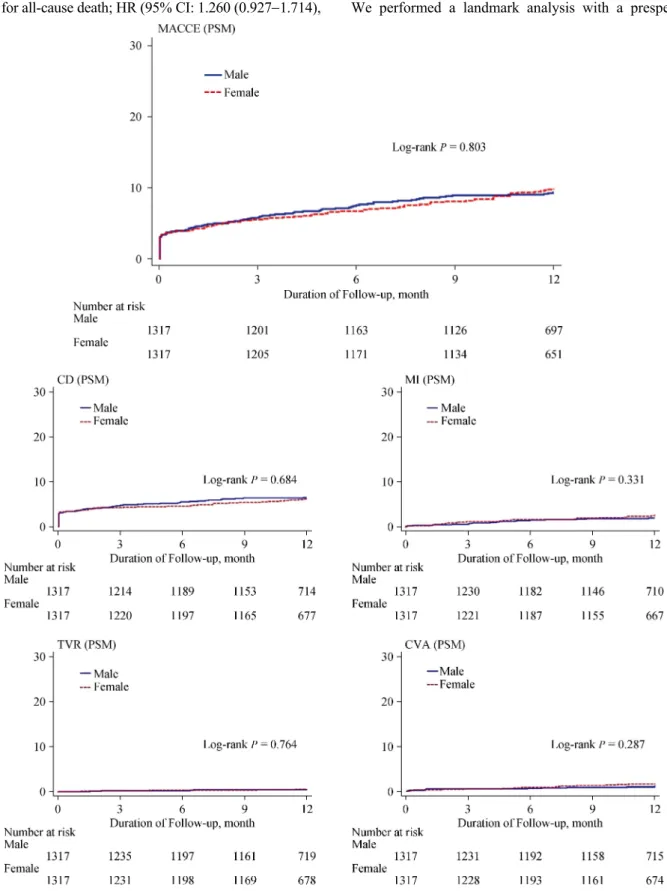
The 1-year clinical outcomes among AMI patients who underwent successful PCI after PS matching are shown in Table 3 (lower panel) and Figure 3. PS matching yielded 1,317 pairs with balanced baseline characteristics including demographic, clinical, laboratory and angiographic features (Table 2 (right panel)). After PS matching, female sex was no longer significantly associated with a higher risk of MACCE (HR (95% CI): 1.032 (0.8021.328), P = 0.803, Table 3 (lower panel)). All observed differences in each
Table 3. One-year clinical outcomes in AMI patients in Crude and Propensity Score matched population.
95% CI
Crude population Male
(n = 8021)
Female
(n = 2547) P-value Log rank
P-value HR
Lower Upper P-value Primary endpoint 463 (5.8%) 255 (10.0%) < 0.001 < 0.001 1.788 1.534 2.083 < 0.001
Cardiac death 266 (3.3%) 160 (6.3%) < 0.001 < 0.001 1.928 1.585 2.346 < 0.001
Myocardial infarction 104 (1.3%) 59 (2.3%) < 0.001 < 0.001 1.851 1.345 2.548 < 0.001
Target vessel revascularization 52 (0.6%) 15 (0.6%) 0.844 0.742 0.944 0.531 1.677 0.844
Cerebrovascular accident 62 (0.8%) 39 (1.5%) < 0.001 < 0.001 2.055 1.377 3.067 < 0.001
All-cause death 380 (4.7%) 220 (8.6%) < 0.001 < 0.001 1.863 1.578 2.199 < 0.001
Heart failure 255 (3.2%) 172 (6.8%) < 0.001 < 0.001 2.124 1.751 2.578 < 0.001
Stent thrombosis 25 (0.3%) 10 (0.4%) 0.486 0.536 1.297 0.623 2.701 0.487
TIMI major 10 (0.1%) 1 (0.0%) 0.244 0.478 0.315 0.040 2.460 0.271
TIMI minor 216 (2.7%) 117 (4.6%) < 0.001 < 0.001 1.707 1.363 2.138 < 0.001
95% CI Propensity-Score matching Male
(n = 1317)
Female
(n = 1317) P-value Log rank
P-value HR
Lower Upper P-value
Primary endpoint 119 (9.0%) 123 (9.3%) 0.841 0.803 1.032 0.802 1.328 0.804
Cardiac death 83 (6.3%) 78 (5.9%) 0.747 0.684 0.938 0.689 1.278 0.686
Myocardial infarction 23 (1.7%) 30 (2.3%) 0.410 0.331 1.308 0.760 2.251 0.333
Target vessel revascularization 5 (0.4%) 6 (0.5%) > 0.999 0.764 1.199 0.366 3.928 0.765
Cerebrovascular accident 13 (1.0%) 19 (1.4%) 0.377 0.287 1.464 0.723 2.964 0.290
All-cause death 126 (9.6%) 111 (8.4%) 0.340 0.318 0.879 0.681 1.135 0.323
Heart failure 73 (5.5%) 92 (7.0%) 0.143 0.127 1.260 0.927 1.714 0.140
Stent thrombosis 5 (0.4%) 6 (0.5%) > 0.999 0.759 1.203 0.367 3.943 0.760
TIMI major 1 (0.1%) 1 (0.1%) > 0.999 > 0.999 1.000 0.063 15.988 > 0.999
TIMI minor 51 (3.9%) 64 (4.9%) 0.255 0.215 1.255 0.869 1.814 0.226
Data are presented as n (%). AMI: acute myocardial infarction; TIMI: thrombolysis in myocardial infarction.
Figure 2. Kaplan-Meier curve for the 12-month probability of each endpoint in patients with MI undergoing primary PCI comparing men and women before propensity score matching. CD: cardiac death; CVA: cerebrovascular accident; MACCE: major adverse cardiac and cerebrovascular events; MI: myocardial infarction; PCI: percutaneous coronary intervention; TVR: target vessel revascularization.
primary and secondary outcomes were no longer significant after PS matching: HR (95% CI): 0.938 (0.6891.278), P
= 0.684 for CD; HR (95% CI): 1.308 (0.7602.251), P =
0.331 for MI; HR (95% CI): 1.464 (0.7232.964), P =
0.287 for CVA; HR (95% CI): 0.879 (0.6811.135), P =
0.340 for all-cause death; HR (95% CI: 1.260 (0.9271.714), P = 0.127 for heart failure (Table 3 (lower panel), Figure 3).
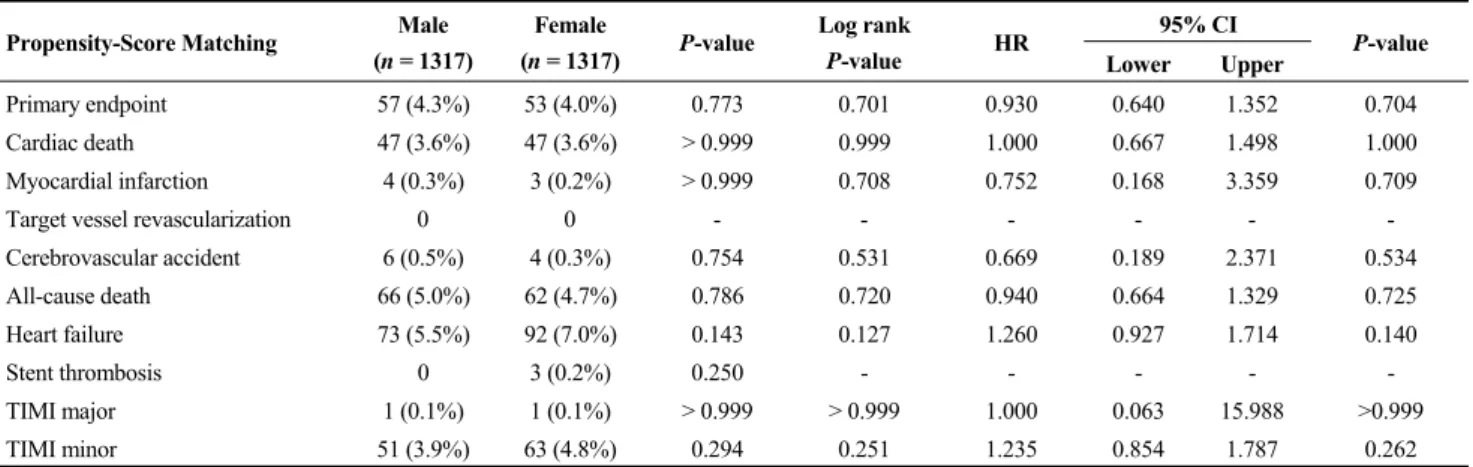
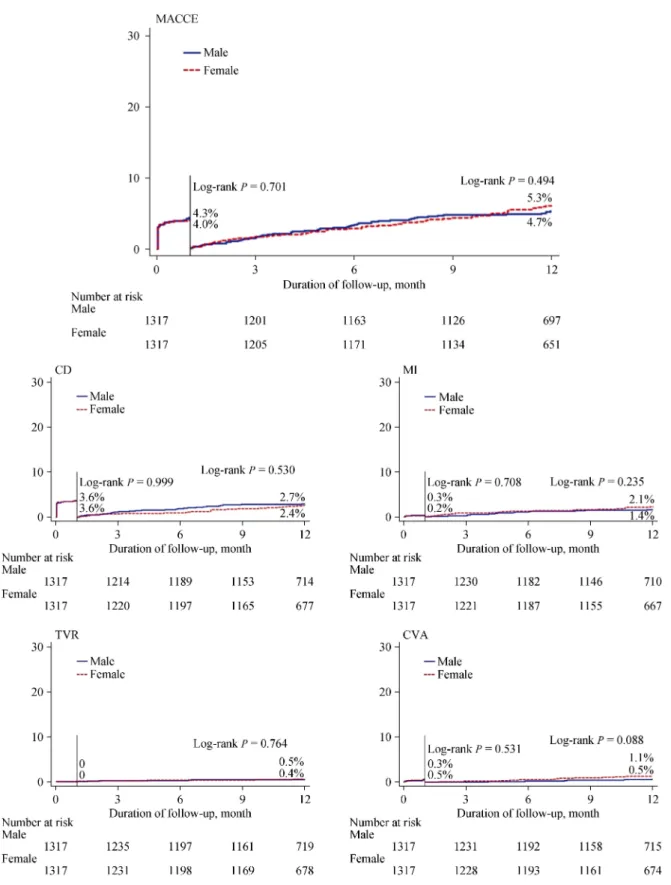
We performed a landmark analysis with a prespecified
Figure 3. Kaplan-Meier curve for the 12-month probability of each endpoint in propensity score matched patients with AMI un- dergoing primary PCI comparing men and women. AMI: acute myocardial infarction; CD: cardiac death; CVA: cerebrovascular accident;
MACCE: major adverse cardiac and cerebrovascular events; PCI: percutaneous coronary intervention; PSM: propensity score matching; TVR:
target vessel revascularization.
Table 4. One-month landmark clinical outcomes in AMI patients in Propensity Score Matched population.
95% CI Propensity-Score Matching Male
(n = 1317)
Female
(n = 1317) P-value Log rank
P-value HR
Lower Upper P-value
Primary endpoint 57 (4.3%) 53 (4.0%) 0.773 0.701 0.930 0.640 1.352 0.704
Cardiac death 47 (3.6%) 47 (3.6%) > 0.999 0.999 1.000 0.667 1.498 1.000
Myocardial infarction 4 (0.3%) 3 (0.2%) > 0.999 0.708 0.752 0.168 3.359 0.709
Target vessel revascularization 0 0 - - - -
Cerebrovascular accident 6 (0.5%) 4 (0.3%) 0.754 0.531 0.669 0.189 2.371 0.534
All-cause death 66 (5.0%) 62 (4.7%) 0.786 0.720 0.940 0.664 1.329 0.725
Heart failure 73 (5.5%) 92 (7.0%) 0.143 0.127 1.260 0.927 1.714 0.140
Stent thrombosis 0 3 (0.2%) 0.250 - - - - -
TIMI major 1 (0.1%) 1 (0.1%) > 0.999 > 0.999 1.000 0.063 15.988 >0.999
TIMI minor 51 (3.9%) 63 (4.8%) 0.294 0.251 1.235 0.854 1.787 0.262
Data are presented as n (%). AMI: acute myocardial infarction; TIMI: thrombolysis in myocardial infarction.