이용자는 아래의 조건을 따르는 경우에 한하여 자유롭게 l 이 저작물을 복제, 배포, 전송, 전시, 공연 및 방송할 수 있습니다. l 이차적 저작물을 작성할 수 있습니다. l 이 저작물을 영리 목적으로 이용할 수 있습니다. 다음과 같은 조건을 따라야 합니다: l 귀하는, 이 저작물의 재이용이나 배포의 경우, 이 저작물에 적용된 이용허락조건 을 명확하게 나타내어야 합니다. l 저작권자로부터 별도의 허가를 받으면 이러한 조건들은 적용되지 않습니다. 저작권법에 따른 이용자의 권리는 위의 내용에 의하여 영향을 받지 않습니다. 이것은 이용허락규약(Legal Code)을 이해하기 쉽게 요약한 것입니다. Disclaimer 저작자표시. 귀하는 원저작자를 표시하여야 합니다.
Role of protein kinase C isozymes
in cellular senescence and reversal of senescence
in response to 12-O-tetradecanoylphorbol-13
acetate (TPA) treatment in Human Diploid
Fibroblasts
by
Yun Yeong Lee
Major in Molecular Medicine
Role of protein kinase C isozymes
in cellular senescence and reversal of senescence
in response to 12-O-tetradecanoylphorbol-13
acetate (TPA) treatment in Human Diploid
Fibroblasts
by
Yun Yeong Lee
A Dissertation Submitted to The Graduate School of
Ajou University in Partial Fulfillment of the Requirements
for the Degree of Ph.D. in Biomedical Sciences
Supervised by
In Kyoung Lim M.D., Ph.D.
Major in Molecular Medicine
Department of Biomedical Sciences
The Graduate School, Ajou University
This certifies that the dissertation
of Yun Yeong Lee is approved.
SUPERVISORY COMMITTEE
Gyesoon Yoon
Sang Chul Park
Kye Yong Song
In Kyoung Lim
Tae Jun Park
The Graduate School, Ajou University
January 5
th, 2016
i - ABSTRACT-
Role of protein kinase C isozymes in cellular senescence and reversal of senescence in response to 12-O-tetradecanoylphorbol-13 acetate (TPA) treatment in
Human Diploid Fibroblasts
Cellular senescence plays an important role in biological processes such as development, aging and tumorigenesis, and it is a process of permanent growth arrest when cells lose ability to reactivate cell division cycle. One of the common molecular features of senescent cells is the failure of phospho-extracellular signal-regulated protein kinase 1/2 (pErk1/2) translocation to nuclei in response to growth factor stimulation. However, when senescent cells are treated with 12-O-tetradecanoylphorbol-13-acetate (TPA), old cell morphology starts to change young cell like in addition to molecular markers of cellular senescence, such as increases of DNA synthesis, pRB hyperphosphorylation, reductions of p53, p21Sdi1/WAF1/CIP1 and SA-β-galactosidase activity.
Mechanism of how 12-O-tetradecanoylphorbol-13-acetate (TPA) bypasses cellular senescence was investigated using replicative senescence of HDF cells and DMBA-TPA induced carcinogenesis in CD-1 mice. Upon TPA treatment, PKCα and PKCβ1 played differentially in the nuclear translocation of senescence-associated pErk1/2, which regulates reversal of senescence; PKCα carried pErk1/2 to nuclei after freed from PEA-15pS104 by PKCβ1, and then
rapidly degraded by ubiquitination. MAPK docking motif and kinase activity in PKCα were required to carry pErk1/2. Moreover, repetitive application of TPA on mouse skin revealed significant loss of PKCα expression along with acanthosis in epidermis and hair follicle, indicating that downregulation of PKCα was accompanied with epidermal proliferation. The above observations were further supported by the RNA-seq analyses in HDF old cells: TPA-mediated PKCα degradation allows pErk1/2 to be free to promote cell proliferation in both senescence and carcinogenesis, emphasizing the role of PKC isozymes and cytoplasmic pErk1/2 in the regulation of cellular senescence.
Mitochondrial dysfunction is linked between age-related accumulation of oxidative damage and alterations of physiological function associated with senescence. Recent studies suggest that mitochondrial metabolism is upregulated in oncogene induced senescent cells to meet with metabolic demand of cytokine production. In addition, a partial uncoupling of oxidative
ii
phosphorylation in mitochondria has been reported in the senescence fibroblast cells; thus ATP production is insufficient despite increased oxygen consumption. We report herein increased mass and DNA contents of mitochondria in the replicative HDF cells along with mitochondrial hyperfusion, and elevated expression of OXPHOS complex 4 and 5 proteins than those of the young cells. Furthermore, increased 5-bromo-2'-deoxyuridine (BrdU) incorporation at the mitochondrial nucleoid along with mitochondrial transcription factors A (TFAM). Nevertheless, we observed that mitochondria dysfunction was increased via alteration of ROS level, integrity of membrane potential, mitochondria cristae structure and ATP content. To explore signaling pathways regulating the phenotypes, we analyzed the mitochondrial TFAM protein expression which was found to be significantly increased in old cells. Up regulation of TFAM was accompanied with increased PGC-1α and NRF1 expressions through the activations of LKB1 and AMPK due to increased activity of PKCζ in old cells. These signaling pathways are important in regulating the mitochondrial encoding OXPHOS complex subunit genes and respiration as well as ATP generation, evidenced by employing siRNA against PKCζ. All of the findings were further confirmed in the doxorubicin-induced premature senescence of young HDF cells. These datas indicate that continuous increase of BrdU positive cells and mitochondrial biogenesis is regulated by LKB1, AMPK and PKCζ, despite higher ROS accumulation in stress induced senescence model. In summary, the activation of mitochondrial biogenesis pathway via PKCζ-LKB1-AMPK in senescent cells might be due to the compensation of mitochondrial dysfunction, which stimulated maintaining of nucleoid structure and TFAM activity via PGC-1α and NRF1 increased by LKB1-AMPK-PKCζ signal pathway. Our present study suggests a new concept about mitochondrial function in old cells and offers a plausible explanation on the role of mitochondrial hyperfunction in senescence, being a survival reaction when exposed to lower energy condition and cell stress.
iii KEY WORDS:
Senescence Associated-pErk1/2, TPA (12-O-tetradecanoylphorbol-13-acetate), Reversal of senescence phenotype, PEA-15, HDF, PKCα, PKCβ1, ubiquitination, DMBA-TPA, carcinogenesis, acanthosis, skin, BrdU, PKCζ, TFAM, NRF1, LKB1, AMPK, Nucleoid, Mitochondiria.
ABBREVIATIONS:
HDF: human diploid fibroblast, TPA: 12-O-tetradecanoylphorbol-13-acetate, SA-pErk1/2: senescence associated phospho-extracellular signal-regulated protein kinase 1/2 , PEA-15: phosphoprotein enriched in astrocyte, PKC: protein kinase C, MAPK: Mitogen activated protein kinase, DMBA: 7, 12-dimethylbenz[a]anthracene , EGF: epidermal growth factor, NLS: nuclear localization sequence, BrdU: 5-bromo-2'-deoxyuridine, GOTERM BP: gene ontology term biological process, GOTERM CC: gene ontology term cellular component, ROS: Reactive oxygen species, SA-β-gal : Senescence-associated beta-galactosidase, OXPHOS : Oxidative phosphorylation, OCR : Oxygen consumption rate, PKCζ : protein kinase C zeta, PGC-1α Peroxisome proliferator-activated receptor gamma coactivator 1-alpha, TFAM : Transcription Factor A, Mitochondrial, NRF1 : Nuclear respiratory factor 1, LKB1 : liver kinase B1, AMPK : Adenine monophosphate-activated protein kinase
iv
TABLE OF CONTENTS
ABSTRACT ··· i
KEY WORDS & ABBREVIATION ··· iii
TABLE OF CONTENTS ··· iv
LIST OF FIGURES ··· vii
Part І-A I. INTRODUCTION ··· 1
II. MATERIALS AND METHODS ··· 5
1. Cell culture ··· 5
2. Senescence-associated-β-gal assay ··· 5
3. Immunoprecipitation (IP) and immunoblot analyses ··· 5
4. Cell fractionation ··· 6
5. Immunocytochemistry ··· 6
6. BrdU incorporation assay ··· 6
7. Cell cycle analysis··· 7
8. Cell proliferation assay··· 7
9. Real-time PCR analysis ··· 7
10. siRNA transfection ··· 7
11. Statistical analysis ··· 8
III. RESULTS ··· 9
A. Nuclear translocation of pErk1/2 apart from cytoplasmic PEA-15 upon TPA treatment··· 9
B. Knockdown of PEA-15 expression induced pErk1/2 translocation to nuclei ··· 12
C. Knockdown of PEA-15 and TPA treatment reduced senescence phenotype ··· 15
D. Progression of G1/S phase by either TPA or siPEA-15 transfection ··· 18
E. Increase of cell proliferation by either knockdown of PEA-15 or TPA treatment ··· 20
F. Regulation of TPA-induced c-fos expression by nuclear Erk1/2 in HDF old cells ···· 22
IV. DISCUSSION ··· 24
v
Part І-B
I. INTRODUCTION ··· 27
II. MATERIALS AND METHODS ··· 34
1. Cell culture ··· 34
2. Immunoblot (IB) analysis ··· 34
3. Immunoprecipitation (IP) ··· 35
4. Cells fractionation ··· 35
5. Immunocytochemistry (ICC) ··· 35
6. Two stage skin carcinogenesis ··· 36
7. Immunofluorescence (IF) study ··· 36
8. GST-pull down and in vitro kinase-immunoblot analyses ··· 36
9. siRNA transfection··· 37
10. Plasmid transfection ··· 37
11. Site-directed mutagenesis ··· 37
12. RNA-seq analysis··· 37
12.1. Preprocessing and genome mapping ··· 38
12.2. Quantifying gene expression and differential expressed gene analysis ··· 38
12.3. Functional category analysis ··· 39
13. Statistical analysis ··· 39
III. RESULTS ··· 40
A. Downregulation of PKCα reduces TPA response in HDF senescent cells to nuclear translocation of SA-pErk1/2 ··· 40
B. PKCβ1 regulates in vivo phosphorylation of PEA-15 at S104 residue which dissociates pErk1/2 from PEA-15 in HDF old cells ··· 45
C. Nuclear translocation of Erk1/2 requires its activation and interaction with PKC upon TPA treatment ··· 50
D. Swift degradation and delayed regeneration of PKCa expression allow senescent cells undergo reverse senescence upon TPA treatment··· 52
E. Loss of PKCa expression accompanies with acanthosis of epidermis in CD-1 mice by repetitive TPA treatment ··· 56 F. RNA-seq analyses support reversal of senescence program after TPA treatment
vi in HDF old cells ··· 58 IV. DISCUSSION ··· 69 V. CONCLUSION ··· 73 Part Π I. INTRODUCTION ··· 74
II. MATERIALS AND METHODS ··· 78
1. Cell culture ··· 78
2. Doxorubicin treatment ··· 78
3. Senescence-associated-β-gal assay ··· 78
4. Immunocytochemistry··· 79
5. BrdU incorporation assay ··· 79
6. Real-time PCR analysis ··· 79
7. siRNA transfection··· 80
8. Preparation of mitochondrial Fractions ··· 80
9. Measurement of DNA Polymerase γ Activity ··· 80
10. Electron microscopy analysis ··· 81
11. Mitochondrial DNA copy-number analysis··· 81
12. ATP Determination ··· 81
13. Intracellular ROS detection ··· 81
14. Mitochondrial permeability potential assay ··· 82
15. Mitochondrial respiration measurement ··· 82
16. PKCζ kinase assay ··· 82
17. Statistical analysis ··· 82
III. RESULTS ··· 84
A. Increased of dysfunctional mitochondria in replicative senescent human diploid fibroblast cells··· 83
B. Increase in punctuate marks of nucleoid along with BrdU incorporation and mitochondrial biogenesis in senescent cells ··· 85
C. PKCζ is a key regulator of mitochondrial nucleoid and mitochondrial biogenesis in senescent HDF cells ··· 88
vii
D. Phenotypes in stress induced senescence was also observed by low-dose of Doxorubicin
treatment to cells ··· 90
E. Regulation of BrdU incorporation and mitochondrial biogenesis through PKCζ- LKB1-AMPK signa ing pathway in stress induced senescent cells··· 92
IV. DISCUSSION ··· 96
V. CONCLUSION & SCHEMETIC DIAGRAM ··· 99
REFERENCES ··· 100
국문요약 ··· 109
LIST OF FIGURES
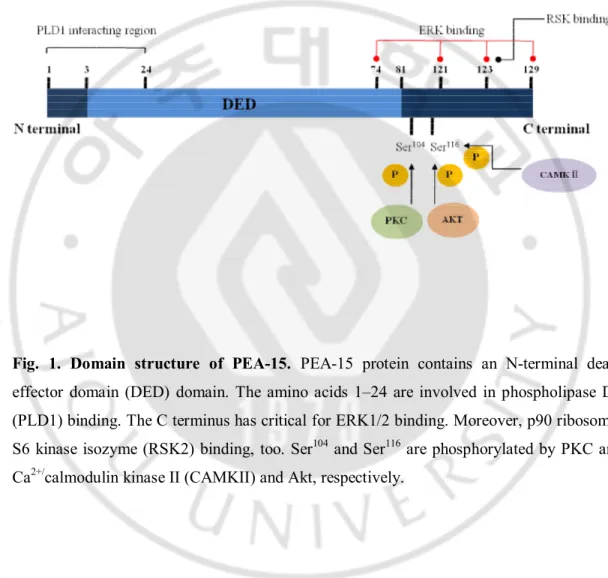
Fig. 1. Domain structure of PEA-15 protein ··· 3Fig. 2. Nuclear translocation of SA-pErk1/2 apart from PEA-15 upon TPA treatment ··· 10
Fig. 3. Knockdown of PEA-15 induced nuclear translocation of pErk1/2 ··· 13
Fig. 4. Reversal of senescence phenotypes by either knockdown of PEA-15 or TPA treatment ··· 16
Fig. 5. Progression of G1 to S phase by either TPA treatment or knockdown of PEA-15 in HDF senescent cells ··· 18
Fig. 6. Increase of cell proliferation by either knockdown of PEA-15 or TPA treatment 21 Fig. 7. TPA-induced c-fos expression by nuclear Erk1/2 in HDF old cells ··· 23
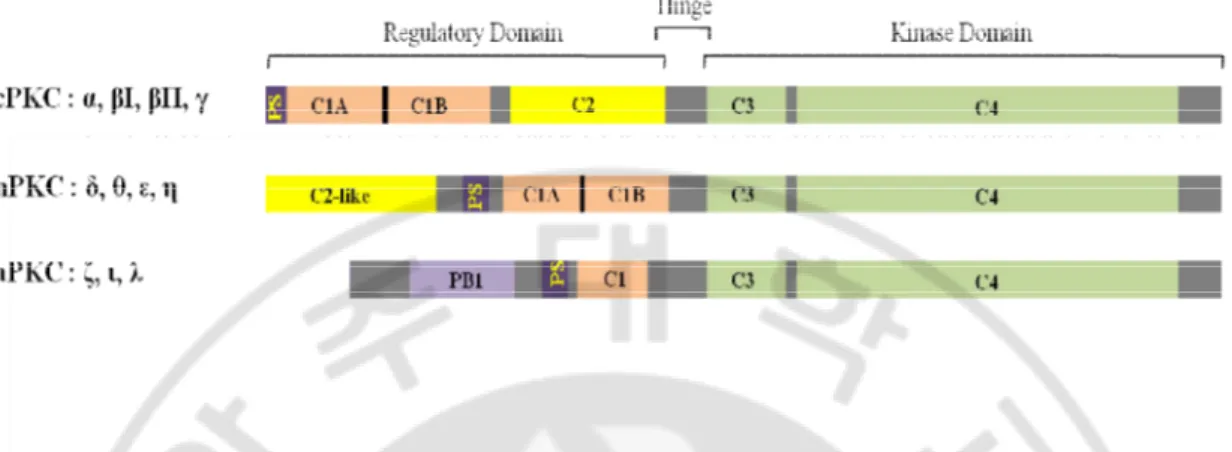
Fig. 8. Domain structures of protein kinase C (PKC) isoforms··· 29
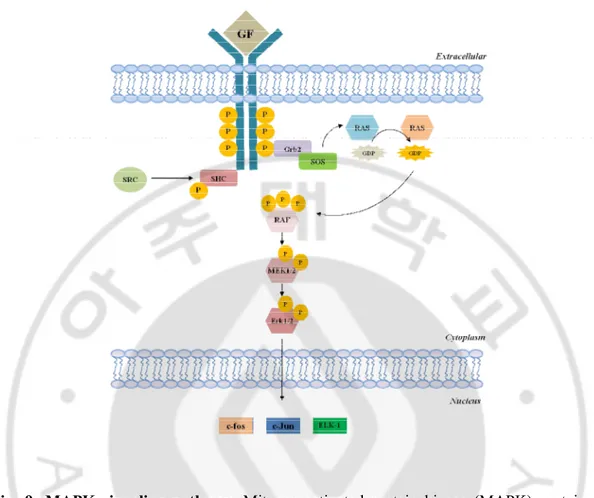
Fig. 9. MAPK pathway ··· 31
Fig. 10. Downregulation of PKCa reduces pErk1/2 translocation to nuclei of HDF senescent cells upon TPA treatment ··· 42
Fig.
11
. PKCβ1 regulates in vivo phosphorylation of PEA-15 at S104 upon TPA treatment, which dissociates pErk1/2 from PEA-15 in HDF old cells ··· 47Fig.
12
. Regulatory and catalytic domains of wt-PKCa are required to translocate pErk1/2 to nuclei of Huh7 cells in response to TPA ··· 51Fig. 1
3
. Swift degradation and delayed regeneration of PKCa protein occurs upon TPA treatment···
54viii
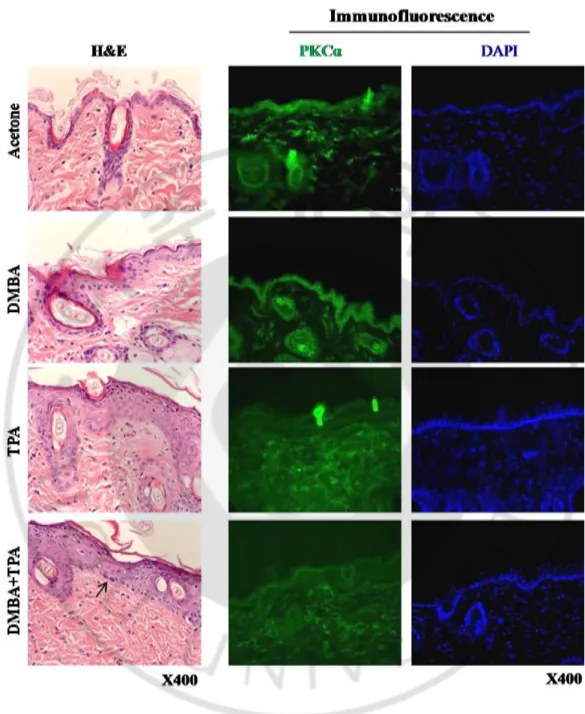
Fig. 14. Loss of PKCa expression accompanies with acanthosis of epidermis in
CD1 mice by repetitive TPA treatment ··· 57
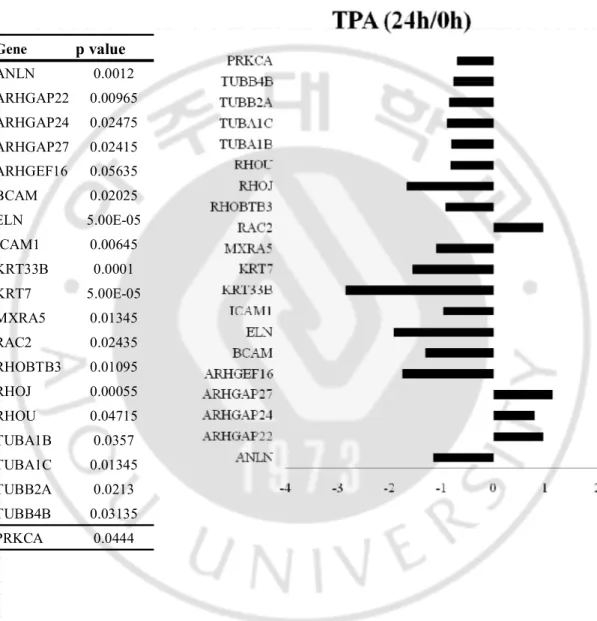
Fig. 15. Relative values of the differentially expressed genes (DEG) in the HDF old cells treated with TPA for 8 h and 24 h based on the DMSO treated control ··· 60
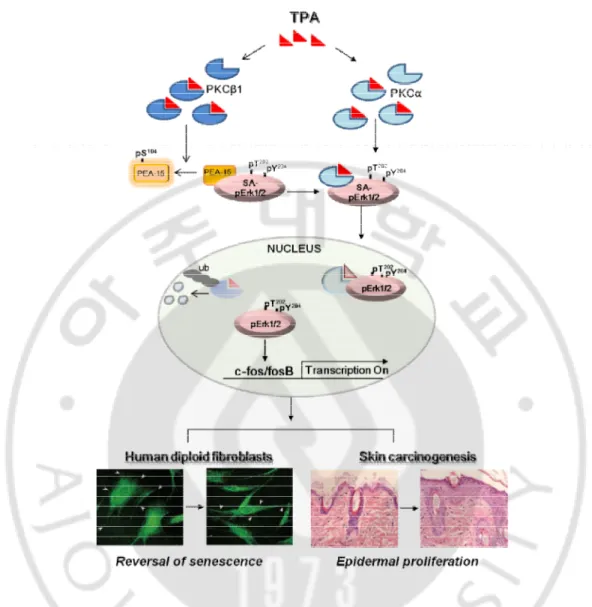
Fig. 16. PKCα and PKCβ1 plays differentially in the nuclear translocation of pErk1/2 upon TPA treatment which regulates reversal of senescence phenotypes ··· 68
Fig. 17. Mechanisms of mitochondrial dysfunction ··· 75
Fig. 18. Dysfunctional mitochondrial mass along with increased DNA content in senescent cells ··· 84
Fig. 19. Significantly increased BrdU incorporation into mitochondrial nucleoid along with increased expression of OXPHOS complex subuints in the replicative senescent HDF cells ··· 87
Fig. 20. Signaling pathways regulating mitochondrial biogenesis through PKCζ-LKB1- AMPK axis in the senescent HDF cells··· 89
Fig. 21. BrdU incorporation into mitochondria was observed in the doxorubicin-induced premature senescent cells ··· 91
Fig. 22. OXPHOS genes and BrdU incorporation is regulated by PKCζ, pLKB1 and pAMPK in doxorubicin-induced premature senescent of HDF cells ··· 93
Fig. 23. Schematic diagram revealing the regulation of mitochondrial biogenesis and its function in senescent fibroblasts both replicative and stress-induced senescence ··· 99
Table 1 ··· 64
Table 2 ··· 66
- 1 -
Part. Ι-A
Downregulation of PEA-15 reverses G1 arrest, and nuclear and
chromatin changes of senescence phenotypes via pErk1/2 translocation
to nuclei
I. INTRODUCTION
Cellular senescence plays an important role in biological processes such as development, aging and tumorigenesis, and it is a process of permanent growth arrest when cells lose ability to reactivate cell division cycle. Senescent cells show a number of characteristic features such as enlarged and flat cellular morphology, positive staining for senescence associated b-galatosidase (SA-b-gal), gene expression patterns and senescence-associated heterochromatin marks (Campisi and d'Adda di Fagagna, 2007). The cells are metabolically active, however, cannot respond to mitogens, leading to cell cycle arrest along with reduced cell proliferation, thus playing tumor suppressive effect. Hayflick and Moorhead earlier described cellular senescence as an in vitro manifestation of human aging (Hayflick and Moorhead., 1961). One of the molecular features of senescent cells is the failure of pErk1/2 translocation to nuclei in response to EGF, as opposed to G-actin accumulation in nuclei of the cells (Lim et al., 2000; Lim et al., 2001). Potential mechanisms of cytoplasmic retention of pErk1/2 have been shown to be inactivations of PP1, PP2A, and MKP3 by elevated reactive oxygen species level (Kim et al., 2003). In addition, the failure of actin remodeling in senescent morphology might be due to cofilin activation as opposed to LIMK inactivation, which results in G-actin accumulation in nuclei of senescent cells (Lim et al., 2000; Kwak et al., 2004). However, when senescent HDF cells are treated with TPA, but not EGF, old cell morphology starts to become young cell-like in addition to molecular changes of cellular senescence, such as increases of DNA synthesis and pRB phosphorylation, as opposed to reductions of p53, p21WAF1 and SA-β-gal activity (Kwak et
- 2 - al., 2004).
Phorbol esters activate PKC isozymes longer than physiological regulators, and prolonged vs. transient activation of PKCs is an important distinction that may form the basis for tumor-promoting activity of phorbol esters (Jaken., 1990; Nishizuka., 1992). MAPK pathway regulates various cellular functions including cell proliferation, differentiation, migration, and apoptosis (Chang and Karin., 2001), and the terminal element of this pathway, ERK1 and ERK2 (Erk1/2), regulates transcription factors (e.g. c-fos) in nucleus upon phosphorylation (Cruzalegui et al., 1999). Erk1/2 have, therefore, to be translocated from cytoplasm to nucleus upon various stimuli, and a significant fraction (> 50%) of Erk1/2 can be found in nuclei within 10 to 20 minutes after stimulation (Chen et al., 1992). Redistribution of Erk1/2 is regulated by its interaction with proteins such as β-arrestin, paxillin, MEK, and PEA-15 (Roskoski et al., 2012; Formstecher et al., 2001). PEA-15 is a 15-kDa protein containing death effector domain, associated with microtubules, and identified in astrocyte (Araujo et al., 1993). It is expressed in various tissues and highly conserved in mammals, and directly binds to Erk1/2 in vitro and in vivo (Formstecher et al., 2001; Gaumont-Leclerc et al., 2004). PKC and calcium calmodulin kinase II or Akt phosphorylate PEA-15 at S104 and S116 residues, respectively (Araujo et al., 1993;
Kubes et al., 1998). Phosphorylation of PEA-15 at S104 blocks it’s interaction with ERK both in
vivo and in vitro (Krueger et al., 2005; Renganathan et al., 2005) (Fig. 1). It is, therefore, highly tempting to suggest that PEA-15 contributes to the regulation of cellular senescence.
In the present study, we explored the role of PEA-15 played in reduction of senescence phenotypes by using siRNA, focusing on the nuclear translocation of SA-pErk1/2 in HDF old cells.
- 3 -
Fig. 1. Domain structure of PEA-15. PEA-15 protein contains an N-terminal death effector domain (DED) domain. The amino acids 1–24 are involved in phospholipase D1 (PLD1) binding. The C terminus has critical for ERK1/2 binding. Moreover, p90 ribosomal S6 kinase isozyme (RSK2) binding, too. Ser104 and Ser116 are phosphorylated by PKC and
- 4 -
Purpose of this study
It has been reported that pErk1/2 is bound to phosphoprotein enriched in astrocytes 15
(PEA-15) and we have also previously reported that pErk1/2 is heavily accumulated in
the cytoplasm of the senescent cells. We hypothesized that senescent cells are not
responsive to mitogens due to sequestration of SA-pErk1/2 by interacting with PEA-15.
However, we observed that treatment of senescent cells with TPA reversed senescent
cells to young cell like morphology with nuclear translocation of pErk1/2. In the present
study, we have investigated the mechanism of cytoplasmic sequestrated pErk1/2
translocation to nuclei in response to 12-O-tetradecanoylphorbol-13-acetate (TPA)
treatment, but not other growth factors.
- 5 -
II. MATERIALS AND METHODS
A. MATERIALS
TPA, insulin, and EGF were purchased from Sigma (St. Louis, MO, USA), and antibodies against pErk1/2, Erk1/2, PEA-15pS104, PEA-15, pAktS473, 53BP1 and Akt were from Cell
Signaling (Danvers, MA, USA). Antibodies to p53, p21WAF1, Lamin B1, HA and α-tubulin were from Santa Cruz (Santa Cruz, CA, USA), and anti-PEA-15pS116 was from Invitrogen. Anti-PML
antibody was from Abcam (Cambridge, MA, USA) and anti-histone H3K9 dimethylated (H3K9m2) antibody was purchased from Millipore (Billerica, MA, USA).
B. METHODS
1. Cells culture
HDF cells were isolated in our laboratory from foreskin of a 4 year-old boy (Lim et al., 2000; Kwak et al., 2004), and the primary culture was maintained in Dulbecco’s modified Eagle’s medium supplemented with 10% fetal bovine serum (Invitrogen/GIBCO, Grand Island, NY, USA). Number of population doublings and their doubling times were calculated by the published equations (Kim et al., 2009). HDF young cells used in this study represent doubling time of around 26 h, the mid-old and the old cells indicate doubling times of around 4–10 days and over 14 days, respectively. Cells were incubated in 5% CO2 at 37 °C.
2. Senescence-associated b-gal assay
Cells washed twice in PBS and fixed for 5 min in 4% formaldehyde were incubated at 37 °C with staining solution containing 1.0 mg of 5-bromo-4-chloro-3-indolyl-β-D-galactopyranoside (X-Gal) per ml of dimethylformamide, 40 mM citric acid/sodium phosphate (pH 6.0), 5 mM potassium ferrocyanide, 5 mM potassium ferricyanide, 150 mM NaCl and 2 mM MgCl2.
Staining was evident in 2-4 h and maximum in 12-16 h. 3. Immunoprecipitation (IP) and immunoblot analyses
IP was performed with cell lysates (~1.0 mg protein) by the standard method in modified RIPA buffer without 0.1% SDS. Cell lysates pre-cleared with protein G-agarose beads for 1 h were precipitated with targeted antibodies for 4 h at 4 °C. The immunoprecipitates were washed 5
- 6 -
times with IP buffer, and then subjected to immunoblot analyses in RIPA buffer. Proteins bands were resolved on 10-15% SDS-PAGE, and transferred to polyvinylidene fluoride (or nitrocellulose) membranes before hybridization with a targeted antibody overnight at 4 °C. The membranes were incubated with horseradish peroxidase-conjugated secondary antibodies for 1 h, and ECL (Amersham, Pharmacia Biotech, Piscataway, NJ, USA) kit was employed to visualize protein bands.
4. Cell fractionation
Cells were harvested with PBS and then lysed in TD buffer [25 mM Tris base (pH 8.0), 2.0 mM MgCl2, 0.25% v/v Nonident P40, 0.5 mM DTT, 1.0 μg/ml leupeptin, 100 μg/ml PMSF, 1.0 mM
Na3VO4, 1.0 mM NaF] for 5 min at room temperature (RT). After centrifugation at 12,000 g for
5 min, the supernatant was collected as cytoplasmic fraction, and the pellets were resuspended in BL buffer [10 mM Tris (pH 8.0), 0.4 M LiCl, 0.5 mM DTT, 1.0 μg/ml leupeptin, 100 μg/ml PMSF, 1.0 mM Na3VO4, 1.0 mM NaF] with vigorous vortex, and cell debris was removed by
centrifugation for 20 min. 5. Immunocytochemistry
Cells on cover slips were washed with PBS before fixation with 4% paraformaldehyde for 15 min, permeabilized with 0.05% Triton X-100, and then incubated with 3% bovine serum albumin in 0.05% Triton X-100 for 2 h. Primary antibody was applied overnight at 4 °C, secondary antibody at 4 °C for 2 h, and then stained with 4% 6-diamidino-2-phenylindole (2.0 mg/ml) for 10 min at RT before mounting. Expressions of pErk1/2 and PEA-15 were detected using polyclonal primary antibodies along with Alexa 488 or Alexa 555 conjugated goat-anti rabbit IgG as a secondary antibody. Data visualized under fluorescence microscope were photographed by AxioVision image acquisition and analyzed by software package (Carl Zeiss MicroImaging GmbH).
6. BrdU incorporation assay
Cells were treated with TPA for 30 min after transfection with either siControl or siPEA-15 for 48 h, pre-labeled with 10 μM BrdU (Sigma) for 2 h, fixed in 4% paraformaldehyde solution, and incubated in 2 M HCl for 30 min. pH was raised with 0.1 M sodium borate (pH 8.5) for 2 min. Immunocytochemistry steps were followed by using anti-BrdU FITC-labeled antibody
- 7 -
(eBioscience, San 125 Diego, CA, USA), and positive cells were counted under fluorescence microscope.
7. Cell cycle analysis
Cells were treated with TPA for 30 min after transfection with siPEA-15 for 48 h. They were then trypsinized and fixed before re-suspended in propidium iodide solution. DNA analysis was performed by flow cytometry (BD Biosciences, San Jose, CA, USA).
8. Cell proliferation assay
HDF mid-old cells (1.0 x 10⁵) were plated in 60 mm dish 24 hours before transfection for 4 h
with siRNAs (40nM) against PEA-15 or its scrambled sequences (siControl), and then the culture medium was changed with fresh one before incubation for 4 more days. Treatment of HDF cells with either DMSO (0.01%) or TPA (50 ng/ml) before the 4 day incubation was employed as the negative and positive controls of the experiment, respectively. All of the cells were harvested in 2 and 4 days after the treatment, and the numbers of cells were then counted by using Hemocytometer (Marienfeld-Superior, Germany). Changes of cell numbers were evaluated by Student's t-test. To monitor cell proliferation assay, HDF young cells (0.8 x 10⁵)
were plated in 60 mm dish, and then their proliferation activity was also monitored every 2 days. 9. Real-time PCR analysis
Total cellular RNAs were extracted with RNAiso Plus (TaKaRa Bio, Ohtsu, Japan), and cDNAs were synthesized with 1.0 μg of RNA and reverse transcription kit (Invitrogen). The cDNAs were used for real time PCR analysis with specific primers and SYBR Green PCR Master Mix (Applied Biosystems) under the conditions: Initial activation at 95 °C for 15 min, followed by 40 cycles at 95 °C for 20s and 60 °C for 40s. Primers used for c-fos amplification were 5’-TGACTGATACACTCCAAGCGGA-3 and 5’-CAGGTCATCAGGGATCTTGCA-3’ and for β-actin were 5’-CCCTGGCACCCAGCAC-3’ and 5’-GCCGATCCACACGGAGTAC-3’ 10. siRNA transfection
siRNAs against PEA-15 (siPEA-15) were purchased from Santa Cruz Biotechnology and control siRNAs from DHARMACON (Lafayette, CO, USA). Cells on a cover slip were transfected with siRNAs and Oligofectamine (Invitrogen) for 4-6 h. In 48 h, the cells were
- 8 -
treated with mitogen for 30 min before subjected to immunocytochemistry or immunoblot analyses.
11. Statistical analysis
All data were presented as means ±S.D and analyzed by one-way ANOVA for comparison between multiple groups or Student’s t-test using SPSS. Probability value less than 0.05 was considered as statistically significant.
- 9 -
III. RESULTS
A. Nuclear translocation of pErk1/2 apart from cytoplasmic PEA-15 upon TPA treatment To explore changes of PEA-15 expression and its interaction with pErk1/2 in cellular senescence, immunoblot and immunoprecipitaion analyses were carried out in HDF cells (Fig. 2A); expressions of PEA-15 in the young and old cells were same (upper panel), while their interaction with pErk1/2 was significantly higher in the old than young cells (lower panel). Moreover, pErk1/2 and PEA-15 were co-localized in the cytoplasm of the old cells, examined by immunocytochemistry (Fig. 2B). Nuclear translocation of pErk1/2 was significantly induced in young cells upon by either EGF or TPA treatment, however, old cells responded only to TPA, but not to insulin or EGF (Fig. 2C). Therefore, SA-pErk1/2 observed in the cytoplasm was accordingly reduced. Cell fractionation (Fig. 2D) and immunocytochemistry (Fig. 2E) revealed evident nuclear translocation of pErk1/2 apart from PEA-15 in HDF old cells after TPA stimulation.
- 11 -
Fig. 2. Nuclear translocation of SA-pErk1/2 apart from PEA-15 upon TPA treatment. (A) Interaction of PEA-15 with SA-pErk1/2 in HDF old, but not young cells. HDF young and old cells were subjected to immunoblot and immunoprecipitation analyses by using anti-PEA-15 antibody. β-actin and H-chain were used as loading controls, respectively. Expression of 15 was not different between young and old cells (upper panel), whereas the interaction of PEA-15 with pErk1/2 was significant only in old cells (lower panel). (B) Immunocytochemistry: Cytoplasmic co-location of SA-pErk1/2 and PEA-15 in the cytoplasm of HDF old cells. (C) Nuclear translocation of pErk1/2 in HDF old cells only by TPA treatment. Young and old cells were treated with either vehicle (0.01% DMSO), insulin (10 μg/ml), EGF (10 ng/ml) or TPA (50 ng/ml) for 30 min, and then subjected to immunocytochemical analysis with anti-pErk1/2 antibody. More than 100 cells were counted in randomly chosen fields, and the cells with pErk1/2 in nuclei were counted. Data indicate means ± SD after 3 independent experiments. TPA significantly increased nuclear translocation of pErk1/2 in both HDF young and old cells, while EGF was effective only in young cells. (D) Immunoblot anlsysis showing nuclear translocation of pErk1/2 without PEA-15 upon TPA treatment. To evaluate whether pErk1/2 translocation to nuclei is accompanied with PEA-15 or not, HDF old cells treated with either vehicle or TPA for 30 min were fractionated into nucleus (Nu) and cytoplasm (Cyt), and hydridized with anti-pErk1/2 and anti-PEA-15 antibodies. Lamin B1 and α-tubulin were used to exclude reciprocal contamination of the factions and loading controls. Note absence of PEA-15 in the nuclear fraction, despite translocation of pErk1/2 into nuclei, of old cells after TPA treatment. Cytoplasmic pErk1/2, but not PEA-15, was increased by TPA treatment. (E) Immunocytochemistry; No nuclear translocation of PEA-15 in old cells treated with TPA for 30 min.
- 12 -
B. Knockdown of PEA-15 expression induced pErk1/2 translocation to nuclei
To further explore the role of PEA-15 in the pErk1/2 translocation, PEA-15 phosphorylation at S104 and S116 residues was examined. TPA treatment induced PEA-15 phosphorylation at S104 in
both young and old cells, whereas insulin and EGF induced PEA-15 phosphorylation at S116
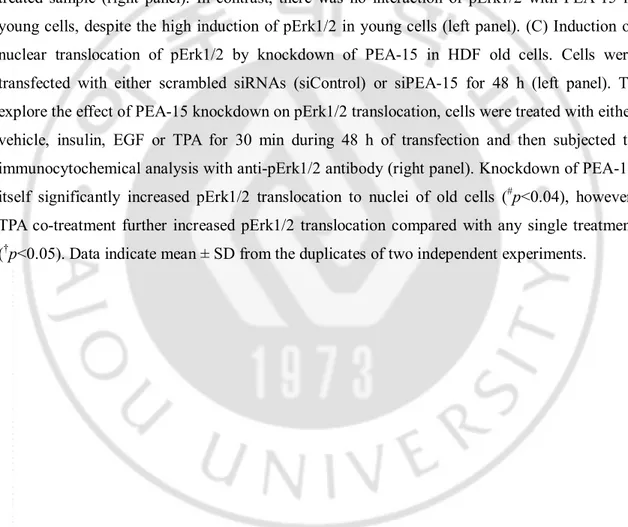
along with Akt activation (Fig. 3A). Despite increased pErk1/2 expression in HDF old cells (shown in Fig. 3B, 10% input data), IP-immunoblot analysis revealed that TPA treatment reduced the interaction of PEA-15 with pErk1/2 about 50% in the old cells compared with that of the vehicle treatment, whereas there was almost no interaction in the young cells (Fig. 3B). Moreover, knockdown of PEA-15 by siPEA-15 transfection (Fig. 3C, left panel) significantly induced pErk1/2 translocation, regardless of insulin or EGF co-treatment (Fig. 3C, right panel, #p<0.04). However, TPA co-treatment further increased the effect of siPEA-15 transfection compared with other treatments (†p<0.05), suggesting dissociation of pErk1/2 from PEA-15 by phosphorylating S104 residue and knockdown of PEA-15 induced nuclear translocation of
- 14 -
Fig. 3. Knockdown of PEA-15 induced nuclear translocation of pErk1/2. (A) TPA induced phosphorylation of PEA-15 at S104 residue. When cells were treated with either vehicle, insulin,
EGF or TPA for 30 min, TPA induced phosphorylation of PEA-15 at S104 in both young and old
cells, whereas insulin and EGF induced phosphorylation of PEA-15 at S116 and Akt at S473
residues. (B) Immunoprecipitation and immunoblot analyses. Treatment of old cells with TPA significantly reduced PEA-15 bound to pErk1/2 compared with the vehicle treatment (0.5 in the TPA vs. 1.0 in the vehicle), despite the presence of much higher amount of pErk1/2 in the TPA-treated sample (right panel). In contrast, there was no interaction of pErk1/2 with PEA-15 in young cells, despite the high induction of pErk1/2 in young cells (left panel). (C) Induction of nuclear translocation of pErk1/2 by knockdown of PEA-15 in HDF old cells. Cells were transfected with either scrambled siRNAs (siControl) or siPEA-15 for 48 h (left panel). To explore the effect of PEA-15 knockdown on pErk1/2 translocation, cells were treated with either vehicle, insulin, EGF or TPA for 30 min during 48 h of transfection and then subjected to immunocytochemical analysis with anti-pErk1/2 antibody (right panel). Knockdown of PEA-15 itself significantly increased pErk1/2 translocation to nuclei of old cells (#p<0.04), however,
TPA co-treatment further increased pErk1/2 translocation compared with any single treatment (†p<0.05). Data indicate mean ± SD from the duplicates of two independent experiments.
- 15 -
C. Knockdown of PEA-15 and TPA treatment reduced senescence phenotype. Nuclear translocation of pErk1/2 by either siPEA-15 or TPA treatment was accompanied with significant reductions of senescence markers in HDF old cells; Over 10% decrease of SA-β-gal activity (Figs. 4A and 4C), and 50% decrease of p53 and p21WAF1 expressions (Figs. 4B and 4D).
Furthermore, treatment of old cells with either siPEA-15 (Fig. 4E) or TPA (Fig. 4F) significantly reduced senescence markers such as PML body formation, and expressions of 53BP1 and H3K9me2, as opposed to no response in young cells. Taken together, siPEA-15 transfection or TPA treatment significantly reduced heterochromatin changes and inactive histone methylations in senescent cells, reversing senescence phenotypes along with nuclear translocation of pErk1/2.
- 17 -
Fig. 4. Reversal of senescence phenotypes by either knockdown of PEA-15 or TPA treatment. (A) Significant inhibition of SA-β-gal activity by transfection of siPEA-15 for 48 h. Knockdown of PEA-15 in HDF old cells significantly inhibited SA-β-gal activity in total 800 cells in randomly chosen field. Data indicate percentage of total cells (means ± SD) after 3 independent experiments. (B) HDF old cells transfected with indicated siRNAs were harvested, and expressions of p53 and p21WAF1 were measured by immunoblot analysis. Densitometric
analysis of band intensity was performed by image J software. Targeted bands were normalized to the expression of α-tubulin. Note significant inhibition of p53 and p21WAF1 expressions by
transfection with siPEA-15. (C) To evaluate the effect of TPA on SA-β-gal activity, HDF old cells were treated with TPA for 48 h, and the activity was assayed along with its quantification. The activity was also significantly reduced 24 h after TPA treatment. (D) Under the same condition, cells were harvested and immunoblotted with anti-p53 and anti-p21WAF1 antibodies.
Targeted bands were normalized to the expression of α-tubulin. Note significant reductions of p53 and p21WAF1 expression after TPA treatment. Data are presented as means ± SD after 3
independent experiments. (E) Chromatin changes of HDF old cells in response to knockdown of PEA-15 by transfection with siPEA-15, and examined by immunocytochemistry before Image J software quantification. Markers of senescence were all significantly reduced by knockdown of PEA-15 expression as compared with the siControl transfection. (F) Treatment of old cells with TPA for 48 h significantly reduced the average size of PML bodies, number of 53BP1 foci and fluorescence intensity of H3K9me2 obtained from at least 500 nuclei in each group compared with the untreated control. The above data showed the reversal of senescence phenotype, whereas there was no significant difference in HDF young cells after TPA treatment.
- 18 -
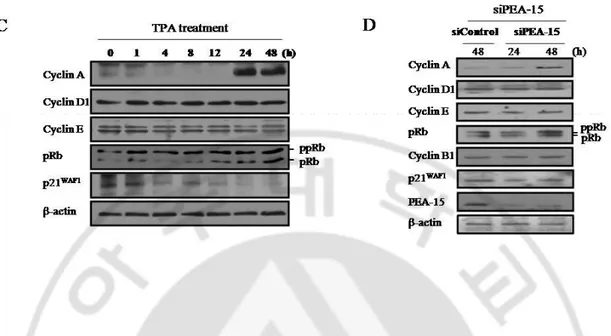
D. Progression of G1/S phase by either TPA or siPEA-15 transfection. To elucidate cell cycle progression upon pErk1/2 translocation, senescent cells were treated with either TPA or siPEA-15 transfection. Both BrdU incorporation (Fig. 5A) and FACS analysis (Fig. 5B) revealed significantly increased BrdU positive cells entering into S-phase in the senescent cells compared with the control. The phenomena were further evidenced by immunoblot analyses; Both TPA treatment (Fig. 5C) and siPEA-15 transfection (Fig. 5D) significantly induced the loss of p21WAF1 expression and pRb phosphorylation along with cyclin A synthesis. Above data strongly support that nuclear translocation of pErk1/2 apart from PEA-15 triggers the reversal of senescence phenotype.
- 19 -
Fig. 5. Progression of G1 to S phase by either TPA treatment or knockdown of PEA-15 in HDF senescent cells. (A) Immunocytochemistry with anti-BrdU antibody. Senescent cells were pre-labelled with 10 μM BrdU for 2 h and fixed in 4% paraformaldehyde solution for 15 min before incubation in 2 M HCl for 30 min, and then pH was restored to 8.5 with 0.1 M sodium borate for 2 min. The steps were followed by using anti-BrdU FITC-labeled antibody. Note less BrdU positive in the mid-old cells than young cells, whereas it was significantly increased by either TPA treatment or siPEA-15 transfection. (B) Cell cycle analysis by FACS. To further confirm the above data, flow cytometry analysis was performed. Note significant induction of S phase cells by treatment with TPA and siPEA-15 transfection. To further confirm the escape of G1 arrest at molecule levels, senescent cells treated with either TPA (C) or siPEA-15 transfection (D) were subjected to immunoblot analysis. Note significant increase of cyclin A and pRb phosphorylation by TPA treatment and by siPEA-15 transfection in 24 and 48 h, respectively, indicating the cell cycle progression from G1 arrest to S phase along with reduction of p21WAF1 expression. The reason why there was no change of cyclin D1 and cyclin E expression until 48 h might be due to long doubling time of the mid-old cells (over 7 days).
- 20 -
E. Increase of cell proliferation by either knockdown of PEA-15 or TPA treatment. To examine whether senescent cells accelerate cell division cycle or not in response to knockdown of PEA-15 or TPA treatment, HDF mid-old cells were transfected with either siRNAs against PEA-15 or siControl, along with TPA treatment as the control. As shown in Fig. 6A and B, the senescent cells transfected with siPEA-15 showed significant increase of cell proliferation in 2 days as compared with the siControl transfected cells (P=0.04), and the difference was more significant in 4 days after the transfection (Fig. 6A, P=0.002). At the same time, treatment of HDF mid-old cells with TPA exhibited much more significant cell proliferation than that of the DMSO treated cells (Fig. 6B, P=0.017 in 2 days and P<0.0001 in 4 days), HDF young cells actively proliferated every day until 4 days (data not shown), indicating the reversal of senescence phenotype along with active cell proliferation.
- 21 -
Fig. 6. Increase of cell proliferation by either knockdown of PEA-15 or TPA treatment. (A) To determine the change of cell proliferation by knockdown of PEA-15 or TPA treatment, 1x10⁵ HDF mid-old cells (doubling time 6-7 d) were transfected with either 40 nM siPEA-15 or
siControl for 4 h, and then the cells were harvested at the indicated times. Transfection of senescent cells with siPEA-15 revealed significant increase of cell proliferation in 2 days as compared with the siControl transfected cells (P=0.04), and the difference became larger in 4 days after the transfection (P=0.002). (B) Treatment of HDF mid-old cells with TPA exhibited
- 22 -
significant cell proliferation much more than that of the DMSO treated cells in 2 days (P=0.017) and the difference was also larger in 4 days (P<0.0001).
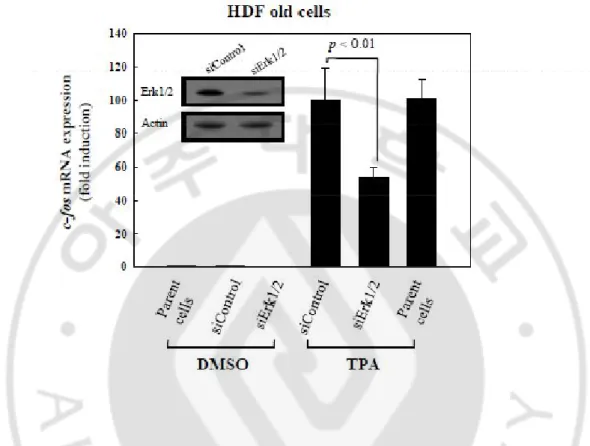
F. Regulation of TPA-induced c-fos expression by nuclear Erk1/2 in HDF old cells. In the above experiment, we showed active cell proliferation in senescent cells after knockdown of PEA-15 and TPA treatment, indicating the presence of further signal to stimulate cell proliferation after escape from G1 arrest to S phase. Therefore, the effect of pErk1/2 on the regulation of cell proliferation was evaluated by knockdown of Erk1/2 expression in HDF old cells. Transfection of HDF old cells with siRNAs to Erk1/2 (siErk1/2) for 48 h significantly inhibited TPA-induced c-fos expression compared with that of the siControl transfected cells, when examined by real-time RT-PCR analysis (p<0.01, Fig.7). DMSO (vehicle) treatment and parent cells were used as the controls for TPA treatment and the siErk1/2 transfection assay. Inset shows immunoblot analysis of HDF old cells after transfection with siControl and siErk1/2 RNAs. The data strongly suggest the role of pErk1/2 translocation to nuclei by either knockdown of PEA-15 or TPA treatment in the proliferation of senescent cells.
- 23 -
Fig. 7. Regulation of TPA-induced c-fos expression by nuclear Erk1/2 in HDF old cells. To explore whether pErk1/2 translocated to nuclei has any effect on cell proliferation, HDF old cells were transfected with either siRNA to Erk1/2 (siErk1/2) or scrambled siRNAs (siControl) for 48 h, and then treated with either DMSO (vehicle) or TPA for 30 min before subjected to real-time RT-PCR analysis. Degree of c-fos expressions was normalized based on the level of β-actin expression. Note that c-fos expression was markedly increased in the parent cells and the siControl transfected cells in response to TPA treatment, whereas the expression was significantly reduced by knockdown of Erk1/2 (p<0.01). Data represents mean ± SD of 3 independent experiments. Inset shows immunoblot analysis of HDF old cells after transfection with siControl and siErk1/2 RNAs.
- 24 -
IV. Discussion
Replicative senescence exhibits two characteristic phenomena, predominant retention of Erk1/2 in cytoplasm (SA-Erk1/2) and nuclear accumulation of G-actin, which represent translocational inefficiency of intracellular proteins (Lim et al., 2000; Lim et al., 2001). However, the characteristic morphology of replicative senescence can be reversed by TPA, when monitored by actin cytoskeleton staining (Kwak et al., 2004). We described herein that knockdown of PEA-15 reversed senescence phenotypes along with pErk1/2 translocation from cytoplasm to nucleus, and that TPA treatment dissociated SA-pErk1/2 from PEA-15 via induction of PEA-15 S104 phosphorylation in old cells (Figs. 2 and 3). siPEA-15 itself
significantly increased pErk1/2 translocation to nuclei (Fig. 3C), and TPA further increased the translocation. The findings are well accordant with eariler studies that PEA-15 anchors Erk1/2 in cytoplasm (Formstecher et al., 2001) and PEA-15S104 can be phosphorylated by PKC (Kubes
et al., 1998), and are further supported by the study that downregulation of PEA-15 expression by oncogene E1A restores pErk1/2 in nuclei which avert murine embryo fibroblasts from senescence (Gaumont-Leclerc et al., 2004). Although insulin and EGF induce mitogenic and metabolic effects by regulating pErk1/2 in most cell types (Boulton et al., 1991; Wilson et al.,1994), senescent cells in the present study showed altered response to mitogens; e.g. failure of pErk1/2 translocation from cytoplasm to nuclei by insulin and EGF, but not TPA, stimulation. It is highly possible that the failure might be due to the phosphorylation of PEA-15 at S106 by
pAkt (Trencia et al., 2003), because there is no difference in the expression of PEA-15 between young and old cells, despite more interaction of pErk1/2 with PEA-15 (Fig. 2A) and the TPA-induced dissociation of PEA-15 from pErk1/2 in the old cells (Fig. 3B). Therefore, cytoplasmic sequestration of pErk1/2 by PEA-15 appears to be an important mechanism to maintain cellular senescence and resistance to mitogenic signals in senescent cells.
A recent study described nuclear translocation of pErk1/2 by hBVR (Lerner-Marmarosh et al., 2008), however, we were unable to observe in vivo interaction as well as any correlation between nuclear translocation of pErk1/2 and hBVR upon TPA treatment (data not shown). Three other mechanisms have also been suggested to regulate nuclear import of pErk1/2; passive diffusion of a monomer, active transport of a pErk2 dimer (Khokhlatchev et al., 1998; Adachi et al., 1999) and direct interaction with nuclear pore complex independent of
- 25 -
phosphorylation, energy, and transport factors (Matsubayashi et al., 2001).
When senescent cells were treated once with TPA or with siPEA-15, senescence markers of heterochromatin foci such as PML body and 53BP1 expression were significantly reduced along with histone modification (Fig. 4), whereas there was no change in the HDF young cells after TPA treatment (data not shown). Moreover, cell cycle progression from G1 arrest to S phase, increased pRb phosphorylation with cyclin A synthesis, and reduction of p21WAF1 expression
(Figs. 5C and 5D) strongly supported the reversal of senescence phenotype by the knockdown of PEA-15 expression and TPA treatment via pErk1/2 translocation to nuclei. TPA has been known as the most potent tumor promoter and PKC activator which leads to proliferation of initiated (transformed) cells under carcinogenesis. To accomplish the reversal of senescence phenotype, the cells require further stimulation for cell proliferation. Knockdown of SA-pErk1/2 by transfection of siErk1/2 significantly reduced TPA-stimulated c-fos expression in the HDF old cells (Fig. 7), implicating that induction of nuclear translocation of pErk1/2 by knockdown of PEA-15 may regulate the expression of transcription factors which stimulate cell proliferation in the senescent cells. Indeed, transfection of HDF mid-old cells with siPEA-15 RNA (Fig. 6A) as well as the treatment of the cells with TPA (Fig. 6B) significantly increased cell proliferation in 2 days after transfection. Furthermore, our previous finding that knockdown of PKCa increased proliferation of senescent cells (Kim et al., 2009) also strongly support that TPA treatment overcomes growth arrest of HDF senescent cells. In summary, therefore, translocation of pErk1/2 to nuclei of senescent cells induces further stimulation of cell proliferation, and we suggest the nuclear translocation of SA-pErk1/2 apart from PEA-15 as an important mechanism to reverse senescence phenotype.
- 26 -
V. Conclusion
In the present study, we explored a molecular mechanism involved in the reversal of senescence phenotypes, and found that the event is regulated by PEA-15 (phosphoprotein enriched in astrocytes) which tethers cytoplasmic pErk1/2. In the study, we used TPA as the control agent which is known to induce the reversal of senescence morphology to young cell-like through inhibition of interaction between PEA-15 and pErk1/2.
- 27 -
Part. Ι. B
Regulations of reversal of senescence by PKC isozymes in response to
12-O-tetradecanoylphorbol-13-acetate via nuclear translocation of
pErk1/2
I. INTRODUCTION
Cellular senescence has been known as a process of permanent growth arrest when cells lose ability to activate cell division cycle. Hayflick and Moorhead described in detail about the limited proliferative capacity of normal cells and postulated that senescence is an in vitro manifestation of human aging (Hayflick and Moorhead., 1961). It has been also reported that failure of senescence induction in epithelial cells significantly increases carcinogenic progression in both human and animals. Therefore, benign prostate hyperplasia, lung adenoma, intraductal neoplasia of pancreas and skin papilloma etc., can be successfully protected against cancer progression by oncogene-induced senescence (Vernier et al., 2011; Collado et al., 2005), thus cellular senescence playing an important role as a barrier of cancer progression. One of the characteristic features of senescent cells has been shown to be cytoplasmic sequestration of senescence-associated pErk1/2 (SA-pErk1/2) as opposed to the G-actin accumulation in nuclei of senescent cells (Lim et al., 2000). Potential mechanisms of the failure of nuclear translocation of pErk1/2 in response to growth factor stimulation has been in part due to inactivation of protein phosphatases 1 and 2A, and MKP3/DUSP6 by accumulated ROS in senescent human diploid fibroblasts (Kim et al., 2003). On the other hand, failure of G-actin export from nuclei of senescent cells occurs due to cofilin activation as opposed to LIMK inactivation, resulting in the altered F-actin polymerization in the senescent cells (Lim et al., 2000; Kwak et al., 2004). However, when the senescent cells are treated with 12-O-tetradecanoylphorbol-13-acetate (TPA), the morphology of old cells changed to young cell-like along with reversal of senescence markers, such as BrdU incorporation, pRB hyperphosphorylation, reduced expressions of p53
- 28 -
and p21WAF1, senescence-associated heterochromatin foci, H3K9me2 and SA-b-galactosidase
activity, which lead to G1/S progression and cell proliferation (Lee et al., 2015; Kwak et al., 2004; Kim et al., 2009). Treatment of senescent cells with TPA rapidly dissociates SA-pErk1/2 from phosphoprotein enriched in astrocyte-15 (PEA-15) and induces nuclear translocation of pErk1/2 (Lee et al.,2015). Not only TPA treatment but also knockdown of PKCa expression by RNA interference significantly induces proliferation of human diploid fibroblast (HDF) old cells (Kim et al., 2009). All of the findings strongly implicate a direct role of PKCa in the reversal of senescence phenotypes. Indeed, it has been reported that PKCa is a mediator of G2/M arrest and cellular senescence via inducing p21WAF1 in the asynchronously growing NSCLC (Oliva et
al., 2008). Considering that TPA downregulates PKC isozymes after initial activation (Bilezikjian et al., 1987; Lu et al., 1998), the above mentioned findings strongly suggest that downregulation of PKCa might regulate the reversal of senescence in the primary culture of HDF cells. To the best of our knowledge, however, there is no report that TPA reverses senescence phenotypes by knockdown of PKC isozymes in both cells and animal models. In addition, we investigated possible similarities in the gene expression profiles regulated by TPA-induced PKCa downregulation and a carcinogenic process.
PKC, a serine/threonine kinase, is divided into four subfamilies according to the cofactor requirements; conventional PKCs (PKCα, PKCβ1, PKCβ2, and PKCγ), novel PKCs (PKCδ, PKCε, PKCθ and PKCη), atypical PKCs (PKCζ, PKCι) and distant PKCs such as PKCμ/PKD, PKCν (Clemens et al., 1992; Dekker and Parker., 1994; Nishizuka et al., 1995). Traditionally, PKC has been known as the high affinity intracellular receptor of phorbol esters, a class of potent tumor promoters (Ashendel et al., 1985). The direct activation of PKC by phorbol esters indicates that PKC is critically involved in growth control, thus it is widely accepted that PKC plays a pivotal role in the regulation of proliferation and differentiation (Clemens et al., 1992; Nishizuka et al, 1992). Phorbol esters activate PKCs longer than physiological regulators: prolonged vs. transient activation of PKCs is an important distinction that may form the basis for tumor-promoting activity of phorbol esters (Jaken et al., 1990; Bell and Burns., 1991; Nishizuka et al., 1992) (Fig. 8).
- 29 -
Fig. 8. Domain structures of protein kinase C (PKC) isoforms. PKCs have a conserved kinase domain and more variable regulatory domains. All PKC regulatory domains contain a pseudosubstrate motif (PS) NH2 terminal to the C1 domain (shown in pink). Tandem C1 domain
functions are sensor of 12-O-tetradecanoylphorbol-13-acetate (TPA)/ diacylglycerol (DAG) in both cPKC and nPKC isoforms, whereas the single of aPKC C1 domain does not response to DAG/PMA. The C2 domains (in yellow) function as calcium-dependent phospholipid binding modules in cPKCs. nPKC C2 domains do not bind calcium; the PKCδ-C2-like domain is a phosphotyrosine interaction module. PKC isoform variable regions are shown in gray
PKCα is activated by a variety of stimuli originating from receptor activation, cell contact and physical stresses. Upon stimulation, PKCα translocates from cytosol to particulate fractions, nucleus being one of the major compartments (Buchner et al., 1995). We have observed that stimulation of HDF cells with TPA activates PKCa, PKCb1 and PKCh (Kim et al., 2009), consequently the isozymes moving from cytosol to particulate fractions in both young and old HDF cells. This suggested that PKC might be one of the important factors in the regulation of senescence phenotypes. However, the exact mechanism of nuclear translocation of PKC isozymes has not yet been reported; PKCα and other PKC isozymes do not contain nuclear localization signal (NLS) sequences, and are independent of the components for NLS-dependent transport such as importin and Ran/GTPase (Schmalz et al., 1998).
The activity of PKCα is higher in senescent cells than in the young cells due to accumulated ROS, which stimulates SA-pErk1/2 and enhances p21WAF1 transcription after Sp1
- 30 -
phosphorylation on S59residue and maintains senescence (Kim et al., 2009). In addition, treatment of HepG2 cells with TPA signals PKCα activation along with Erk1/2 signaling and growth inhibition (Wen-Sheng and Jun-Ming., 2005), implying that all the factors regulating MAPK pathway are involved in the activation of PKCα in response to TPA (Thomas et al., 1992; Alexandropoulos et al., 1993; Tobin et al., 1996; Ueda et al., 1996; Ho et al., 1998; Wen-Sheng., 2006). To accomplish the effect, the signals have to reach nucleus after activation. Buchner (Buchner et al., 1995) suggested several possibilities of PKC-mediated signal transduction into nucleus; Cytoplasmic PKC signals transmitted to nuclei through the activation of Raf-MEK-MAPK pathway, degradation of IkB-a along with p50/p65 translocation to nucleus, and just JAK-STAT activation signals in response to a ligand stimulation. On the other hand, signal transduction to nucleus might be accomplished by nuclear translocation of PKC itself via nuclear pore complex after activation in the cytoplasm. In addition, it has been pointed out that phorbol esters stimulate Erk1 via protein-tyrosine/threonine kinase activation (Alessandrini et al., 1992).
MAPK pathway regulates various cellular functions including cell proliferation, differentiation, migration, and apoptosis (Chang and Karin., 2001; Pearson et al., 2001), and the terminal elements of this pathway, ERK1 and ERK2, activate transcription factors (e.g. c-fos, Elk-1) in nucleus upon phosphorylation (Cruzalegui et al., 1999) (Fig. 9).
- 31 -
Fig. 9. MAPK signaling pathway. Mitogen-activated protein kinase (MAPK) proteins are
serine/ threonine specific kinases which are activated by a wide range of stimuli including growth factors, mitogens, osmotic stress, etc. These proteins function in a signaling cascade are activated upon ligand binding to a cell surface receptor activating several kinases, which in turn phosphorylate their respective substrates. Upon the extracellular growth factor binding to the ligand, Ras a GTPase exchanges GDP for GTP. This in turn initializes a cascade activating MAP3K (Raf) which in turn activates MAP2K (MEK1/2) which activates MAPK (Erk1/2). MAPK regulates a number of transcription factors including c-Jun, ELK-1, c-fos etc. These events thereby regulate various cellular activities, such as gene expression, mitosis, differentiation, proliferation, and cell survival/apoptosis.
Erk1/2 has, therefore, been to be translocated from cytoplasm to nucleus to activate downstream transcription factors in response to various stimuli, and a significant fraction (> 50%) of Erk1/2 can be found in the nucleus within 10 minutes after stimulation with growth factor and phorbol ester (Chen et al., 1992). The redistribution of Erk1/2 is regulated by its
- 32 -
interaction with proteins such as β-arrestin, calponin, mitogen activated protein kinase kinase (MEK), and PEA-15 (Menice et al., 1997; Camps et al., 1998). PEA-15 can directly bind to Erk1/2 or pErk1/2 in vitro or in vivo (Araujo et al., 1993). In this regard, therefore, PEA-15 indirectly contributes to maintenance of cellular senescence, and its phosphorylation at S104 by
protein kinase C blocks its interaction with ERK both in vivo and in vitro (Krueger et al., 2005; Renganathan et al., 2005; Vaidyanathan et al., 2007). The above findings prompted us to explore how PKC isozymes and Erk1/2 interact in tumor promotion and reversal of senescence process by TPA stimulation, and how the kinetics of PKC degradation change in the early and late stages of reverse senescence in response to TPA, focusing on the differential activities of PKCa and PKCb1 in the translocation; PKCb1 was active to dissociate SA-pErk1/2 tethered to PEA-15, and PKCα was a carrier of pErk1/2 in senescent cells. MAPK docking motif and the kinase activity of PKCα were both necessary to transfer SA-pErk1/2 to nuclei of senescent cells. PKCa degradation in nuclei by ubiquitination occurred much earlier than inactivation of pErk1/2, and developed cell proliferation not only in the senescent cells but also in the DMBA-TPA mediated skin carcinogenesis in CD-1 mice, implying that promotion of carcinogenesis undergoes molecular changes similar to those in the reversal of senescence upon TPA stimulation.
- 33 -
Purpose of this study
We have already reported the characteristic phenotypes of cellular senescence; e.g. the cytoplasmic sequestration of pErk1/2 (SA-pErk1/2) in contrast to the nuclear accumulation of G-actin cytoskeleton for the first time by using primary culture of human diploid fibroblasts. Since that, we were studying the biochemical mechanisms of contrast phenotypes related with cancer and ageing development. As a result, we could identify the roles of ROS and protein kinase C along with pErk1/2 and Sp1, in addition to inactivation of protein phosphatases which can regulate cellular senescence. Moreover, we have demonstrated that senescent cells can be reversed to young cells both in the cell shape, molecular markers, and cell cycle progression (G1 to S phase) along with actin rearrangement upon TPA treatment to old cells. Therefore,
we
have investigated the
mechanism of reverse senescence focused on the nuclear translocation of SA-pErk1/2 by PKC isozymes in response to TPA treatment to old HDF cells and physiological effects of in vivo DMBA/TPA skin carcinogenesis model.- 34 -
II. MATERIALS AND METHODS
A. MATERIALS
TPA and 7, 12-dimethylbenz[a]anthracene were purchased from Sigma (St. Louis, MO, USA). Antibodies to pErk1/2, Erk1/2, PEA-15pS104 and PEA-15 were from Cell Signaling (Danvers,
MA, USA); against PKCβ1, lamin B1, HA, ubiquitin (Ub) and α-tubulin were from Santa Cruz Biotechnology (Santa Cruz, CA, USA); against PKCα from Novus Biologicals (Littleton, CO, USA). Active forms of PKCα and PKCβ1, and PKC activators were purchased from Millipore (Billerica, MA, USA).
B. METHODS
1. Cells culture
HDF cells were isolated in our laboratory from the foreskin of a 4 year-old boy (Lim et al., 2000; Kwak et al., 2004) and the primary culture was maintained in Dulbecco’s modified Eagle’s medium (DMEM, Invitrogen/GIBCO, Grand Island, NY, USA) supplemented with 10% fetal bovine serum (FBS; Invitrogen). Number of population doublings and their doubling times were calculated by the published equations (Kim et al., 2009). HDF young cells used in this study represent doubling time of around 26 h, the mid-old and the old cells indicate doubling times of around 4–10 days and over 14 days, respectively. Huh7 cells were cultured in DMEM supplemented with 10% FBS. All cells used in this study were maintained in 5% CO2 incubator
at 37 °C.
2. Immunoblot (IB) analysis
Cells were solubilized in RIPA buffer [50 mM Tris/HCl (pH 7.5), 150 mM NaCl, 1.0% Nonidet P40, 0.1% SDS, 0.5% deoxycholic acid, 1.0 μg/ml leupeptin, 100 μg/ml PMSF, 1.0 mM Na3VO4, 1.0 mM NaF], cleared by centrifugation at 12,000 g for 10 min at 4°C, and then 40 μg of the lysates (per lane) were resolved on 10-15% SDS-PAGE in 25 mM Tris/glycine buffer. The gel-resolved protein bands were transferred to Polyvinylidene fluoride membrane and then treated with 5% non-fat skim milk in PBS containing 0.05% Tween 20 (PBST) for 1 h before incubation with the targeted antibodies overnight at 4 °C. The polyvinylidene fluoride membranes were washed three times with PBST and then incubated with horseradish
- 35 -
peroxidase-conjugated secondary antibodies for 1 h. ECL (Amersham Biosciences, Little Chalfont, UK) kit was employed to visualize protein expression levels.
3. Immunoprecipitation (IP)
Immunoprecipitation was performed with cell lysates (~1.0 mg protein) isolated from the young, old and mid-old HDF cells in the modified RIPA buffer (without 0.1% SDS from RIPA) by the standard method. Whole cell lysates were pre-cleared with protein G-agarose beads (Invitrogen) for 1 h at 4 °C before precipitation for 4 h with targeted primary antibodies at 4 °C. The immunoprecipitates were washed 5 times with IP buffer, and then subjected to immunoblot analysis with appropriate antibodies.
4. Cells fractionation
Cells were harvested, washed with ice cold 1x PBS, and then lysed in 250 μl of TD buffer [25 mM Tris base (pH 8.0), 2.0 mM MgCl2, 0.25% v/v Nonident P40, 0.5 mM DTT, 1.0 μg/ml leupeptin, 100 μg/ml PMSF, 1.0 mM Na3VO4, 1.0 mM NaF] for 5 min at room temperature (RT). The lysates were centrifuged at 12,000 g for 5 min and the supernatant was collected as cytoplasmic fraction. The pellets were suspended in 125 μl of BL buffer [10 mM Tris (pH 8.0), 0.4 M LiCl, 0.5 mM DTT, 1.0 μg/ml leupeptin, 100 μg/ml PMSF, 1.0 mM Na3VO4, 1.0 mM NaF] for 5 min along with vigorous vortex for few seconds, followed by centrifugation at 12,000 g for 20 min to remove cell debris, and used as nuclear fraction. Protein concentration of each sample was assessed by BioRad protein assay kit (Hercules, CA, USA) and analyzed by IB assay.
5. Immunocytochemistry (ICC)
Cells were cultured on cover slips (18 mm x 18 mm) using 6-well plates, washed twice with 1xPBS before fixation with 4% paraformaldehyde for 15 min, permeabilized with 0.05% Triton X-100 (diluted in 1x PBS) for 15 min, and then subjected to blocking with 3% bovine serum albumin (BSA) in 0.05% Triton X-100 at 4 °C for 2 h. The cells were incubated overnight with primary antibody at 4 °C, with secondary antibody at 4 °C for 2 h, and then stained with 4% 6-diamidino-2-phenylindole (DAPI, 1.0 μg/ml) for 5 min at RT before mounting with Mowiol medium (Hoeschst Celanese, Charlotte, NC, USA) containing antifade 1,4-diazabicyclo[2,2,2]octane (Aldrich, Milwaukee, WI, USA). Expressions of pErk1/2, PKC , PKC mutants, PKCb1 and ubiquitin (Ub) were detected using monoclonal or polyclonal
- 36 -
primary antibodies along with Alexa 488 or Alexa 594 conjugated goat-anti mouse or rabbit IgG as a secondary antibody. Data were visualized with fluorescence microscope and photographed by AxioVision image acquisition with analysis software package (Carl Zeiss MicroImaging GmbH, Jena, Germany) or Images were analyzed using an Eclipse Ti (Nikon, Japan) or an A1 confocal microscope (Nikon, Japan).
6. Two stage skin carcinogenesis
CD-1 male mice (7 week old) were purchased from ORIENT BIO Inc (Seoul, Korea) and acclimatized in the animal house of Ajou University animal facilities for 3 weeks before shaving the hair on the back skin with electric shaver at 1 day before experiment. TPA (5 mg/200 ml acetone) was topically applied on the back skin of the mice for 2 weeks (twice/week) with or without DMBA (100 mg/200 ml acetone) initiation at 1 week before TPA treatment. Mice were sacrificed on 3 days of the TPA final treatment, and then the back skin was surgically removed, spread on dry ice and embedded in the O.C.T. compound (Sakura Finetek, Torrance, CA, USA) for frozen section or fixed in 10% formalin solution for paraffin embedding. Paraffin embedded sections were cut (4 mm thickness) and mounted on microslides and processed for hematoxylin– eosin (H&E) staining according to the described metheod (Devanand et al., 2014).
7. Immunofluorescence (IF) study
Frozen sections (10 μm thickness) fixed at RT for 15 min were incubated in 0.3% H2O2 in PBS for 10 minto block endogenous peroxidase activity, and then incubated in 0.05% Triton X-100 containing 10% BSA for 40 min at RT before washing 3 times with 1xPBS. The other procedures were followed according to the described method in the immunocytochemistry method. PKC was detected using monoclonal antibody along with Alexa 488 conjugated goat-anti mouse IgG as a secondary goat-antibody.
8. GST-pull down and in vitro kinase-immunoblot analyses
Recombinant GST-PEA15 proteins were expressed in E.coli strain BL21 (DE3) and purified to homogeneity using glutathione agarose 4B beads (Incospharm, Daejeon, Korea). The GST- or GST-PEA15-conjugated glutathione agarose 4B beads were washed twice with kinase buffer [50 mM HEPES, (pH 7.5), 10 mM MgCl2, 1 mM DTT, 2.5 mM EGTA, protease inhibitors and
phosphatase inhibitors], and then in vitro kinase assay was initiated with 100 ~200 ng of GST-PEA-15, 400 µM ATP and 0.1 µg each of either active PKCα or PKCβ1 (Millipore, MA, USA) enzyme in 10 µl of the buffer. The mixtures were incubated at 30 °C for 30 min until