Imaging Mass Spectrometry in Papillary Thyroid Carcinoma for
the Identification and Validation of Biomarker Proteins
Direct tissue imaging mass spectrometry (IMS) by matrix-assisted laser desorption ionization and time-of-flight (MALDI-TOF) mass spectrometry has become increasingly important in biology and medicine, because this technology can detect the relative abundance and spatial distribution of interesting proteins in tissues. Five thyroid cancer samples, along with normal tissue, were sliced and transferred onto conductive glass slides. After laser scanning by MALDI-TOF equipped with a smart beam laser, images were created for individual masses and proteins were classified at 200-μm spatial resolution. Based on the spatial distribution, region-specific proteins on a tumor lesion could be identified by protein extraction from tumor tissue and analysis using liquid chromatography with tandem mass spectrometry (LC-MS/MS). Using all the spectral data at each spot, various intensities of a specific peak were detected in the tumor and normal regions of the thyroid. Differences in the molecular weights of expressed proteins between tumor and normal regions were analyzed using unsupervised and supervised clustering. To verify the presence of discovered proteins through IMS, we identified ribosomal protein P2, which is specific for cancer. We have demonstrated the feasibility of IMS as a useful tool for the analysis of tissue sections, and identified the tumor-specific protein ribosomal protein P2.
Keywords: Pathology; Proteins; Spectrometry, Mass, Matrix-Assisted Laser Desorption-Ionization; Thyroid Gland; Neoplasms
Kyueng-Whan Min,1* Joo-Young Bang,2,3*
Kwang Pyo Kim,2,3 Wan-Seop Kim,1,4
Sang Hwa Lee,1 Selina Rahman Shanta,2
Jeong Hwa Lee,2 Ji Hye Hong,2
So Dug Lim,1 Young-Bum Yoo,5
and Chan-Hyun Na2
1Department of Pathology, Konkuk University School
of Medicine, Seoul; 2Department of Molecular
Biotechnology, WCU Program, Konkuk University, Seoul; 3SMART Institute of Advanced Biomedical
Science, Konkuk University, Seoul; 4The Research
Institute of Medical Science, Konkuk University School of Medicine, Seoul; 5Department of Surgery,
Konkuk University School of Medicine, Seoul, Korea *Kyueng-Whan Min and Joo-Young Bang contributed equally to this work. Received: 10 March 2014 Accepted: 24 April 2014 Address for Correspondence: Wan-Seop Kim, MD
Department of Pathology, Konkuk University School of Medicine, 120-1 Neungdong-ro, Gwangjin-gu, Seoul 143-729, Korea Tel: +82.2-2030-5642, Fax: +82.2-2030-5629 E-mail: [email protected]
Funding: The research was supported by grants from the
National Research Foundation of Korea (Grant No., 2009-0072346) and the Converging Research Center Program (2011K000898) through the Ministry of Education, Science and Technology, Korea.
http://dx.doi.org/10.3346/jkms.2014.29.7.934 • J Korean Med Sci 2014; 29: 934-940
INTRODUCTION
Papillary thyroid carcinomas (PTC) are the most common form of thyroid cancer, accounting for nearly 85% of primary thyroid malignancies. Commonly, the solitary nodule is a palpably dis-crete swelling within an otherwise apparently normal thyroid gland, and is incidentally detected by radiological evaluation (1). From a clinical standpoint, the possibility of neoplastic dis-ease is a major cause for concern in patients who present with thyroid nodules, because most conventional papillary carcino-mas present as asymptomatic thyroid nodules. Recent studies have demonstrated 2 molecular mechanisms that function in the carcinogenesis of thyroid cancer: the mitogen-activated protein kinase (MAPK) and phosphatidylinositol-3-kinase (PI3K)/Akt pathways (2, 3). Additionally, such pathways are re-lated to genetic alterations such as rearrangements in the “rear-ranged during transfection” (RET) or neurotrophic tyrosine
ki-nase receptor 1 (NTRK1) genes, and the activation of point mu-tations in the BRAF gene (4). In a previous study, protein ex-pression patterns according to genetic variables have been demonstrated to correlate with the microscopic features, clini-cal manifestations, and prognostic characteristics of PTC (5). Although various protein alterations have been detected as di-agnostic markers or prognostic predictors, the challenge re-mains to identify the expression of new molecules in tumors. In biological research, protein expression profiling technolo-gy is a useful method to identify differential protein expression patterns and modifications. Analytical techniques with high sensitivity and increased throughput are required for the dis-covery of new biomarkers and new drugs. Recent progress in imaging mass spectrometry (IMS) has made it possible to iden-tify several cellular components such as proteins, drugs, and other endogenous molecules directly on tissue sections (6-10). IMS uses matrix-assisted laser desorption ionization time-of-Oncology & Hematology
flight (MALDI-TOF) mass spectrometry (MS) technology. The matrix is applied on cryosectioned tissue and a very small area of the matrix-applied tissue is analyzed using MALDI-MS. Dif-ferences between the analyzed areas are displayed by the imag-ing program. Each analyzed area of the tissue section, which can be as small as > 200 µm, on a conductive surface such as gold-plated or indium tin oxide (ITO)-coated slide, is analyzed spot by spot using MALDI-MS after the application of the ma-trix. Using all the spectral data from each spot, the magnitudes of specific peaks on each spot can be displayed in terms of color intensity. In this way, spatial information on the tissue can be obtained. Based on the spatial distribution, region-specific pro-teins on a tissue can be identified by extracting propro-teins from the tissue, digesting them with trypsin, and analyzing the frag-ments using liquid chromatography with tandem MS (LC-MS/ MS). This technology using IMS has broad applications in the detection of new proteins in various fields. Compared with conventional imaging methods, the advantages of IMS are that it does not require the additional use of a specific antibody against the protein, and that it integrates histopathology and protein expression (11). For this reason, IMS provides superior information regarding distinct molecular arrangements in tis-sue sections.
In the present study, we attempted to analyze thyroid sam-ples, including those from PTC, using IMS. Before analysis us-ing IMS, the diagnosis was confirmed by microscopic evalua-tion, immunohistochemical (IHC) staining of markers such as CK19, galectin-3, and RET, and pyrosequencing of the BRAF mutation, and then 5 homogenous samples of PTC were
se-lected. After comparison of the differential molecular weight distribution between normal and tumor tissues using IMS, a protein of a specific molecular weight was identified by se-quencing combined with LC-MS/MS, and then the presence of this protein was reconfirmed by western blot analysis.
MATERIALS AND METHODS
Patient selection
This study investigated 5 patients who had been diagnosed with papillary carcinoma in the thyroid and had undergone total thyroidectomy (Fig. 1). Four of the patients were female and one was male. Patient ages ranged from 48-68 yr (mean age, 54.6 yr). Perithyroidal invasions of the tumor were observed in all patients, lymph node metastasis in 3 patients, and associa-tion with nodular hyperplasia in 2 patients. Tumor sizes ranged from 0.6-1.5 cm (average size, 0.96 cm). To prepare tumor sam-ples with identical molecular characteristics, the same configu-ration (BRAF mutation-positive, CK19 and galectin-3, and RET-negative), as confirmed by pyrosequencing and IHC staining, was selected.
Tissue sections
All samples were immersed in liquid nitrogen immediately af-ter excision. The frozen tissue was then sectioned into 10-μm thick slices at -20°C using a cryo-microtome (CM-1850; Leica Microsystems Nussloch GmbH, Nussloch, Germany). The opti-mum cutting temperature (OCT) polymer can cause deteriora-tion of IMS signals; therefore, special care should be taken to
A
B
C Fig. 1. Gross and microscopic findings of the thyroid. (A) The right thyroid showed a papillary carcinoma (black arrow) and nodular hyperplasia (black dash line arrow). Immuno-histochemistry was positive in CK19 (B) and Galectin-3 (C).
avoid OCT contamination in sections where it has been used to stabilize the tissue. The optimal procedure involves the use of OCT to adhere the tissue to the sample disc, without allowing it to come into contact with the sliced tissue. The frozen tissue sections were then thaw-mounted on ITO-coated glass slides (Bruker Daltonics Inc. Bremen, Germany). The prepared slides were dried in desiccators for about 20 min and then stored at -80°C until use.
Sample preparation for imaging mass spectrometry
Sinapinic acid (SA; Bruker Daltonics Inc.) was used as the pro-tein MALDI matrix and prepared as a 10 mg/mL solution in a 50:50 solution of acetonitrile and 0.5% trifluoroacetic acid (TFA). An ImagePrep instrument (Bruker Daltonics Inc.) was used to spray a total of 3 mL of matrix solution on each tissue section. The optimal parameters (dry time, incubation time, and thickness) of the ImagePrep instrument were set to obtain a homogeneous matrix crystal on the tissue sections. After ma-trix application, the homogeneity of the mama-trix on the tissue was checked using the imaging function of Chip-1000 (Shi-madzu Biotech, Kyoto, Japan). The ITO slide containing the tis-sue section was mounted on an MTP slide adapter (Bruker Daltonics Inc.), which was directly transferred to the MALDI mass spectrometer.
Matrix-assisted laser desorption ionization and time-of-flight mass spectrometry
IMS spectra were acquired in both positive- and negative-ion reflector modes with the aid of an Autoflex III MALDI-TOF mass spectrometer equipped with smart beam laser technolo-gy (Nd:YAG, 355 nm; Bruker Daltonics Inc.). MS data were ac-quired by averaging signals from 500 consecutive laser shots with a frequency of 200 Hz. All experiments conducted in this study were independently repeated 3 times. The spatial resolu-tion of each of the mass images shown is 200 μm. Prior to each data acquisition, external calibration was conducted using a mixed peptide calibration standard with a m/z range of 800-3,200. All obtained spectra were baseline-subtracted.
Image analysis
Data analysis software such as FlexImaging ver. 2.0, FlexAnaly-sis ver. 3.0 and ClinProTools ver. 2.1 from Bruker Daltonics (Bil-lerica, MA, USA) was employed to obtain the density maps of the species of interest and to check differences in the intensity of each spectrum. We manually analyzed normal and cancer regions according to supervised classification. Additionally, unsupervised classification was performed with Principal Component Analysis (PCA) using the ClinProTools software, and the results of this analysis were displayed using the FlexIm-aging software.
Tissue lysis and high performance liquid chromatography separation
After tissue sectioning for IMS, the remaining tissue masses were separated into normal and cancer regions and subjected to further protein identification. To remove any remaining OCT and blood, the tissue sample was washed with PBS. The T-PER tissue protein extraction reagent (Pierce/Thermo Fisher Scien-tific Inc. Rockford, IL, USA), with added protease and phospha-tase inhibitors for preventing protein degradation, was used as the lysis buffer. The suspended tissue samples were Dounce-homogenized at 200 rpm for 2 min on ice followed by sonica-tion (5 sec × 2). The final tissue lysates were centrifuged at 10,000 × g for 5 min at 4°C to remove intact cells and cell debris. For the separation of target proteins from tissue lysates, se-quential chromatography using C4 and C8 columns was per-formed. For the C4 column, the initial protein amount was 3 mg, and this was fractionated into 60 fractions. The fractions that contained proteins with the target m/z values were pooled and separated further using a C8 column. The resulting frac-tions were verified by MALDI-MS, and then subjected to pro-tein identification using LC-MS/MS.
In-gel digestion and mass spectrometry analysis
Fractions of interest were digested by a trypsin in-gel digestion procedure following separation by sodium dodecyl sulfate polyacrylamide gel electrophoresis (SDS-PAGE). Bands of in-terest were manually cut out, and the gel pieces were destained and washed prior to in-gel digestion. In-gel digestion was car-ried out with 250 ng/μL sequencing grade modified trypsin
(Promega, Madison, WI, USA) in 50 mM NH4HCO4 buffer (pH
8.0) at 37°C overnight. The digested peptides were extracted us-ing 5% formic acid in acetonitrile and cleared by centrifugation at 1,000 × g for 5 min. The supernatant was dried in a SpeedVac, and the resulting tryptic peptides were analyzed by LC-MS/MS with a fused-silica microcapillary C18 column (75 μm internal diameter; 100 mm length). LC was performed with the follow-ing linear gradient conditions: 0 min 3% B, 15 min 8% B, 23 min 16% B, 50 min 48% B, and 52 min 90% B (buffer A: 0.1% formic acid in H2O; buffer B: 0.1% formic acid in acetonitrile). The
col-umn was eluted with 90% solvent B for 10 min at the end of each run, and then re-equilibrated with the initial solvent con-dition (3% solvent B) for the next run. The flow rate was 250 nL/ min. The separated peptides were subsequently analyzed by linear ion trap mass spectrometry (LIT-MS) on an LTQ spec-trometer (Thermo Fisher Scientific Inc., San Jose, CA, USA). The electrospray voltage was set at 2.0 kV, and the threshold for switching from MS to MS/MS was 500. The normalized colli-sion energy for MS/MS was 35% of the main radio frequency amplitude, and the duration of activation was 30 ms. All spectra were acquired in data-dependent mode. Each full MS scan was followed by nine MS/MS scans, corresponding to the 9 most
intense peaks in the full MS scan. The repeat count of each peak for dynamic exclusion was 1, and the repeat duration was 30 sec. The dynamic exclusion duration was set at 180 sec and the ex-clusion mass width was ±1.5 Da. The list size of dynamic exclu-sion was 50.
Database analysis
The acquired LC-ESI-MS/MS fragment spectra were analyzed
in the BioWorksBrowserTM (version Rev. 3.3.1 SP1, Thermo
Fisher Scientific Inc., CA, USA) with the SEQUEST search en-gines against the National Center for Biotechnology Informa-tion (http://www.ncbi.nlm.nih.gov/) non-redundant human database.
The SEQUEST criteria for identifying peptides included the following: Xcorr values greater than 1.8, 2.2, and 3.5 for +1, +2, and +3 charge state peptides, respectively, a delta Cn value > 0.1, a fixed modification of carbarmidomethylation at cysteine (+58 Da), and a variable modification of oxidation at methionine (+16 Da).
Ethics statement
This study protocol was approved by the institutional review board of the Konkuk University Hospital (IRB No. KUH 1210010). Informed consent was confirmed by the board.
RESULTS
Tissue profiling by matrix-assisted laser desorption/ ionization imaging mass spectrometry
Hematoxylin and eosin (HE)-stained slides allowed the visual-ization of tumor lesions as dark pinkish areas and normal tissue as light pinkish areas (Fig. 2). We obtained spectra from tumor and normal areas of the thyroid tissue during the scan (Supple-mentary Fig. 1). These spectra clearly showed multiple peaks, representing patterns of protein expression in tumor and nor-mal tissue. For the evaluation of a particular protein expression pattern, these spectra were analyzed using unsupervised and supervised clustering analyses, and significant m/z values were
acquired that allowed the classification of tissues as tumor or normal samples (Supplementary Table 1).
Spectrometric images of molecules with different m/z values on frozen sections revealed various imaging patterns. Images reconstructed from supervised-classification analysis and PCA of the acquired datasets clearly differentiated tumor and nor-mal regions. The classification and PCA data revealed that the molecular distributions match the HE-stained images of excis-ed thyroid tissue samples. Of five cases, 4 tissue samples dem-onstrated that peaks corresponding to m/z values of 11,651- 11,667 exhibited higher intensities in tumor lesions, whereas the peak with an m/z value of 9,268-9,284 consistently showed higher intensities in normal thyroid. Color was used to repre-sent ions, and color saturation was a function of the relative in-tensity (see color reference bar).
Protein identification of tumor tissues
In the above sections, we have described the usefulness of IMS for protein profiling in tumor and normal thyroid tissue sam-ples. To identify differentially expressed proteins, we extracted proteins via lysis of surgically excised tissue specimens from 5 patients. For direct MALDI-TOF MS analysis, proteins extracted from tumor and normal tissue samples were separated by chro-matography on C4 and C8 columns. The fractions contained a protein with an m/z value of 11,661, consistent with one of the significant m/z values obtained from the above supervised and unsupervised clustering analyses of MALDI-IMS data (Supple-mentary Fig. 2).
For further evaluation, the pooled fractions were digested by a tryptic in-gel digestion procedure following SDS-PAGE. The resulting tryptic peptides from the pooled fractions were se-quenced using LC-MS/MS. LC-MS/MS results were analyzed
using the BioWorksBrowserTM (version Rev. 3.3.1 SP1, Thermo
Fisher Scientific Inc., CA, USA) for the identification of peptide sequences (Fig. 3).
Peptide profiles analyzed by BioWorksBrowserTM software
were matched to 64 amino acid sequences (55.7%) within 3 unique peptides of ribosomal protein P2 comprised of 115
Fig. 2. Selected molecular ion images from a papillary thyroid carcinoma section. The thyroid slide stained hematoxylin and eosin revealed papillary carcinoma. Imaging mass spectrometry based on Principal Component Analysis, molecular ions corresponding to 11,661 m/z and 9,282 m/z.
amino acids. The correspondence between the identified pro-tein and ribosomal propro-tein P2 was compatible with high confi-dence levels. The 3 unique matching peptide sequences had
m/z values of 1,870.11 (amino acids 3-21; sequence,
R.YVASYL-LAALGGNSSPSAK.D), 1,257.43 (amino acids 50-61; sequence, K.NIEDVIAQGIGK.L), and 2,776.08 (amino acids 62-94; se-quence, K.LASVPAGGAVAVSAAPGSAAPAAGSAPAAAEEK.K)
(Supplementary Fig. 3).
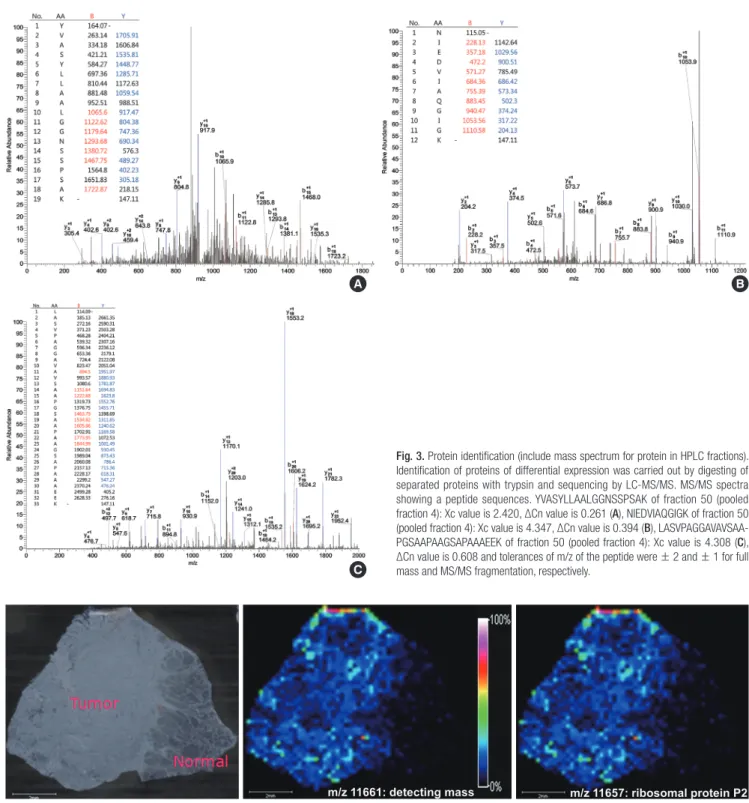
In addition, the MALDI-IMS data were re-analyzed to inves-tigate whether the identified ribosomal protein P2, with an m/z value of 11,657, showed differential distributions in the tumor lesions of another thyroid sample. The tumor tissue showed high concentration of detecting protein with an m/z value 11,661, corresponding to ribosomal protein P2 as identified by
Fig. 4. In imaging mass spectrometry, the distribution of detecting protein (11,661 m/z) displayed high concentration and corresponded with concentration of ribosomal protein p2 (11,657 m/z) in tumor lesion (∆ mass: 4 m/z).
Fig. 3. Protein identification (include mass spectrum for protein in HPLC fractions). Identification of proteins of differential expression was carried out by digesting of separated proteins with trypsin and sequencing by LC-MS/MS. MS/MS spectra showing a peptide sequences. YVASYLLAALGGNSSPSAK of fraction 50 (pooled fraction 4): Xc value is 2.420, ∆Cn value is 0.261 (A), NIEDVIAQGIGK of fraction 50 (pooled fraction 4): Xc value is 4.347, ∆Cn value is 0.394 (B), LASVPAGGAVAVSAA-PGSAAPAAGSAPAAAEEK of fraction 50 (pooled fraction 4): Xc value is 4.308 (C), ∆Cn value is 0.608 and tolerances of m/z of the peptide were ± 2 and ± 1 for full mass and MS/MS fragmentation, respectively.
A B
LC-MS/MS (Fig. 4). Additionally, the molecular distribution matched the HE-stained image of the surgically excised thyroid tissue. Therefore, IMS showed that the localization of the pro-tein was consistent with the location of the tumor lesion.
DISCUSSION
One of the most commonly used strategies in proteomics in-volves the identification of new proteins that are differentially expressed between normal and tumor tissues. The aims of can-cer proteomics are to define a more precise molecular cation of tumors than is accomplished by conventional classifi-cation, and to discover meaningful biomarkers for diagnosis, development of therapeutic strategies, and prognosis. Recently, IMS has been highlighted as a promising tool for the visualiza-tion and identificavisualiza-tion of biomolecules in tissue secvisualiza-tions (12). In addition to conventional methods such as genomics or pro-teomics, IMS has been considered to be of high importance for the discovery of new molecules. In the present study, we dem-onstrated the classification of tissue samples into tumor and normal tissues by the analysis of differential protein molecular weight distributions in human PTC samples. Among the differ-entially expressed peaks, ribosomal protein P2 was identified by LC-MS/MS as a protein that is differentially expressed in the tumor area. Consequently, these findings suggest that IMS may contribute to the identification of various proteins in future studies.
Profiling and imaging by IMS has been previously applied to tissue samples from various diseases, including lung, brain, breast, ovary, stomach and thyroid cancer (13-18). Molecular protein signatures represent a unique data set with which to classify and correlate clinically relevant information and out-comes with changing molecular events during the progression and treatment of disease (19). The approach taken by most published studies are comparative proteomic analysis whereby mass spectral features (m/z peaks) are correlated with a variety of clinical data, such as therapeutic regimen and overall out-come. Some studies have demonstrated the identification of specific molecular changes associated with progression of dis-ease. For instance, molecular signatures from glioma, ovarian cancer (20, 21) and non-small-cell lung cancer can be used to classify these lesions according to histological grade and to pre-dict the patients’ prognosis (13, 14). However, such significant molecular data have clinical limitations in predicting diagnosis and survival, because of the heterogeneous distributions of dif-ferent proteins in spite of the fact that each tumor sample has the same origin.
Although clinical limitations still exist, IMS may be helpful in the identification of unknown biological variables in various tumors. Therefore, this technique will provide a common ease-wide approach that can be applied to search specific
dis-ease entities. Previous data suggest that IMS might be superior to immunohistochemical staining in identifying the site of ori-gin for various tumors (22). Furthermore, the particular protein profiles identified by IMS could be useful to improve the selec-tion of drug agents during the development of a therapeutic strategy.
Our IMS analyses of PTC sections reveal that the distribu-tions of differentially expressed proteins show a separation be-tween normal and tumor tissues based on discrete molecular weight. In particular, recently developed analytical methods, such as supervised clustering using manual analysis and unsu-pervised clustering using PCA, were conducted to improve the separation of distributional prototypes and to identify specific proteins in thyroid tissue. Subsequently, the presence of ribo-somal protein P2 was identified by LC-MS/MS. A published study reports that ribosomal protein P2 is associated with tu-mor growth and could be a potential molecular target for anti-sense therapy of human malignancies, but its function in PTC is still unknown (23).
This study has several limitations. First, the small number of thyroid samples results in a limited ability to demonstrate an association between the detected protein and PTC. Second, in matching the m/z value of expected protein to that of ribosomal protein P2, the m/z value might have been altered due to tech-nological limitations such as insufficient mass resolution in the higher m/z region, although our m/z value was within the al-lowable error limit. Such technological limitations can make it difficult to ascertain our conclusions. Therefore, progressive technological improvement is essential to improve accuracy. Our study successfully showed the feasibility of using IMS as a useful tool for the analysis of tissue sections. This method may provide a new direction in the study of cancer, by identifying tu-mor-specific markers, and thereby leading to elucidation of the mechanism of tumorigenesis and the identification of thera-peutic targets. Additionally, protein profiles obtained from IMS may allow the accurate prediction of tumor behavior, diagnosis, and prognosis, and uncover the etiologies underlying idiopath-ic disease.
DISCLOSURE
The authors have no conflict of interest to disclose.
ORCID
Kyueng-Whan Min http://orcid.org/0000-0002-4757-9211 Joo-Young Bang http://orcid.org/0000-0002-2314-1530 Kwang Pyo Kim http://orcid.org/0000-0003-0095-3787 Wan-Seop Kim http://orcid.org/0000-0001-7704-5942 Sang Hwa Lee http://orcid.org/0000-0003-2692-9881 Selina Rahman Shanta http://orcid.org/0000-0003-0602-1323
Jeong Hwa Lee http://orcid.org/0000-0001-9787-6591 Ji Hye Hong http://orcid.org/0000-0001-8175-9147 So Dug Lim http://orcid.org/0000-0003-2036-0313 Young-Bum Yoo http://orcid.org/0000-0002-6910-5076 Chan-Hyun Na http://orcid.org/0000-0002-5711-2842
REFERENCES
1. Mazzaferri EL. Management of a solitary thyroid nodule. N Engl J Med 1993; 328: 553-9.
2. Kondo T, Ezzat S, Asa SL. Pathogenetic mechanisms in thyroid follicular-cell neoplasia. Nat Rev Cancer 2006; 6: 292-306.
3. Santarpia L, El-Naggar AK, Cote GJ, Myers JN, Sherman SI. Phosphati-dylinositol 3-kinase/akt and ras/raf-mitogen-activated protein kinase pathway mutations in anaplastic thyroid cancer. J Clin Endocrinol Metab 2008; 93: 278-84.
4. Xing M. BRAF mutation in papillary thyroid cancer: pathogenic role, molecular bases, and clinical implications. Endocr Rev 2007; 28: 742-62. 5. Adeniran AJ, Zhu Z, Gandhi M, Steward DL, Fidler JP, Giordano TJ, Bid-dinger PW, Nikiforov YE. Correlation between genetic alterations and microscopic features, clinical manifestations, and prognostic character-istics of thyroid papillary carcinomas. Am J Surg Pathol 2006; 30: 216-22. 6. Chaurand P, Schwartz SA, Reyzer ML, Caprioli RM. Imaging mass
spec-trometry: principles and potentials. Toxicol Pathol 2005; 33: 92-101. 7. Seeley EH, Caprioli RM. MALDI imaging mass spectrometry of human
tissue: method challenges and clinical perspectives. Trends Biotechnol 2011; 29: 136-43.
8. Seeley EH, Caprioli RM. Imaging mass spectrometry: towards clinical diagnostics. Proteomics Clin Appl 2008; 2: 1435-43.
9. Ko KH, Kwon CI, Park SH, Han NY, Lee HK, Kim EH, Hahm KB. Appli-cation of matrix-assisted laser desorption/ionization time-of-flight im-aging mass spectrometry (MALDI-TOF IMS) for premalignant gastroin-testinal lesions. Clin Endosc 2013; 46: 611-9.
10. Ko KH, Han NY, Kwon CI, Lee HK, Park JM, Kim EH, Hahm KB. Recent advances in molecular imaging of premalignant gastrointestinal lesions and future application for early detection of barrett esophagus. Clin En-dosc 2014; 47: 7-14.
11. Shimma S, Sugiura Y, Hayasaka T, Hoshikawa Y, Noda T, Setou M. MAL-DI-based imaging mass spectrometry revealed abnormal distribution of phospholipids in colon cancer liver metastasis. J Chromatogr B Analyt Technol Biomed Life Sci 2007; 855: 98-103.
12. Shanta SR, Zhou LH, Park YS, Kim YH, Kim Y, Kim KP. Binary matrix for MALDI imaging mass spectrometry of phospholipids in both ion modes. Anal Chem 2011; 83: 1252-9.
13. Yanagisawa K, Shyr Y, Xu BJ, Massion PP, Larsen PH, White BC, Roberts JR, Edgerton M, Gonzalez A, Nadaf S, et al. Proteomic patterns of tumour subsets in non-small-cell lung cancer. Lancet 2003; 362: 433-9.
14. Schwartz SA, Weil RJ, Thompson RC, Shyr Y, Moore JH, Toms SA, John-son MD, Caprioli RM. Proteomic-based prognosis of brain tumor patients using direct-tissue matrix-assisted laser desorption ionization mass spec-trometry. Cancer Res 2005; 65: 7674-81.
15. Cornett DS, Mobley JA, Dias EC, Andersson M, Arteaga CL, Sanders ME, Caprioli RM. A novel histology-directed strategy for MALDI-MS tis-sue profiling that improves throughput and cellular specificity in human breast cancer. Mol Cell Proteomics 2006; 5: 1975-83.
16. Lemaire R, Menguellet SA, Stauber J, Marchaudon V, Lucot JP, Collinet P, Farine MO, Vinatier D, Day R, Ducoroy P, et al. Specific MALDI imaging and profiling for biomarker hunting and validation: fragment of the 11S proteasome activator complex, Reg alpha fragment, is a new potential ovary cancer biomarker. J Proteome Res 2007; 6: 4127-34.
17. Balluff B, Rauser S, Meding S, Elsner M, Schöne C, Feuchtinger A, Schuh-macher C, Novotny A, Jütting U, Maccarrone G, et al. MALDI imaging identifies prognostic seven-protein signature of novel tissue markers in intestinal-type gastric cancer. Am J Pathol 2011; 179: 2720-9.
18. Meding S, Nitsche U, Balluff B, Elsner M, Rauser S, Schöne C, Nipp M, Maak M, Feith M, Ebert MP, et al. Tumor classification of six common cancer types based on proteomic profiling by MALDI imaging. J Proteome Res 2012; 11: 1996-2003.
19. Walch A, Rauser S, Deininger SO, Höfler H. MALDI imaging mass spec-trometry for direct tissue analysis: a new frontier for molecular histology. Histochem Cell Biol 2008; 130: 421-34.
20. Kang S, Lee A, Park YS, Lee SC, Park SY, Han SY, Kim KP, Kim YH, Yoo CW, Kim HK. Alteration in lipid and protein profiles of ovarian cancer: similarity to breast cancer. Int J Gynecol Cancer 2011; 21: 1566-72. 21. Kang HS, Lee SC, Park YS, Jeon YE, Lee JH, Jung SY, Park IH, Jang SH,
Park HM, Yoo CW, et al. Protein and lipid MALDI profiles classify breast cancers according to the intrinsic subtype. BMC Cancer 2011; 11: 465. 22. Chaurand P, Sanders ME, Jensen RA, Caprioli RM. Proteomics in
diag-nostic pathology: profiling and imaging proteins directly in tissue sections. Am J Pathol 2004; 165: 1057-68.
23. Gardner-Thorpe J, Ito H, Ashley SW, Whang EE. Ribosomal protein P2: a potential molecular target for antisense therapy of human malignan-cies. Anticancer Res 2003; 23: 4549-60.
Supplementary Fig. 1. Matrix-assisted laser desorption/ionization mass spectra taken a different locations within a papillary carcinoma. Over 100 different peaks could be de-tected with some of them having a distinct spatial distribution in the tissue. top, tumor area; bottom, normal area.
Supplementary Table 1. Comparisons between tumor and normal tissues according to supervised and unsupervised cluster analyses
Case 1 Case 2 Case 3 Case 4 Case 5
SC (Da) UC (Da) SC (Da) UC (Da) SC (Da) UC (Da) SC (Da) UC (Da) SC (Da) UC (Da) 3,196 (N) 3,200 3,440 (N) 2,120 9,264 (N) 2,480 15,134 (N) 2,230 4,629 (N) 3,331 4,750 (N) 3,330 5,070 (T) 2,246 15,150 (N) 2,971 5,070 (T) 2,357 9,257 (N) 3,442 9,273 (N) 3,433 4,637 11,654 (T) 4,759 11,658 (T) 2,885 9,403 (N) 3,702 4,227 (T) 4,229 4,964 4,970 4,572 9,464 (N) 4,749 6,280 (T) 4,526 5,078 6,268 4,620 3,452 (T) 4,964 11,652 (T) 4,625 6,276 6,669 4,965 4,120 (T) 5,064 12,237 (T) 4,758 6,661 7,587 5,081 4,959 (T) 9,268 9,277 9,282 9,284 5,271 4,962 (T) 10,107 9,400 11,664 7,591 5,066 (T) 11,667 11,661 11,337 10,113 13,789 14,013 14,017 11,651 13,860 15,175 15,166 15,177 14,008 15,919 15,147 44,190 15,896 27,841 31,789
Note: standard error of single mass analysis: ± 4D. It is in bold that significant values are concluded through consensus between supervised and unsupervised clustering. SC, Supervised clustering using manual analysis; UC, Unsupervised clustering using principle component analysis; N, normal tissue; T, tumor.
Supplementary Fig. 2. Matrix-assisted laser desorption/ionization mass spectrometry protein profiles from the HPLC fractions (fraction 50, pooled fraction 4). The peptide of 11,661 m/z (red arrow) was frequently found in tumor rather than in normal tissue.
Supplementary Fig. 3. Peptide profiles analyzed by BioWorksBrowserTM software were matched to 55.7% of amino acid sequences within 3 unique peptides (red circle) of ri-bosomal protein P2.