http://crossmark.crossref.org/dialog/?doi=10.14474/ptrs.2020.9.3.155&domain=pdf&date_stamp=2020-9-25
Received: 28 August, 2020 Revised: 14 September, 2020 Accepted: 15 September, 2020 Corresponding author: Wan-Hee Lee (ORCID https://orcid.org/0000-0001-8030-4853)
Department of Physical Therapy, College of Health Science and Social Welfare, Sahmyook University, 815 Hwarang-ro, Nowon-gu, Seoul 01795, Republic of Korea Tel: 82-2-3399-1633 Fax: 82-2-3399-1639 E-mail: [email protected]
This is an Open-Access article distributed under the terms of the Creative Commons Attribution Non-Commercial License (http://creativecommons.org/licenses/ by-nc/4.0) which permits unrestricted non-commercial use, distribution, and reproduction in any medium, provided the original work is properly cited.
Copyright © 2020 Korean Academy of Physical Therapy Rehabilitation Science https://doi.org/10.14474/ptrs.2020.9.3.155
pISSN 2287-7576 eISSN 2287-7584
Phys Ther Rehabil Sci 2020, 9 (3), 155-164 www.jptrs.org
Correlation among triceps surae muscle structure,
balance, and gait in persons with stroke
Hye-Kang Parka , Ki-Gon Yua , Jang-Hoon Shinb , Wan-Hee LeecaRehabilitation Center, Department of Physical Medicine and Rehabilitation, National Health Insurance Service Ilsan Hospital, Goyang,
Republic of Korea
bDepartment of Physical Therapy, The Graduate School, Sahmyook University, Seoul, Republic of Korea
cDepartment of Physical Therapy, College of Health Science and Social Welfare, Sahmyook University, Seoul, Republic of Korea
Objective: This study aimed to compare muscle structure, balance, and gait parameters between healthy adults and persons with
stroke and to analyze the correlation among these variables.
Design: Cross-sectional study.
Methods: Twenty persons with stroke (11 male, 9 female) and twenty healthy participants (9 male, 11 female) were included.
Ultrasound images of the triceps surae and the tibialis anterior were acquired in sitting resting, sitting co-contraction, and standing resting positions and also during the functional reach test (FRT) and single leg anterior reaching test (SLART). Muscle thickness and fascicle length were measured. Spatiotemporal parameters of gait were measured using a pressure walkway. Gait speed, ca-dence, step length, stride length, stance time, and swing time were measured.
Results: Changes in percent fascicle length were significantly greater in the gastrocnemius and soleus (SOL) muscles of healthy
adults in the sitting co-contraction position (p<0.05). The percent fascicle length of the SOL in FRT and SLART were significantly greater in healthy adults (p<0.05). The mid-stance phase of stroke patients was shorter than healthy adults (p<0.05). A negative correlation was observed between percent fascicle length of the SOL in the sitting co-contraction position and the proportion of the mid-stance phase (p<0.05).
Conclusions: The function of the triceps surae is affected in persons with stroke when compared with healthy adults. This can
lead to difficulty in performing tasks that involve forward transfer of weight. If the triceps surae is not sufficiently secured, the pos-sibility of compensation in the stance phase increases during gait.
Key Words: Gait, Muscle structure, Stroke, Ultrasonography
Introduction
Stroke mainly involves damage to the central nervous system, but changes in the musculoskeletal system after stroke are also important [1]. Typical changes include phys-ical shortening and decreases in the elasticity of the injured muscle due to stroke, alterations in the metabolic process of the muscle due to muscle atrophy and increase in muscle fat, and physical limitations due to decreased muscle strength and contractile response [2]. A number of previous studies
have revealed that structural changes (changes in muscle thickness, fascicle length, pennation angle) occur after stroke [1,3-5].
The lower limb muscles play an important role in com-munity participation, as they affect balance and mobility [6]. Therefore, recovery of the lower limb muscles can be con-sidered a milestone in returning to daily life in stroke survivors. Stroke leads to marked damage to the extensor leg muscle and reduction in the plantar flexor muscle strength [7]. Previous studies have shown that structural changes in
the quadriceps muscle, which serves as an extensor muscle of the knee, has affected the walking speed and postural sta-bility of patients with stroke and there is considerable struc-tural and functional deterioration of the plantar flexor mus-cle compared to healthy adults [3,8]. In particular, chronic stroke survivors with a gait speed slower than 0.8 m/s showed thinner quadriceps muscle thickness and the worst static balance compared to healthy adults [8]. In addition, the volume, moment, and activation of the plantar flexor muscle of stroke survivors were all lower than that of healthy adults, and fascicle lengths and extensibility were decreased due to stiffness [3,9]. A previous study showed that stretching the lower limb muscles, including the plantar flexor muscle, improved ambulation speed and the struc-tural changes in the muscle [9]. However, there are only a few studies that examine how this altered muscle structure affects physical function.
The plantar flexor muscle is also termed the triceps surae, as it is composed of the medial and lateral Gastrocnemius (GCM) muscles and the Soleus (SOL) muscle [10]. This muscle is elongated to a sufficient length through eccentric contraction during the stance phase, preparing to generate maximum force in the direction of plantar flexion and creat-ing propulsion in the forward direction uscreat-ing concentric contraction in the swing phase [11-13].
The stance phase of the gait cycle is divided into three rocker sections according to the movement of the ankle. The first rocker is from heel-contact to foot-flat (gait cycle 0%-6%). The second rocker is the time when the tibia moves forward with the whole foot in contact with the ground (gait cycle 6%-42%). The third rocker is from heel-off to toe-off (42%-62% gait cycle) [14]. A previous study in healthy adults showed that plantar flexion force increased with an increase in the length of triceps surae in the second rocker phase [11]. Another study showed an increase in the activity of calf muscles while tilting the body forward in a standing position [15]. In this way, the ankle plays an important role in maintaining the body stable against the ground in the standing and stance phase, and the muscles around the ankle respond appropriately according to the direction in which the body is inclined to maintain balance [16].
However, in patients with stroke, the displacement of the center of pressure in the sagittal plane increases due to struc-tural and functional problems of the ankle muscle, resulting in poor postural stability [8]. Thus, the role of the triceps sur-ae is important in maintaining balance in a static posture or in moving the body forward while walking.
Most of the studies involving the stroke population have focused on strengthening the overall lower extremity muscle strength and changing the gait pattern using various environ-ments such as robots and virtual reality [6,8,17-19]. Recently, with emerging knowledge about the importance of the triceps surae, various studies have reported improve-ment of function in patients with stroke through eccentric contraction or stretching of the triceps surae [3,9,13,20]. However, studies comparing the triceps surae and the tibialis anterior (TA) at the muscle level using ultrasound images in patients with stroke and studies examining the relationship among functional movements are insufficient. In addition, in the process of analyzing the spatiotemporal gait parame-ters, studies that have divided the stance phase into three sec-tions were insufficient. Therefore, the purpose of this study was to compare the muscle structure, balance, and gait pa-rameters between healthy adults and patients affected by stroke and to analyze the correlation among muscle struc-ture, balance and the stance phase during the gait cycle.
Methods
Participants
Twenty participants with stroke (11 male, 9 female) and twenty healthy participants (9 male, 11 female) were in-cluded in the study. The sample size of the study were calcu-lated using the G*Power version 3.1.9.4 (Universität Kiel, Kiel, Germany) with an effect size of 0.967 and a power of 0.8 [21]. The inclusion criteria for the participants with stroke were: (1) more than 6 months since the stroke epi-sode, (2) ability to walk at least 10 m, and (3) participants who could understand and carry out the researcher’s instructions. The exclusion criteria for the participants with stroke were: (1) surgery and orthosis of the lower extremi-ties; (2) severe musculoskeletal, vestibular, and neuro-logical damage; (3) pain; (4) spasticity of the lower ex-tremity on the affected side (Modified Ashworth Scale score ≥3); and (5) Botox injection into the lower limb muscles within the past 6 months. The inclusion criteria for healthy participants were adults without neuromuscular or orthope-dic damage and pain. The study was approved by the Institutional Review Board at the National Health Insurances Service Ilsan Hospital (IRB No. NHIMC 2020- 04-014-001). All participants provided written informed consent as follows with the ethical principles of the Declaration of Helsinki.
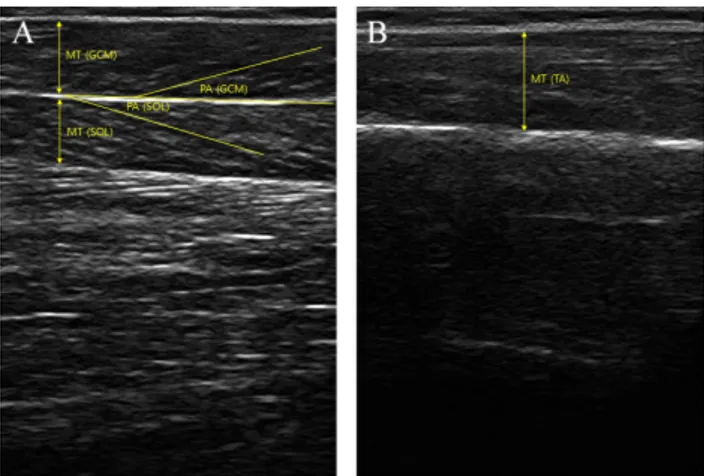
Figure 1. Ultrasound image of muscle thickness (MT) and penna-tion angle (PA) of (A) triceps surae and (B) tibialis anterior. Procedures
This study was designed as a single-blind (subject mask-ing) cross-sectional study to compare healthy adults with pa-tients with stroke. Before beginning the study, the general characteristics of all subjects were examined. An examina-tion of the muscle structure of the triceps surae and TA in a sitting position was performed using a dual-rehabilitative ul-trasound imaging device (dual-MicrUs EXT; TELEMED, Vilnius, Lithuania). Muscle structure including muscle thickness and pennation angle was measured at rest and at dorsiflexion with maximum contraction against manual re-sistance [22]. Muscle structure was measured while resting in the standing position and the change in muscle structure was measured during the functional reach test (FRT) and the single leg anterior reaching test (SLART). The gait ability was measured using (GAITRite; CIR Systems, Inc., Franklin, NJ, USA) equipment to investigate the spatiotemporal gait variables during the stance phase and the swing phase. The assessments were performed in randomized order to mini-mized bias of the procedure order.
Measurements
Muscle structure (Dual-rehabilitative ultrasound imag-ing, D-RUSI)
The D-RUSI device was used to simultaneously measure the muscle structures of the triceps surae and TA (Figure 1). For muscle structure, the muscle thickness and pennation angle was assessed. The fascicle length was calculated using these two values. Muscle thickness was the distance be-tween the superficial and the deep aponeuroses. Pennation angle was the angle between the muscle fascicle and the
aponeuroses. Fascicle length was calculated according to the following equation:
Fascicle length=muscle thickness×(Sin Ɵ)−1 [23] Ɵ was the pennation angle of each muscle on the ultra-sound image. Ultraultra-sound imaging was performed using two 12 MHz probes (dual-linear probes) in B-mode. The first ul-trasonic transducer was placed at the middle of the inner calf muscle so that medial GCM and SOL could be measured si-multaneously [24]. The second ultrasonic transducer was placed at a point situated at 20% of the distance from the head of the fibula to the lateral malleolus to measure the TA [25]. The intraclass correlation coefficient (ICC) value (95% confidence interval [CI]) of the D-RUSI device was 0.720-0.945, indicating good to very good reliability and the minimum detectable change values were 0.021 mm and 0.127 mm based on the TA and the rectus muscles [5]. After measurement, the muscle structure was analyzed through the Echo Wave II software (TELEMED).
To normalize individual differences in muscle thickness and fascicle length, it was expressed as percent thickness based on the resting state using the following formula.
Percent thickness
(fascicle length)=
−
×100 [26]CGCM,SOL,TA refers to the muscle thickness (fascicle
length) measured during co-contraction in the sitting posi-tion and during FRT and SLART in the standing posiposi-tion.
RGCM,SOL,TA was defined as muscle thickness (fascicle
length) measured during resting in the sitting and standing positions.
Balance
Functional reach test
The FRT is a tool used to assess balance in clinical practice. It evaluates the ability to move the center of pres-sure forward by extending the arm in the forward direction from the standing position [27]. The evaluation method be-gan with a position wherein the participant’s feet were shoulder-width apart, the trunk was held vertically on the ground, and the fists were stretched forward comfortably (90 degrees’ flexion of the shoulder joint, elbow joint fully extended). Then the location of the third metacarpal pha-langeal (MCP) joint was marked.
The level was maintained with a ruler installed at shoulder height and the body was tilted as far as possible to stretch the fist so that the ruler did not fall. The FRT distance was
de-Table 1. Demographic characteristics (N=40)
Characteristics Stroke (n=20) Healthy (n=20) p-value
Age (yr) 57.20 (6.66) 47.90 (9.28) 0.001
Sex (male/female) 11/9 9/11 0.752
Weight (kg) 66.90 (10.10) 64.60 (11.16) 0.499
Height (cm) 164.05 (8.02) 166.60 (8.07) 0.322
Body mass index (kg/m2) 24.75 (2.15) 23.28 (3.84) 0.144
Values are presented as mean (SD) or number only.
fined as the location between the initial MCP joint and the fi-nal MCP joint [28]. Measurement was performed after a sin-gle practice attempt and after three attempts and the average value was recorded. A distance of less than 17.78 cm in-dicated problems in performing daily life activities due to limited mobility and decreased locomotion [29]. The test-re-test and inter-rater reliability of the FRT is high (r=0.92 and r=0.98, respectively) [27]. The individual ankle joint strat-egy or the hip joint stratstrat-egy was used to maintain balance while performing the FRT. In the present study, since the fo-cus was on the movement of the ankle joint, the dorsiflexion angle of the ankle joint while performing the examination was required to be over 5° to minimize the hip joint strategy [30].
Single leg anterior reaching test
The SLART is a tool used for evaluating the posture con-trol ability of the lower extremities. It includes only the for-ward stretch from the Star excursion balance test, which is a dynamic balance evaluation test. In the SLART for this study, one foot was stretched forward as far as possible from a standing position and then returned to the original position. At the same time, the supported side of the foot of the subject remained in contact with the ground [31]. The evaluation was conducted three times and the average value was used. The ICC value (95% CI) of this evaluation method was 0.88-0.96, indicating good to very good reliability and the minimum detection change value was 5.5 cm [32].
Gait analysis
GAITRite equipment was used to analyze the spatio-temporal variables during the stance phase and the swing phase of the subjects’ gait. This equipment is 5 m long, 0.6 m wide, 0.6 cm high, and consists of a flat floor with 16,128 pressure sensors. The measurement method was based on a walking board of 5 m, which takes into account the accel-eration and the decelaccel-eration section of the gait with a margin
of 2 m each. Altogether, 9 m of gait was measured three times and the average value was calculated [33]. The spatio-temporal variables of the stance phase and the swing phase included gait speed, cadence, step length, stride length, stance time, and swing time. The stance phase included the contact phase, mid-stance phase, and propulsion phase. The criteria for dividing into three phases was set in the heel-to-toe progression method according to previous stud-ies [34]. The ICC value of this equipment was 0.92-0.99, in-dicating very good reliability [35].
Statistical analysis
PASW Statistics for Windows, Version 18.0 (SPSS Inc., Chicago, IL, USA) was used for all statistical analyses. The Shapiro-Wilk test was performed to confirm the normality of participant characteristics. All data were expressed as the mean (standard deviation). An independent t-test was per-formed to compare the outcome between the healthy adults and the participants with stroke. Analysis of variance was used to compare the affected side, the non-affected side, and the healthy leg during gait. Pearson’s correlation analysis was performed to analyze the correlation between the variables. Correlation analysis was interpreted according to the rule of thumb for interpreting the size of a correlation co-efficient [36]. The threshold for statistical significance was set at p<0.05.
Results
Baseline participant characteristics
The baseline characteristics of the 40 participants are summarized in (Table 1).
Muscle structure
GCM thickness (p=0.043) and SOL fascicle length (p=0.002) of healthy adults in the sitting resting position were significantly greater than those in the patients with
Table 2. Differences in muscle structure between the groups (N=40)
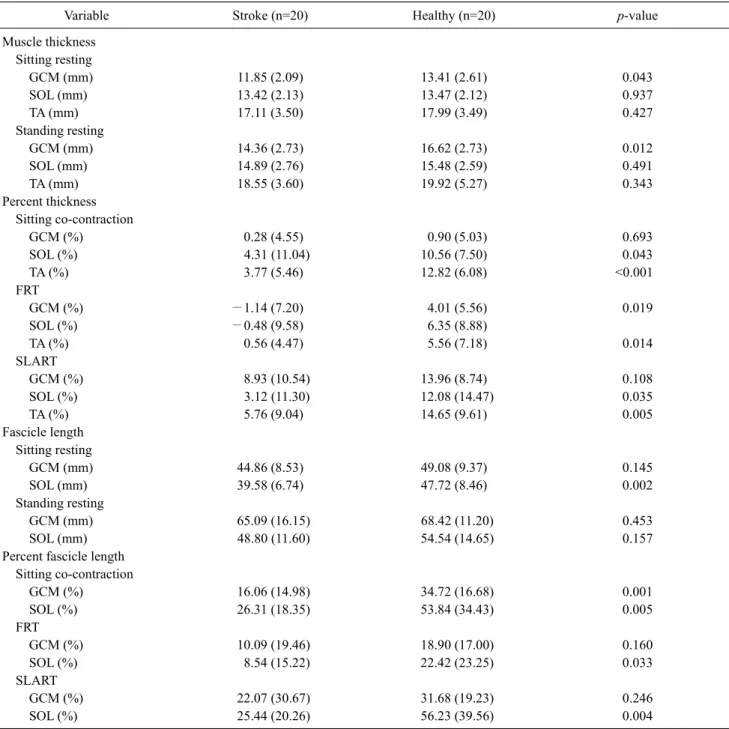
Variable Stroke (n=20) Healthy (n=20) p-value
Muscle thickness Sitting resting GCM (mm) 11.85 (2.09) 13.41 (2.61) 0.043 SOL (mm) 13.42 (2.13) 13.47 (2.12) 0.937 TA (mm) 17.11 (3.50) 17.99 (3.49) 0.427 Standing resting GCM (mm) 14.36 (2.73) 16.62 (2.73) 0.012 SOL (mm) 14.89 (2.76) 15.48 (2.59) 0.491 TA (mm) 18.55 (3.60) 19.92 (5.27) 0.343 Percent thickness Sitting co-contraction GCM (%) 0.28 (4.55) 0.90 (5.03) 0.693 SOL (%) 4.31 (11.04) 10.56 (7.50) 0.043 TA (%) 3.77 (5.46) 12.82 (6.08) <0.001 FRT GCM (%) −1.14 (7.20) 4.01 (5.56) 0.019 SOL (%) −0.48 (9.58) 6.35 (8.88) TA (%) 0.56 (4.47) 5.56 (7.18) 0.014 SLART GCM (%) 8.93 (10.54) 13.96 (8.74) 0.108 SOL (%) 3.12 (11.30) 12.08 (14.47) 0.035 TA (%) 5.76 (9.04) 14.65 (9.61) 0.005 Fascicle length Sitting resting GCM (mm) 44.86 (8.53) 49.08 (9.37) 0.145 SOL (mm) 39.58 (6.74) 47.72 (8.46) 0.002 Standing resting GCM (mm) 65.09 (16.15) 68.42 (11.20) 0.453 SOL (mm) 48.80 (11.60) 54.54 (14.65) 0.157
Percent fascicle length Sitting co-contraction GCM (%) 16.06 (14.98) 34.72 (16.68) 0.001 SOL (%) 26.31 (18.35) 53.84 (34.43) 0.005 FRT GCM (%) 10.09 (19.46) 18.90 (17.00) 0.160 SOL (%) 8.54 (15.22) 22.42 (23.25) 0.033 SLART GCM (%) 22.07 (30.67) 31.68 (19.23) 0.246 SOL (%) 25.44 (20.26) 56.23 (39.56) 0.004
Values are presented as mean (SD).
GCM: gastrocnemius, SOL: soleus, TA: tibialis anterior, FRT: functional reach test, SLART: single leg anterior reaching test. stroke. Healthy adults had significantly larger GCM
thick-ness in the standing resting position (p=0.012). Changes in percent thickness was significantly greater in the SOL (p=0.043) and the TA (p<0.001) of healthy adults in the sit-ting co-contraction position. In the FRT, percent muscle thickness of the GCM (p=0.019), SOL (p=0.029), and the TA (p=0.014) were significantly greater in healthy adults. In
the SLART, percent muscle thickness of the SOL (p=0.035) and the TA (p=0.005) were significantly greater in healthy adults. Changes in percent fascicle lengths were sig-nificantly greater in the GCM (p=0.001) and the SOL (p=0.005) of healthy adults in the sitting co-contraction position. The percent fascicle length of the SOL in the FRT (p=0.033) and the SOL in the SLART (p=0.004) were
sig-Table 3. Differences in balance and gait parameters between the groups
Variable Stroke (n=20) Healthy (n=20) p-value
Balance FRT (cm) 23.74 (7.92) 31.53 (6.60) 0.002 SLART (cm) 58.15 (11.83) 82.67 (12.87) <0.001 Gait parameters Gait speed (cm/s) 57.27 (25.06) 129.64 (16.01) <0.001 Cadence (steps/min) 84.56 (16.41) 118.63 (8.03) <0.001
Values are presented as mean (SD).
FRT: functional reach test, SLART: single leg anterior reaching test.
Table 4. Spatiotemporal parameters amongpatients with stroke and healthy adults
Variable Stroke affected side Stroke non-affected side Healthy control p-value Post-hoc test
Step time (s) 0.83 (0.18) 0.64 (0.15) 0.51 (0.03) <0.001 1>2>3
Step length (cm) 42.03 (13.16) 36.89 (14.12) 65.63 (6.27) <0.001 1=2<3
Stride length (cm) 79.11 (26.40) 79.16 (26.28) 131.15 (11.84) <0.001 1=2<3
Swing time (s) 0.49 (0.10) 0.34 (0.08) 0.38 (0.03) <0.001 1>2=3
Stance time (s) 0.95 (0.24) 1.12 (0.29) 0.63 (0.04) <0.001 1=2>3
Values are presented as mean (SD).
1: stroke affected side, 2: stroke non-affected side, 3: healthy control.
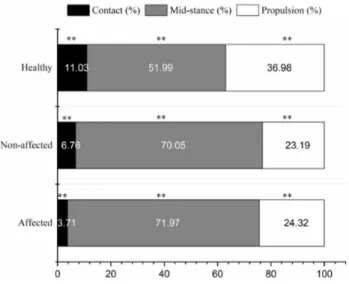
Figure 2. Stance phase percentages.
**Significant difference among affected side in stroke patients, non-affected side in stroke patients, and healthy controls. nificantly greater in healthy adults (Table 2).
Balance
The FRT (p=0.002) and SLART (p<0.001) distances were significantly greater in healthy adults compared to the pa-tients with stroke (Table 3).
Gait parameters
The gait speed (p<0.001) and cadence (p<0.001) of healthy adults were significantly higher than the patients with stroke (Table 3). The patients with stroke were sig-nificantly slower than healthy adults in terms of step time (p<0.001), swing time (p<0.001), and stance time (p<0.001). In addition, the step length (p<0.001) and stride length (p<0.001) of the patients with stroke were sig-nificantly longer than those of healthy adults (Table 4). The contact phase of the patients with stroke was shorter than that of healthy adults (p<0.001) and the propulsion phase was shorter than that of healthy adults (p<0.001). The mid-stance phase was longer than that of healthy adults (p<0.001) (Figure 2).
Correlation analysis
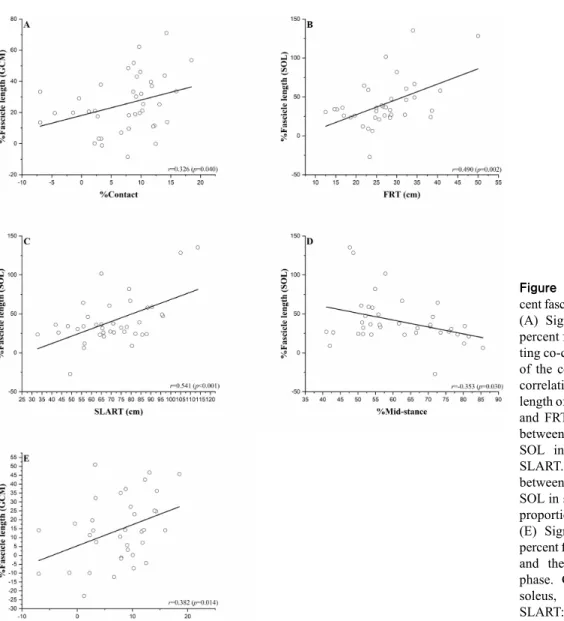
A significant positive correlation was observed between the percent fascicle length of the GCM in the sitting
co-con-traction position and the proportion of the contact phase (r=0.326; p=0.004). A negative correlation was observed between percent fascicle length of the SOL in the sitting co-contraction phase and the proportion of the mid-stance phase (r=−0.353; p=0.030). A significant positive correla-tion was observed between the percent fascicle length of the SOL and the FRT (r=0.490; p=0.002) and the SLART
dis-Figure 3. Correlation between per-cent fascicle length and other variables. (A) Significant correlation between percent fascicle length of GCM in sit-ting co-contraction and the proportion of the contact phase. (B) Significant correlation between percent fascicle length of SOL in sitting co-contraction and FRT. (C) Significant correlation between percent fascicle length of SOL in sitting co-contraction and SLART. (D) Significant correlation between percent fascicle length of SOL in sitting co-contraction and the proportion of the mid-stance phase. (E) Significant correlation between percent fascicle length of GCM in FRT and the proportion of the contact phase. GCM: gastrocnemius, SOL: soleus, FRT: functional reach test, SLART: single leg anterior reaching test.
tance (r=0.541; p<0.001). During FRT, percent fascicle length of GCM and the proportion of the contact phase showed significant positive correlation (r=0.382; p=0.014) (Figure 3).
Discussion
The purpose of the present study was to compare the mus-cle structure, balance, and gait parameters of the triceps sur-ae between stroke survivors and healthy adults and to ana-lyze the correlation among these parameters.
In the present study, the participants with stroke showed lower thickness of the SOL and the TA muscles and shorter fascicle length of the triceps surae during co-contraction when compared with healthy adults. In addition, during the
FRT and SLART, the thicknesses of the triceps surae and TA were lower and the fascicle length of the SOL was shorter in the participants with stroke. The lower thickness and shorter fascicle length implies spasticity and decrease in the number of sarcomeres in series. Hence, the required amount of mo-tor recruitment is not possible [37]. These findings are sim-ilar to the findings from a previous study, which suggested that healthy adults can exert greater force, while stroke sur-vivors are affected by damaged neural drive, leading to spas-tic muscle architecture and consequent problems with force production [27]. Interestingly, the differences in muscle thickness and fascicle length between healthy adults and the stroke survivors were greater during the sitting co-con-traction position, the FRT, and the SLART than during the resting position. These findings are similar to the results of
previous studies suggesting increased muscle thickness and fascicle length during eccentric contraction [38].
The FRT distance of the participants with stroke were 7.79% lower than that of healthy adults and the SLART dis-tance was 24.52% lower. These results are similar to pre-vious research findings, which suggested that it is difficult for patients with chronic stroke to secure stability in a static and dynamic balanced environment when compared with young adults and healthy adults of similar age [39].
Compared to healthy adults, the gait speed of the partic-ipants with stroke was 72.37% lower and the cadence was 34.07% lower. These findings are similar to a previous find-ing, which suggested that the stroke population generally show a decrease in gait speed and distance compared to healthy adults, which is related to weakening of plantar flex-or strength [40].
According to a previous study, stroke survivors showed hip flexor compensation due to weakening of the plantar flexor on the affected side, leading to asymmetrical gait pat-terns [41]. In the present study, the step time and swing time on the affected side were longer than the same parameters on the non-affected side and in healthy leg. However, there was no significant difference between the affected side and the non-affected side in step length, stride length, and stance time. This result is different from the results of previous studies, which suggested that step length on the affected side was shortened and the stance phase was longer during walk-ing in the participants with stroke [42]. It is possible that chronic stroke survivors consciously increase the swing time on the affected side for symmetry and try to propel it to a distance similar to that on the non-affected side. However, additional research is needed to find out the exact reason.
There was no significant difference between the affected and the non-affected side of the participants with stroke in the contact phase, mid-stance phase, and the propulsion phase based on heel-to-toe progression. Compared to healthy adults, the contact phase and the propulsion phase were 4.27%-7.32% shorter and the mid-stance phase was 18.06%-19.98% longer in the participants with stroke. A previous study involving patients with multiple sclerosis with neurological impairment reported muscle weakness and gait disorders similar to those observed in the stroke population and also reported that the proportion of the mid-stance phase increased with shortening of the contact phase and propulsion phase [34]. These findings imply the application of a compensation mechanism such as knee hy-perextension during gait [43]. However, since the present
study did not measure the knee angle during gait, additional research is needed on this topic.
In co-contraction of the triceps surae, a low positive corre-lation was observed between percent fascicle length of the SOL and the FRT (r=0.490) and a moderate positive correla-tion was observed between the percent fascicle length of the SOL and the SLART (r=0.541). These results are similar to the results of previous studies, which suggested that the FRT distance increases with an increase in the angle of the ankle joint. Thus, the muscles become stronger and weight trans-fer can be performed in a satisfactory manner [44].
During the sitting co-contraction position, a low positive correlation was observed between the fascicle length of the GCM and the proportion of the contact phase (r=0.326) and a low negative correlation was observed (r=−0.353) be-tween the fascicle length of the SOL and the proportion of the mid-stance phase. These findings suggest that the fas-cicle length of the triceps surae can affect the balance and the stance phase during gait.
The present study has some limitations. It is difficult to generalize the results of the study due to the small sample sizes of the comparison groups. The groups were not well matched with respect to age, as the average age of the pa-tients with stroke was greater than that of the healthy adults. Since variables other than the triceps surae can also affect the FRT, SLART, and the stance phase, future studies that apply various variables based on the results of the present study are needed.
In conclusion, the function of the triceps surae is affected in the stroke population when compared with healthy adults, which can lead to difficulty in performing tasks that involve transfer of weight in a forward direction. If the triceps surae, especially the fascicle length of the SOL muscle, is not suffi-ciently secured, the possibility of compensation in the stance phase increases during gait.
Conflict of Interest
The authors declared no potential conflicts of interest with respect to the authorship and/or publication of this article.
References
1. Berenpas F, Martens AM, Weerdesteyn V, Geurts AC, van Alfen N. Bilateral changes in muscle architecture of physically active people with chronic stroke: a quantitative muscle ultrasound study. Clin Neurophysiol 2017;128:115-22.
2. Gracies JM. Pathophysiology of spastic paresis. I: paresis and soft tissue changes. Muscle Nerve 2005;31:535-51.
3. Dias CP, Lanferdini FJ, Onzi EdS, Goulart NBA, Becker J, Gomes I, et al. The influence of hemiparesis on triceps surae morphological and mechanical properties in stroke survivors. Isokinet Exerc Sci 2016;24:157-64.
4. Cho JE, Cho KH, Yoo JS, Lee SJ, Lee WH. Reliability and val-idity of a dual-probe personal computer-based muscle viewer for measuring the pennation angle of the medial gastrocnemius mus-cle in patients who have had a stroke. Top Stroke Rehabil 2018; 25:6-12.
5. Lee HJ, Ha HG, Hahn J, Lim S, Lee WH. Intra- and inter-rater re-liabilities for novel muscle thickness assessment during Co-con-traction with dual-rehabilitative ultrasound imaging. Phys Ther Sport 2018;32:109-14.
6. Jørgensen JR, Bech-Pedersen DT, Zeeman P, Sørensen J, Andersen LL, Schönberger M. Effect of intensive outpatient physical training on gait performance and cardiovascular health in people with hemiparesis after stroke. Phys Ther 2010;90:527- 37.
7. Kesar TM, Perumal R, Reisman DS, Jancosko A, Rudolph KS, Higginson JS, et al. Functional electrical stimulation of ankle plantarflexor and dorsiflexor muscles: effects on poststroke gait. Stroke 2009;40:3821-7.
8. Sánchez-Sánchez ML, Ruescas-Nicolau MA, Carrasco JJ, Espí-López GV, Pérez-Alenda S. Cross-sectional study of quad-riceps properties and postural stability in patients with chronic stroke and limited vs. non-limited community ambulation. Top Stroke Rehabil 2019;26:503-10.
9. Pradines M, Ghedira M, Portero R, Masson I, Marciniak C, Hicklin D, et al. Ultrasound structural changes in triceps surae af-ter a 1-year daily self-stretch program: a prospective randomized controlled trial in chronic hemiparesis. Neurorehabil Neural Repair 2019;33:245-59.
10. Stenroth L. Structure and function of human triceps surae muscle and tendon in aging. Jyväskylä: Jyväskylä University Printing House; 2016.
11. Orendurff MS, Segal AD, Aiona MD, Dorociak RD. Triceps sur-ae force, length and velocity during walking. Gait Posture 2005; 21:157-63.
12. Francis CA, Lenz AL, Lenhart RL, Thelen DG. The modulation of forward propulsion, vertical support, and center of pressure by the plantarflexors during human walking. Gait Posture 2013;38: 993-7.
13. Geremia JM, Baroni BM, Bini RR, Lanferdini FJ, de Lima AR, Herzog W, et al. Triceps surae muscle architecture adaptations to eccentric training. Front Physiol 2019;10:1456.
14. Decq P, Filipetti P, Cubillos A, Slavov V, Lefaucheur JP, Nguyen JP. Soleus neurotomy for treatment of the spastic equinus foot. Groupe d'Evaluation et de Traitement de la Spasticité et de la Dystonie. Neurosurgery 2000;47:1154-60; discussion 1160-1. 15. Sakanaka TE, Gill J, Lakie MD, Reynolds RF. Intrinsic ankle
stiffness during standing increases with ankle torque and passive stretch of the Achilles tendon. PLoS One 2018;13:e0193850. 16. Masani K, Popovic MR, Nakazawa K, Kouzaki M, Nozaki D.
Importance of body sway velocity information in controlling an-kle extensor activities during quiet stance. J Neurophysiol 2003; 90:3774-82.
17. Aaron SE, Hunnicutt JL, Embry AE, Bowden MG, Gregory CM. POWER training in chronic stroke individuals: differences be-tween responders and nonresponders. Top Stroke Rehabil 2017; 24:496-502.
18. Klamroth-Marganska V. Stroke rehabilitation: therapy robots and assistive devices. Adv Exp Med Biol 2018;1065:579-87. 19. Maggio MG, Latella D, Maresca G, Sciarrone F, Manuli A, Naro
A, et al. Virtual reality and cognitive rehabilitation in people with stroke: an overview. J Neurosci Nurs 2019;51:101-5.
20. Ghasemi E, Khademi-Kalantari K, Khalkhali-Zavieh M, Rezasoltani A, Ghasemi M, Akbarzadeh Baghban A, et al. The effect of functional stretching exercises on neural and mechan-ical properties of the spastic medial gastrocnemius muscle in pa-tients with chronic stroke: a randomized controlled trial. J Stroke Cerebrovasc Dis 2018;27:1733-42.
21. Dias CP, Freire B, Goulart NB, Onzi ES, Becker J, Gomes I, et al. Muscle architecture and torque production in stroke survivors: an observational study. Top Stroke Rehabil 2017;24:206-13. 22. Hagen M, Schwiertz G, Landorf KB, Menz HB, Murley GS.
Selective activation of lower leg muscles during maximum vol-untary isometric contractions. Hum Mov Sci 2016;50:30-7. 23. Kumagai K, Abe T, Brechue WF, Ryushi T, Takano S, Mizuno M.
Sprint performance is related to muscle fascicle length in male 100-m sprinters. J Appl Physiol 2000;88:811-6.
24. Clark WH, Franz JR. Do triceps surae muscle dynamics govern non-uniform Achilles tendon deformations? PeerJ 2018;6:e5182. 25. McCreesh K, Egan S. Ultrasound measurement of the size of the
anterior tibial muscle group: the effect of exercise and leg dominance. Sports Med Arthrosc Rehabil Ther Technol 2011;3: 18.
26. Larivière C, Gagnon DH, Henry SM, Preuss R, Dumas JP. The effects of an 8-week stabilization exercise program on lumbar multifidus muscle thickness and activation as measured with ul-trasound imaging in patients with low back pain: an exploratory study. PM R 2018;10:483-93.
27. Duncan PW, Weiner DK, Chandler J, Studenski S. Functional reach: a new clinical measure of balance. J Gerontol 1990;45: M192-7.
28. Jenkins ME, Johnson AM, Holmes JD, Stephenson FF, Spaulding SJ. Predictive validity of the UPDRS postural stability score and the Functional Reach Test, when compared with eco-logically valid reaching tasks. Parkinsonism Relat Disord 2010; 16:409-11.
29. Weiner DK, Duncan PW, Chandler J, Studenski SA. Functional reach: a marker of physical frailty. J Am Geriatr Soc 1992;40: 203-7.
30. Tanaka R, Ishikawa Y, Yamasaki T, Diez A. Accuracy of classify-ing the movement strategy in the functional reach test usclassify-ing a markerless motion capture system. J Med Eng Technol 2019;43: 133-8.
31. Miller MM. Postural control task performance of individuals with femoroacetabular impingement syndrome [Master thesis]. Columbus: Ohio State University; 2017.
32. Shaffer SW, Teyhen DS, Lorenson CL, Warren RL, Koreerat CM, Straseske CA, et al. Y-balance test: a reliability study in-volving multiple raters. Mil Med 2013;178:1264-70.
33. Brown KC, Hanson HM, Firmani F, Liu D, McAllister MM, Merali K, et al. Gait speed and variability for usual pace and
pe-destrian crossing conditions in older adults using the GAITRite walkway. Gerontol Geriatr Med 2015;1:2333721415618858. 34. Psarakis M, Greene D, Moresi M, Baker M, Stubbs P, Brodie M,
et al. Impaired heel to toe progression during gait is related to re-duced ankle range of motion in people with Multiple Sclerosis. Clin Biomech (Bristol, Avon) 2017;49:96-100.
35. Webster KE, Wittwer JE, Feller JA. Validity of the GAITRite walkway system for the measurement of averaged and individual step parameters of gait. Gait Posture 2005;22:317-21.
36. Hinkle DE, Wiersma W, Jurs SG. Applied statistics for the be-havioral sciences. 5th ed. Boston (MA): Houghton Mifflin; 2003.
37. McCrea PH, Eng JJ, Hodgson AJ. Time and magnitude of torque generation is impaired in both arms following stroke. Muscle Nerve 2003;28:46-53.
38. Franchi MV, Reeves ND, Narici MV. Skeletal muscle remodel-ing in response to eccentric vs. concentric loadremodel-ing: morphologi-cal, molecular, and metabolic adaptations. Front Physiol 2017;8: 447.
39. Patel PJ, Bhatt T. Fall risk during opposing stance perturbations among healthy adults and chronic stroke survivors. Exp Brain
Res 2018;236:619-28.
40. Horst R, Hummelsheim H, Renner CIE. Effects of increases in plantar flexor strength on gait impairment after stroke: study pro-tocol of a randomized controlled trial. Austin Phys Med 2017;1: 1004.
41. Freire B, Abou L, Dias CP. Equinovarus foot in stroke survivors with spasticity: a narrative review of muscle–tendon morphol-ogy and force production adaptation. Int J Ther Rehabil 2020;27: 1-8.
42. Leung J, Moseley A. Impact of ankle-foot orthoses on gait and leg muscle activity in adults with hemiplegia: systematic liter-ature review. Physiotherapy 2003;89:39-55.
43. Schmid S, Schweizer K, Romkes J, Lorenzetti S, Brunner R. Secondary gait deviations in patients with and without neuro-logical involvement: a systematic review. Gait Posture 2013;37: 480-93.
44. Tirupatamma NL, Kameshwari G, Kumari VS, Madhavi K. To know the effectiveness of Rocker Board training programe on trunk balance and gait in subjects with stroke. Indian J Physiother Occup Ther 2019;13:236-41.