Abstract. Angiogenesis is an essential step in cancer progres-sion and metastasis. Changes in the microRNA (miRNA or miR) expression profiles of endothelial cells (ECs) elicited by cancer cells promote angiogenesis. Vascular endothelial growth factor (VEGF), a key pro‑angiogenic factor, influences miRNA expression in ECs; however, the exact role that VEGF serves in miRNA regulation during angiogenesis is poorly defined. The present study aimed to demonstrate the differ-ential angiogenic effects on human umbilical vein endothelial cells (HUVECs) of five different colorectal cancer (CRC) cell lines by in vitro HUVEC migration and angiogenesis assays in response to CRC-conditioned medium (CM). Among the tested CMs, LoVo was the most effective cell line in eliciting HUVEC angiogenic phenotypes, at least partially due to its high VEGF level. It was also observed that pro‑angiogen-esis-regulatory miRNAs (angio-miRNA) miR-296, miR-132, miR‑105 and miR‑200 were upregulated in the VEGF‑rich LoVo CM compared with the VEGF‑scarce SW620 CM. In addition, treatment with VEGF receptor 2 inhibitor downregu-lated the pro‑angio‑miRNAs, with the exception of miR‑132, suggesting that VEGF, as well as additional signaling, is required for angio‑miRNA expression. Quantitative analyses on pro-angio-miRNA target expression suggested that inde-pendent pathways may be involved in the regulation of their expression. Overall, the data from the present study indicated that multiple paracrine factors, including VEGF secreted by CRCs, effectively modulated angio‑miRNA expression, thus impacting their target expression and the angiogenic pheno-types of HUVECs.
Introduction
Cancer progression and metastasis are supported by angio-genesis in endothelial cells (ECs) (1,2). Under normal conditions, the vasculature is quiescent and stable due to the balance between pro‑ and anti‑angiogenic factors. During the ʻangiogenic switchʼ, the onset of angiogenesis (3,4) which occurs under pathological conditions such as cancer, results in ECs reacquiring their angiogenic ability in response to stimuli that cause the angiogenic switch to tilt towards the pro‑angiogenic factors, which results in the promotion of angiogenesis (5‑7). Among such pro‑angiogenic factors, vascular endothelial growth factor (VEGF) has been thor-oughly studied (2,8). VEGF, secreted from a range of cancer cells in hypoxia, acts as a specific mitogen in ECs and impacts angiogenesis and cancer progression (8,9). EC migration is an essential aspect of angiogenesis; VEGF is one of the migratory signals for ECs (10,11).
Angiogenesis is modulated by a number of microRNAs (miRNAs), which are noncoding RNAs approximately 22 nucleotides in length that regulate gene expression through post‑transcriptional mechanisms (12). Silencing or deficiency of Dicer, which is the major miRNA‑processing enzyme, decreases angiogenesis in ECs (13,14). Accumulating evidence has revealed that VEGF controls angiogenesis‑regulatory miRNA (angio-miRNA) expression and thus can elicit EC angiogenesis (15,16). A previous study has demonstrated that conditioned medium (CM) from human breast carcinoma cells promotes specific miRNA expression that can be reversed by treatment with a VEGF receptor 2 (VEGFR2) inhibitor in ECs (17). These results suggest that exogenous VEGF from cancer-CM serves an important, but not exclusive role in regu-lating miRNA expression. miRNAs with altered expression ultimately regulate the properties of ECs; however, the way in which varying concentrations of VEGF affect the miRNA expression profiles that result in the regulation of EC migra-tion and angiogenesis is currently poorly understood.
The present study was based on the hypothesis that the conditioned media from different colorectal cancer (CRC) cell lines may induce HUVEC's angiogenesis-associated cellular phenotypes. The aim was to differentiate the effects of CRC conditioned media on EC cell migration and in vitro tubule formation.
Colorectal cancer cells differentially impact migration and
microRNA expression in endothelial cells
DO YEI KIM1,2, SANG-SOO LEE1,2 and YOUNG‑KYUNG BAE1
1Center for Bioanalysis, Division of Chemical and Medical Metrology, Korea Research Institute of Standards and Science,
Daejeon 34113; 2Department of Biological Sciences, Korea Advanced Institute of Science and Technology, Daejeon 34141, Republic of Korea
Received January 14, 2019; Accepted August 8, 2019 DOI: 10.3892/ol.2019.11055
Correspondence to: Dr Young‑Kyung Bae, Center for Bioanalysis, Division of Chemical and Medical Metrology, Korea Research Institute of Standards and Science, 267 Gajeong‑ro, Yuseong‑gu, Daejeon 34113, Republic of Korea
E‑mail: [email protected]
Key words: cancer-endothelial interaction, angiogenesis, vascular endothelial growth factor, microRNA expression
Materials and methods
Cell culture and reagents. HUVECs (Lonza Group, Ltd.) were
cultured in extracellular matrix (ECM; ScienCell Research Laboratories, Inc.) supplemented with 5% fetal bovine serum (FBS) and endothelial cell growth supplements (ScienCell Research Laboratories, Inc.); HUVECs of ≤6 passages were used. Human CRC cell lines SW480, SW620, SW48, LoVo and RKO were obtained from the American Type Culture Collection and cultured in RPMI‑1640 (Gibco; Thermo Fisher Scientific, Inc.) supplemented with 10% FBS and 1% peni-cillin-streptomycin (P/S; Gibco; Thermo Fisher Scientific, Inc.) at 37˚C with 5% CO2. HUVECs were treated with 10 ng/ml
recombinant human VEGF165 (PeproTech, Inc.) for 3 or 6 h at
37˚C. For the inhibition of VEGF signaling, HUVECs were treated with 5 µM VEGFR2 inhibitor DMH4 for 18 h at 37˚C (Tocris Bioscience). For the western blot assays, HUVECs cultured for 20 h in either LoVo or SW620 CM as described below. At 20 h, harvested HUVECs were washed with PBS twice and lysed with RIPA lysis buffer (EMD Millipore) for quantification and blotting.
Preparation of CRC‑CM. CRCs were seeded in a T75 flask
(2.1x10⁶ cells/flask) and incubated in RPMI‑1640
supple-mented with 10% FBS and 1% P/S for 48 h, at 37˚C with 5% CO2, until they reached 80% confluence. The medium was
changed to 4 ml EC basal medium (EBM) with 2% FBS and no EC growth supplement and incubated at 37˚C with 5% CO2. After 24 h of incubation, the CMs were collected,
centrifuged at 1, 500 x g for 10 min at room temperature and filtered with a 0.2 µm filter. HUVEC‑CM was obtained as with the preparation of CRC‑CM (except for incubation medium): HUVEC were incubated in ECM supplemented with 5% FBS and growth supplements for 48 h, then medium was changed to 4 ml of EBM with 2% FBS.
Transwell migration assay. Transwell migration assays were
performed using Boyden chambers with 8 µm pores (Corning Inc.). HUVECs were seeded at a density of 5x10⁴ cells/100 µl
EBM in the upper chamber and incubated for 6 h with CRC‑CM in the bottom chamber. Prior to fixation, cells on the upper membrane were removed with cotton swabs. Cells on the membranes were fixed and stained using 0.1% crystal violet for 10 min at room temperature (Sigma‑Aldrich; Merck KGaA). Images were captured using light microscopy at a magnification of x10, and migrated cells were counted using Image J software (version 1.46; National Institutes of Health) in four randomly chosen fields per well. The experiment was repeated four times, and the results were an average of each repetition.
Wound‑healing assay. HUVECs were seeded into a 24‑well
plate and incubated for 24 h to reach ~100% confluence. A scratch-wound was made using a 1,000-µl pipette tip in the HUVEC monolayer, and the medium was changed to CRC-CM. Time-lapse images were captured over 9 h using JuLi™ Br recorder (NanoEnTek Inc.). Image J software was used to determine the wounded area at 0, 3, 6 and 9 h. The percentage of HUVEC‑covered area was calculated using the following formula: Covered area=(wound area at 0 h‑wound
area at T h)/(wound area at 0 h) x100, where T is incubation time. The experiment was repeated twice, and the results were an average of each repetition.
Cell proliferation assay. To investigate cell proliferation,
HUVECs were seeded at a density of 7x10⁴ cells/well into
a 12‑well plate and incubated for 6 h at 37˚C, followed by a medium change to CRC‑CM. At 24 and 48 h of incubation, HUVECs were trypsinized and stained using Trypan blue solution (Thermo Fisher Scientific, Inc.) and counted using a Countess automated cell counter (Invitrogen; Thermo Fisher Scientific, Inc.).
In vitro angiogenesis assay. HUVECs were seeded at a
density of 5x10⁴ cells/well into Matrigel-coated (Corning
Inc.; 5 mg/ml protein) 24‑well plates (18). To investigate the effects of CRC‑CMs on angiogenesis with minimal HUVEC damage, 80% CRC‑CM and 20% ECM was used to culture the HUVECs. HUVECs in ECM (supplemented with growth factors) were used for angiogenesis positive control. Following 12‑ or 24‑h incubations at 37˚C, four images per well were captured at random using light microscopy at a magnifica-tion of x10 for analysis. Tubule lengths were measured using Image J software, and the number of branches was counted by observation. Three biological replicates were included for each condition.
ELISA assay. VEGF levels in each CRC‑CM were quantified
using a human VEGF Quantikine ELISA kit (R&D Systems, Inc.) according to the manufacturer's protocol. The experiment was repeated twice, and the results were an average of each repetition.
Reverse transcription‑quantitative PCR (RT‑qPCR). Total
RNA was extracted using miRNeasy RNA isolation kits (Qiagen GmbH) according to the manufacturer's protocol. Of the collected total RNA, 1 µg was reverse-transcribed into cDNA using a MiR‑X™ miRNA First‑Strand Synthesis kit (Takara Bio, Inc.). To investigate the relative expression levels of miRNAs, RT‑qPCR was performed using Maxima SYBR®
Green/ROX qPCR master mix (Thermo Fisher Scientific, Inc.) on a StepOnePlus real‑time PCR system (Applied Biosystems; Thermo Fisher Scientific, Inc.). The mRQ 3' primer from the MiR‑X™ miRNA First‑Strand Synthesis kit and miRNA‑specific forward primer (Table SI) were used to detect miRNA levels. The final primer concentration was 0.2 µM, and 200 ng cDNA template was used per reaction. The reactions were incubated on a 96‑well plate at 95˚C for 10 min, followed by 40 cycles of 95˚C for 15 sec and 59˚C for 30 sec. The miRNA expression in each sample was normalized to the internal control U6 small nuclear RNA, and relative miRNA expression levels were calculated using the 2-ΔΔCq method (19).
To detect the relative expression levels of the target mRNA in HUVECs, cDNA was synthesized using a PrimeScript RT reagent kit with gDNA eraser (Takara Bio, Inc.). RT‑qPCR was performed under the same thermocycling conditions as for the miRNA experiment, using a target mRNA‑specific primers (Table SII). The target mRNA expression levels in each sample were normalized to GAPDH, and relative mRNA expression levels were calculated using the 2-ΔΔCq method.
Representative amplification and melting curves are presented in Supplementary materials (Fig. S1). The experiment was repeated four times.
Western blotting. For western blot analysis, cell lysate samples
were mixed with 5X SDS sample buffer (cat. no. EBA‑1052; Elpis Biotech, Inc.) and heated at 95˚C for 10 min. The protein was quantified using a Bradford assay, and equal amounts of protein (30 µg) were separated by SDS‑PAGE (10% gel) and transferred onto nitrocellulose membranes (EMD Millipore). Membranes were blocked with 5% non‑fat milk in TBS + 0.05% Tween‑20 (TBST) buffer (Intron Biotechnology, Inc.) and incu-bated for 18 h at 4˚C with a primary antibody. After four washes with TBST, the membranes were incubated with horseradish peroxidase (HRP)‑conjugated secondary antibody in TBST with 5% non‑fat milk. Following washing, protein bands were visualized using the ECL system (Thermo Fisher Scientific, Inc.). The following antibodies were used: Anti‑VEGF receptor 2 (1:500; rabbit; catalog no. ab11939; Abcam); anti-RAS p21 protein activator 1 (RASA1; 1:2,000; rabbit; catalog no. ab40677; Abcam); anti‑hepatocyte growth factor‑regulated tyrosine kinase substrate (1:1,000; rabbit; catalog no. 15087; Cell Signaling Technology Inc.); anti‑GAPDH (1:1,000; mouse; catalog no. 47724; Santa Cruz Biotechnology, Inc.); horse-radish peroxidase‑conjugate anti‑mouse secondary antibody (1:10,000; cat. no. 223‑005‑024; Jackson ImmunoResearch Laboratories, Inc.) or horseradish peroxidase‑conjugate anti-rabbit secondary antibody (1:10,000; cat. no. 323-001-021; Jackson ImmunoResearch Laboratories, Inc.). The western blotting was repeated three times. The western blots presented in the figures are from the same experiment. Image J (version 1.52n; National Institutes of Health) was used to quantify the densitometry of detected bands.
Statistical analysis. Data are presented as the mean ± standard
deviation or standard error as indicated. Student's t‑test was used for comparisons between two samples. Analysis of vari-ance (ANOVA) with the Tukey‑Kramer post hoc multiple comparison test (20) was performed when comparing more than two populations. P<0.05 was considered to indicate a statistically significant difference.
Results
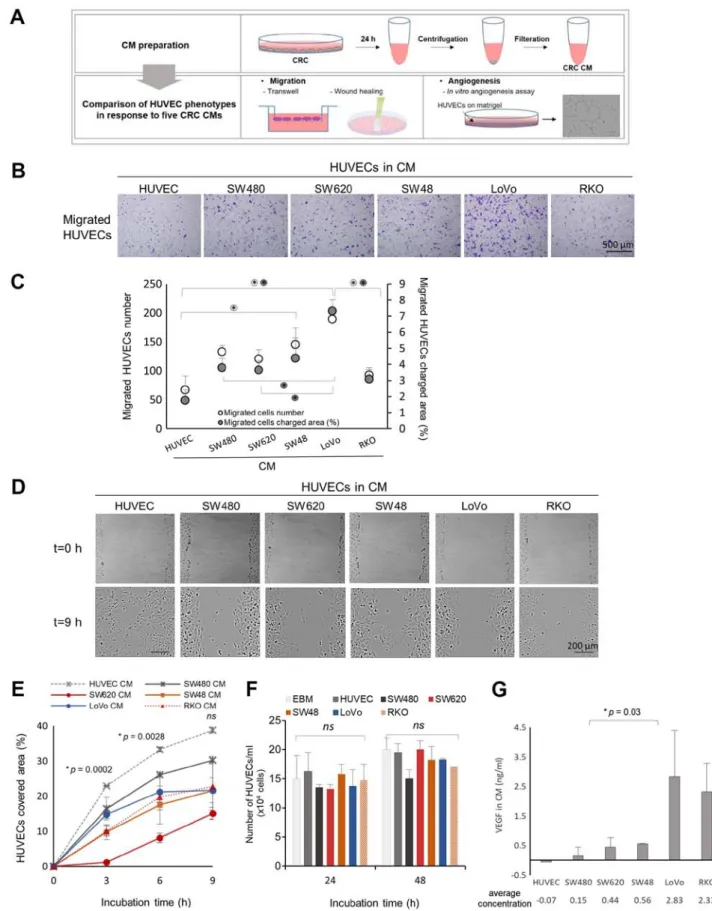
LoVo‑CM induces greater HUVEC migration compared with SW620‑CM in vitro. To assess whether CRC cells affect
HUVEC migration through soluble factors, CMs were prepared using five different CRC cell lines: SW480, SW620, SW48, LoVo and RKO (Fig. 1A). As a negative control, HUVEC‑CM that normalized factors such as autocrine signals. Each of the CMs was administered to HUVECs to compare the effects on migration.
Two distinct migration assays were used: Transwell and wound-healing. Transwell assays were used to measure the extent of HUVEC migration toward the CRC‑CM (chemotaxis) through pores in the insert. After 6 h of CM treatment, the number and the occupied area of migrated HUVECs on the bottom of the inserts were independently measured (Fig. 1B and C). The five CRC‑CMs promoted HUVEC migration in varying degrees compared with the control. Among the tested CMs, LoVo-CM
was the most effective at promoting HUVEC migration (Fig. 1B and C); HUVECs in LoVo‑CM exhibited significant changes in the number of cells and the occupied area compared with the control (Fig. 1C). In addition, a significant increase in the occupied area was observed in LoVo-CM compared with SW620‑ and SW480‑CM.
Wound‑healing assays measure the cell movement in horizontal directions when the cells are exposed to a homo-geneous environment rather than to a gradient. The area covered by HUVECs was measured at 3, 6 and 9 h after the wound‑scratch was made. The five CRC‑CM treatments induced HUVEC migration into the scratched area at distinct rates (Fig. 1D and E). Of note, the HUVEC‑CM control was the most effective at promoting HUVEC migration, which indicated that the presence of autocrine signaling supported the overall migratory capacity. Among the tested CMs, SW620‑CM was the least effective in promoting HUVEC migration in the wound healing assay, whereas SW480‑CM was the most effective when the entire 9 h period was analyzed, followed by LoVo‑CM (Fig. 1E). Compared with those exposed to the least effective SW620‑CM, HUVECs treated with LoVo‑CM exhibited nearly 2‑fold greater migra-tory capacity (Fig. 1E).
By contrast, HUVEC proliferation remained largely unaf-fected by treatment with the five CRC‑CMs (Fig. 1F), indicating that an increase in HUVEC migration does not directly reflect high proliferation rates. CRC‑CMs each possessed differing capacities to induce HUVEC migration; based on the combined results from the Transwell and wound‑healing assays, it can be concluded that SW620‑ and LoVo‑CM demonstrated consider-ably different effects on HUVEC migration.
As VEGF, the most potent pro‑angiogenic factor, can influ-ence HUVEC migration in vitro (8), the present study assessed the levels of VEGF in each CM. Quantification of VEGF concentrations in each CRC-CM revealed that LoVo-CM contained the highest level of VEGF, which was significantly higher compared with that in SW620‑CM (Fig. 1G).
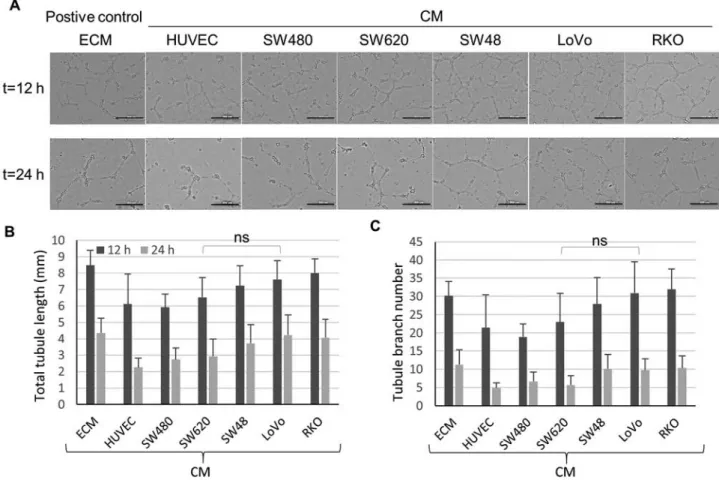
Each CRC‑CM stimulates tube formation in vitro. The present
study then investigated the diverse CRC‑CM effects on tube formation in vitro. HUVECs were cultured in the presence of each CM on Matrigel to promote tube formation. HUVEC tube formation phenotypes were analyzed by measuring the tubule length and the number of branches at 12 and 24 h (Fig. 2A‑C). All five CRC‑CMs mildly induced tube forma-tion compared with the HUVEC-CM control. Although the ANOVA tests revealed no significant differences between the seven conditions, LoVo‑ and RKO‑CM were relatively effec-tive in promoting tube formation, similar to the ECM posieffec-tive control (Fig. 2B and C).
As mentioned above, RKO‑CM exhibited the second highest VEGF level following LoVo‑CM (Fig. 1G); accordingly, the effects of RKO‑CM on tube formation were comparable to those of LoVo‑CM, which were the two most effective CMs. However, HUVEC cell chemotactic migration, which is another representative angiogenic phenotype, was not elicited by RKO‑CM, but only by LoVo‑CM (Fig. 1C), which suggested that RKO‑CM may contain factors that specifically inhibit migra-tory behavior in HUVECs. Based on the phenotypic assays in the present study, two conditions where angiogenic phenotypes
Figure 1. Impacts of five CRC‑CMs on HUVEC migration. (A) Experimental scheme of CRC‑CM preparation and HUVEC migration and angiogenesis assays. (B) Representative images of HUVEC migration in the Transwell assay. There were four biological replicates and four technical repeats. (C) Results of the Transwell assay demonstrate the migrated HUVEC number and charged area in the CRC‑CMs. Error bars, SEM. Significant differences identified by ANOVA followed by Tukey‑Kramer post‑hoc test are indicated; asterisks in clear circles indicate statistically significant differences in the number of migrated cells; asterisks in grey circles indicate statistically significant differences in the area occupied by migrated cells. *P<0.05. (D) Representative images at 0 and 9 h post‑scratch in wound‑healing assay. There were two biological replicates. (E) Results of the wound‑healing assay demonstrate the HUVEC‑covered area within the initial wound following 9‑h incubation in the CRC‑CMs. Error bars, SD. Significant differences identified by ANOVA are indicated. (F) HUVEC proliferation in the CRC‑CMs. Error bars, SD from two technical repeats. No significant differences were identified by ANOVA (G) VEGF concentration in each CRC‑CM. Error bars, SEM from two technical repeats from two biological replicates. One way t‑test assuming unequal variance was performed between SW620 and LoVo CM. ns, not significant; CRC, colorectal cancer; CM, conditioned medium; HUVEC, human umbilical vein endothelial cell; VEGF, vascular endothelial growth factor.
(tube formation and migration) were relatively upregulated (LoVo‑CM) and downregulated (SW620‑CM) were selected to compare the changes in downstream molecular events.
In the migration and in vitro tube formation assays, LoVo‑ and SW620‑CM consistently exhibited discrete capacities for altering HUVEC phenotypes. LoVo‑CM significantly promoted HUVEC migration compared with SW620 (*P<0.05
for migrated cell number; **P<0.01 for Transwell charged area;
Fig. 1C). ANOVA demonstrated that the migrated cell changed area was significantly higher in cells treated with LoVo‑CM compared with SW620‑CM (Fig. 1C). For in vitro tube forma-tion, the overall results were subdued; however, LoVo-CM exhibited a slightly higher capacity to induce tube formation compared with SW620‑CM. Based on the combined results, SW620‑ and LoVo‑CM were selected to compare their effects in HUVEC miRNA expression.
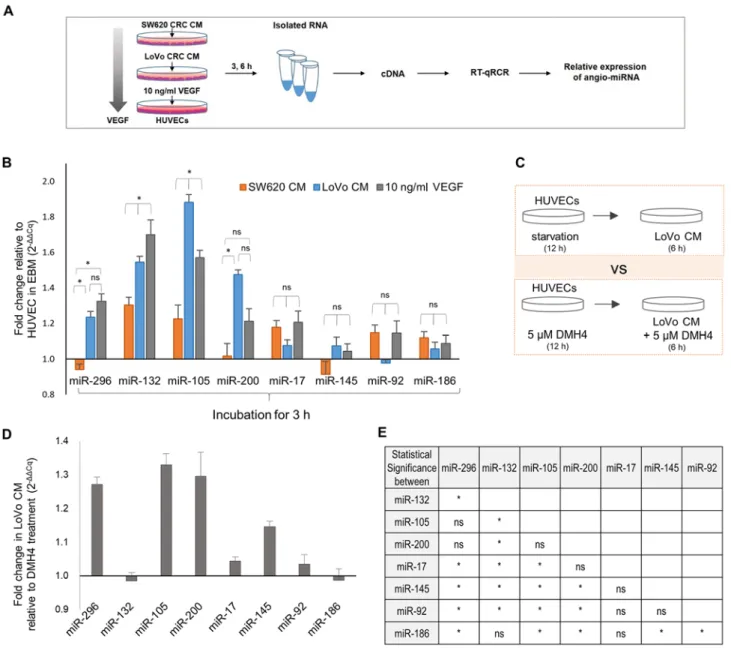
Angiogenesis regulatory miRNAs in HUVECs are differentially expressed following treatment with LoVo‑ and SW620‑CMs. Previous studies have revealed the important
roles of certain miRNAs in EC angiogenesis, which have been termed ʻangiogenesis-regulatory-miRNAs (angiomiR)ʼ (21‑23). Hypothesizing that these miRNAs may be differ-entially expressed in HUVECs cultured in SW620‑ and LoVo-CMs, the present study determined the relative
expression levels of eight selected miRNAs (Table I), based on their influence on angiogenesis and dependency on VEGF signaling for their expression, in HUVECs treated with either CM (Fig. 3A). The expression levels were normalized to those of HUVECs cultured in EBM. Of these miRNAs, miR‑296, miR-132, miR-105 and miR-200, which are pro-angio-miRNA, were significantly upregulated in LoVo‑CM‑treated HUVECs compared with SW620‑CM treatment at 3 h (Fig. 3B). By contrast, miR‑17, miR‑145, miR‑92 and miR‑186, which are anti-angio-miRNAs, were downregulated in LoVo-CM or expressed at a similar level compared with SW620‑CM (Fig. 3B). These results indicated that LoVo‑CM induced pro‑angio‑miRNA expression more effectively compared with SW620‑CM, suggesting its discrete capacity to induce HUVEC migration and tube formation.
As LoVo‑CM was demonstrated to contain significantly higher levels of VEGF compared with SW620‑CM (Fig. 1G), to assess whether the observed differential angio‑miRNA expression observed between SW620‑ and LoVo‑CM was VEGF concentration‑dependent, HUVEC miRNA expression levels following exposure to high concentration recombinant VEGF (10 ng/ml) were compared with those in SW620‑CM (~0.4 ng/ml VEGF) and LoVo‑CM (~2.8 ng/ml VEGF) (Fig. 1G). The relative levels of angio‑miRNA expression were examined after 3 h and compared with the EBM control
Figure 2. Angiogenic effects of each CRC‑CM in in vitro tube formation assays of HUVECs. (A) Representative images of HUVECs forming tubular structures in each CRC‑CM. (B) HUVEC total tubule lengths in ECM positive control and each CRC‑CM. No significant differences were identified among the seven conditions by ANOVA or between SW620‑ and LoVo‑CM by Student's t‑test. (C) The number of tubule branches of HUVECs in ECM control and each CRC‑CM. No significant differences were identified among the seven conditions by ANOVA or between SW620‑ and LoVo‑CM by Student's t‑test. (B and C) The results are a summary of four technical repeats from three biological replicates. Error bars, SEM. Scale bar, 500 µm. ns, not significant; CRC, colorectal cancer; CM, conditioned medium; HUVEC, human umbilical vein endothelial cell; ECM, extracellular matrix.
(Fig. 3B). Upregulation in presence of 2.8 or 10 ng/ml VEGF was observed in three pro-angio-miRNAs miR-296, miR-132 and miR-105, which exhibited incrementally increased expres-sion levels as VEGF concentration rose, with the exception for miR‑105 at 3 h (Figs. 3B and S2A). In addition, miR‑105 and miR-200 demonstrated a similar trend; their expression was more readily upregulated in HUVECs cultured in LoVo-CM compared with 10 ng/ml VEGF at 3 h. This suggested that LoVo‑CM may contain signaling molecules other than VEGF that enable the rapid initial increase in the levels of these miRNAs. Conversely, anti‑angio‑miRNAs miR‑17, miR‑145 and miR‑92 did not exhibit significant changes in the three conditions with different VEGF levels (Figs. 3B and S2A). The levels of miR‑17 at 3 and 6 h, as well as miR‑145 at 6 h were slightly upregulated by SW620‑CM compared with LoVo‑CM, which supported their weak effects on HUVEC angiogenic phenotypes. By contrast, miR‑186, which is independent of VEGF, was not significantly affected by VEGF concentra-tion at either time (Figs. 3B and S2A). Thus, LoVo‑CM may promote pro-angio-miRNA expression in HUVECs, which appeared to be associated with VEGF concentration.
The present study further investigated the extent to which VEGF in LoVo‑CM was responsible for the upregulation of pro‑angio‑miRNA expression by blocking VEGF signaling (Fig. 3C). Compared with the control VEGFR2 inhibitor DMH4 treatment, LoVo-CM-treated HUVECs expressed higher levels
of miR‑296, miR‑105 and miR‑200, but not miR‑132 (Fig. 3D). This suggested that the upregulation of miR‑296, miR‑105 and miR‑200 expression by LoVo‑CM may depend on VEGF signaling. However, miR-132 expression appeared to be medi-ated by signaling independent of VEGF, by factors present in LoVo‑, but not SW620‑CM (Fig. 3B and D). To perform a systematic comparison between microRNAs, the statistical analyses between each possible pair of miRNAs indicated that miR‑132 expression levels were significantly different from other miRNAs, with the exception of miR‑186 (Fig. 3E), suggesting that the expression of miR‑132 is regulated in a distinct manner. Overall, the results from the present study demonstrated that pro-angio-miRNA expression mediated by LoVo-CM was achieved by VEGF or an additional signaling mechanism.
During RT‑qPCR data analysis, a considerable variance in miRNA fold‑changes (2-ΔΔCq) between biological replicates
was observed (Fig. 3B and D). Since multiple steps precede the final RT‑qPCR experiments (Fig. S2B), the present study inves-tigated which of these steps were the major contributors to the variance in the fold‑changes. Biological replicates (HUVECs), RT replicates, in which identical total RNA was separately reverse‑transcribed, and qPCR plate replicates, in which cDNA was subjected to independent qPCRs, were used in the present study. Relative standard deviations (RSDs) of the indicated miRNA fold‑changes were compared (Fig. S2C), and the results indicated that the overall RSDs in miR‑105 and miR‑200 data Table I. Angiogenesis‑regulatory microRNAs subjected to reverse transcription‑quantitative PCR.
Author, year microRNA Induced by VEGF Function in angiogenesis Target (Refs.)
Würdinger et al, miR‑296 Yes Pro‑angiogenesis: VEGF‑VEGFR2 HGS (24)
2008 feedback loop
Anand et al, miR‑132 Yes Pro‑angiogenesis: Increases EC RASA1 (17)
2010 proliferation and tube formation
Zhou et al, miR‑105 Yes Pro‑migration: Promotes HMVEC ZO‑1 (34)
2014 migration
Li et al, miR‑200 Yes Pro‑angiogenesis: Blocking results in THBS1 (35)
2011 decreased cell viability and migration
Otsuka et al, miR‑17 Yes Pro‑angiogenesis TIMP1 (14)
2008
Aday et al, Anti‑angiogenesis: Blocking increases ZNF652, SATL1 (36)
2017 endothelial progenitor cells survival and
angiogenesis
Larsson et al, miR‑145 Yes Anti‑angiogenesis, anti‑migration: Fli1, N‑RAS, (37)
2009
Zou et al, Tumor angiogenesis inhibition VEGF‑A (38)
2012
Bonauer et al, miR-92 Yes Anti-angiogenesis: Overexpression in α5 integrin subunit (39)
2009 ECs blocks angiogenesis
Ma et al, 2017 miR‑186 No Anti‑angiogenesis Atg7, Beclin1 (40)
miR, microRNA; HGS, hepatocyte growth factor‑regulated tyrosine kinase substrate; RASA1, RAS p21 protein activator 1; HMVEC, human microvascular endothelial cells; ZO‑1, zonula occludens; THBS1, thrombospondin‑1; TIMP1, tissue inhibitor of metalloproteinase 1, ZNF652, zinc finger protein 652, SATL1, spermidine/spermine N1‑acetyl transferase‑like 1 protein, Fli1, Friend leukemia virus integration 1; Atg7, autophagy-related protein 7.
were larger compared with those in miR-132 and miR-186 data, which may be due to the relatively low expression of miR‑105 and miR‑200 in HUVECs despite their significant fold‑changes. The RSDs between the three types of replicates demonstrated no clear trend, suggesting that variance in the biological, RT and qPCR steps potentially affected the final results.
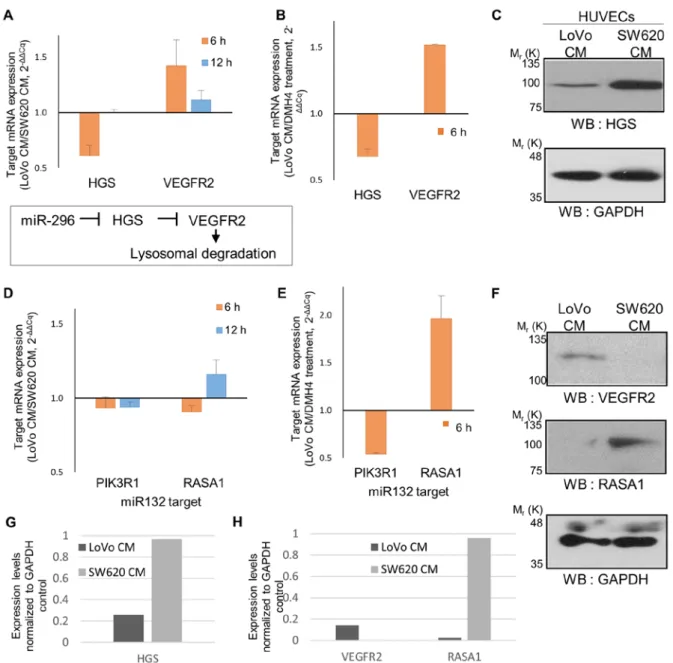
Upregulation of miR‑296 and miR‑132 have distinct effects on their target genes. To verify the altered expression levels of the
angio-miRNAs, their target mRNA expression was determined in LoVo‑CM‑treated HUVECs compared with SW620‑CM treatment. miR‑296 target hepatocyte growth factor‑regulated tyrosine kinase substrate (HGS) inhibits VEGFR2 expres-sion (24); in the present study, HGS mRNA expresexpres-sion was
decreased in LoVo-CM-treated HUVECs compared with SW620‑CM control at 6 h (Fig. 4A), potentially due to the high miR‑296 expression level induced by LoVo‑CM (Fig. 3B). In addition, VEGFR2 mRNA expression, which is negatively regulated by HGS, was increased at 6 h (Fig. 4A). Of note, at 12 h, HGS expression levels were similar in the two conditions, suggesting that they may be strictly regulated. The downstream effects of HGS on VEGFR2 mRNA expression persisted only weakly at 12 h. In addition, high VEGF level in LoVo‑CM activated VEGF signaling in HUVECs, which may control HGS and VEGFR2 through miR‑296 (Fig. 4B). This mechanism may allow sustained positive feedback between VEGF and VEGFR2.
The regulation of target gene expression by miRNAs is achieved not only by target mRNA degradation, but also by
Figure 3. Expression of angio‑miRNAs in HUVECs. (A) Experimental scheme illustrating quantitative analyses of angio‑miRNA expression in HUVECs cultured in Lovo‑CM, SW520‑CM or 10 ng/ml VEGF. (B) Fold‑changes in angio‑miRNA expression in HUVECs treated with LoVo CM relative to SW620 CM were measured by RT‑qPCR. (B) Fold‑changes in angio‑miRNA expression relative to EBM for SW620‑CM, LoVo‑CM and VEGF‑treated HUVECs following 3‑h incubation. Statistical analysis was performed using ANOVA followed by Tukey‑Kramer post‑hoc test. (C) Experimental scheme for VEGFR2 inhibition by DMH4. (D) Fold‑changes in angio‑miRNA expression in HUVECs treated with LoVo‑CM relative to DMH4 treatment. Error bars, SEM. (E) Results of statistical analysis using ANOVA followed by Tukey‑Kramer post‑hoc test of angio‑miRNA expression in HUVECs cultured with LoVo‑CM. Biological replicates, n=4. *P<0.05; ʻnsʼ, not significant. Angio‑miRNA, angiogenesis‑regulatory microRNA; miR, microRNA; RT‑qPCR, reverse tran-scription‑quantitative PCR; CRC, colorectal cancer; CM, conditioned medium; VEGF, vascular endothelial growth factor; HUVEC, human umbilical vein endothelial cell; EBM, endothelial cell basal medium; VEGFR2, VEGF receptor 2; DMH4, VEGFR2 inhibitor.
translation inhibition (25-27). To assess whether the protein levels of representative miRNA targets in HUVECs were affected by treatment with LoVo‑ and SW620‑CM, western blot analysis was performed. When an equal amount of total protein was analyzed with the loading control GAPDH, the level of HGS was demonstrated to be repressed in HUVECs cultured in LoVo‑CM compared with SW620‑CM (Fig. 4C). The trend of VEGFR2 expression level, which is inhibited by HGS, was reversed, showing a higher expression level in LoVo‑CM than SW620‑CM (Fig. 4F). Thus, these two miR-296 downstream targets may be regulated at the mRNA and protein levels.
The expression levels of two miR‑132 targets, PIK3R1 and RASA1, were only slightly decreased in LoVo-CM-treated
HUVECs compared with SW620‑CM‑treated cells at 6 h (Fig. 4D). At 12 h, the mRNA expression of PIK3R1 remained suppressed; however, the expression of RASA1 was restored (Fig. 4D). The RASA1 protein level was lower in HUVECs treated with LoVo‑CM compared with SW620‑CM at 20 h (Fig. 4F). Western blots of GAPDH as the loading control for VEGFR2 and RASA1 is shown in Fig. 4F. The normalized expression levels of these three targets were compared in Fig. 4G and H. This suggested that RASA1 may be regulated by high miR‑132‑induced repression of translation in LoVo‑CM rather than by mRNA degradation. The repeated attempts in the present study failed to detect PIK3R1 protein in the western blot analysis. When VEGF signaling was blocked by the addi-tion of DMH4 to LoVo‑CM, the mRNA level of RASA1, but
Figure 4. Expression of miRNA target mRNAs and proteins. (A) Relative expression levels of HGS and VEGFR2 in LoVo‑CM‑treated HUVECs relative to SW620‑CM. (B) Relative expression levels of HGS and VEGFR2 in LoVo‑CM‑treated HUVECs relative to DMH4 treatment. The mRNA levels were normalized GAPDH, and the results are a summary of two technical repeats from three biological replicates. (C) Upper panel: western blots of HGS. Lower panel: western blots of GAPDH for loading control with for HGS. (D and E) Relative expression levels of PIK3R1 and RASA1 in (E) LoVo‑CM‑treated HUVECs relative to SW620‑CM and (F) in LoVo‑CM‑treated HUVECs relative to DMH4 treatment. (F) Western blots of RASA1 and VEGFR2. Lower panel: western blots of GAPDH for loading control with for VEGFR2 and RASA1. (G and H) Graphs showing the relative expression levels of indicated protein targets, which are normalized to the GAPDH. Error bars, SEM. miRNA, miR, microRNA; HGS, hepatocyte growth factor‑regulated tyrosine kinase substrate; VEGFR2, vascular endothelial growth factor receptor 2; HUVEC, human umbilical vein endothelial cell; CM, conditioned medium; RASA1, RAS P21 protein activator 1.
not PIK3R1, was downregulated (Fig. 4E). As miR‑132 levels were unaffected by DMH4 treatment (Fig. 3D), these results suggested that RASA1 expression may be positively regulated by VEGF signaling independently of miR‑132.
Discussion
Colorectal cancer is the third most commonly diagnosed cancer in the United States and is prone to metastasis (28,29), which is dependent on angiogenesis regulated by cancer-EC interactions in the tumor microenvironment (28). The present study investigated changes in EC angiogenic phenotypes, such as migration and tubule formation, upon treatment with five different CRC‑CMs. The quantitative analyses from the
in vitro migration and tube formation assays indicated that
the CRC-CMs possessed varying capacities to elicit HUVEC phenotypes. In addition, the different HUVEC cellular pheno-types were associated with the amount of secreted VEGF, miRNA expression levels and abundance of target mRNA.
The effects on HUVEC migration were more distinct between CRC‑CMs compared with the effect on in vitro tubule formation. In addition, the results from the two migra-tion assays revealed contradictory effects of the HUVEC‑CM; in the Transwell assay, HUVEC‑CM was the least effective at eliciting HUVEC migration through the Transwell insert among all CMs, whereas it was the most effective in the wound‑healing assay (Fig. 1E). These results may be due to the distinct environment in which the subjected cells reside. Specifically, HUVECs in EBM on the Transwell insert encountered an initial gradient of secreted signaling molecules as the cancer cell-CM was added to the bottom well. This gradient may eventually have reached an equilib-rium, but the initial gradient appeared to affect the behavior of the cells. In the HUVEC‑CM control in the Transwell assay, no such gradient of signaling molecules from cancer cells was present; therefore, the results from the present study suggested that HUVECs may respond to the cancer cell-CM gradient and exhibit chemotactic behavior. By contrast, in the wound-healing assay, HUVECs were incubated in a homogeneous environment for each CM. Thus, the cellular behavior observed in the wound-healing assay was the overall migratory capacity rather than directed movement, such as chemotaxis. The results of the present study suggested that undirected HUVEC migratory behavior was induced the most effectively by the HUVEC‑CM.
Previous reports have suggested that altered expres-sion of endothelial miRNAs by cancer cells is important during angiogenesis (13,14), with VEGF being a major player (11,13). The present study therefore investigated whether VEGF in CM is indeed the key regulator of miRNA expression in HUVECs via a series of quantitative analyses of angio‑miRNA levels. The results revealed that miR‑296 was upregulated in HUVECs in the highly angiogenic and VEGF‑rich LoVo‑CM compared with the less angiogenic and VEGF‑lacking SW620‑CM. The increased expression levels of miR‑296 appeared to be primarily induced by high VEGF concentrations, which in turn downregulated its target mRNA and protein expression, leading to the tight regulation of VEGF signaling, which allows tightly regulated expression levels of VEGFR2.
The amount of VEGF available to ECs is not the only regulator of angio‑miRNA expression levels; other factors, such as tumor-derived exosomes (30,31) and other growth factors from cancer cells, have been reported to affect angio‑miRNA expression (32,33). In the present study, the expression of miR‑296 and miR‑105 appeared to be depen-dent on VEGF concentration, exhibiting a stepwise increase from SW620‑CM to LoVo‑CM and to high‑VEGF media. By contrast, the expression levels of miR‑200 exhibited the strongest upregulation following LoVo‑CM treatment, suggesting that LoVo‑CM contained factors other than VEGF that induced miR‑200 expression. miR‑132 expression appeared to be independent of VEGF, as VEGFR2 inhibitor treatment did not alter miR‑132 expression levels. Of note, the expression levels of the miR‑132 target RASA1 appeared to be increased by high VEGF in LoVo‑CM. RASA1 is a negative regulator of Ras downstream of VEGFR activa-tion (17), and thus elevated RASA1 may control VEGF signaling in miR-132-independent pathways.
In conclusion, the results of the present study demon-strated that VEGF and other soluble factors derived from CRC cells modulated angio-miRNA expression, impacted target mRNA and protein expression and affected angiogenic cellular phenotypes of HUVECs. The results of the quantita-tive analysis of miRNA and mRNA expression, as well as the cellular phenotype assays, may provide valuable insights for the identification of new paracrine molecules that affects ECs. Further studies on the identification of additional factors derived from CRC cells responsible for facilitating angiogenesis are needed.
Acknowledgements
The authors would like to thank Dr Ji Youn Lee at Korea Research Institute of Standards and Science and Dr Ji‑Joon Song at Korea Advanced Institute of Science and Technology for their valuable intellectual input during this study.
Funding
The present study was supported by The Korea Research Institute of Standards and Science (grant nos. GP20180‑11064 and 2018‑011052) and the National Research Council of Science and Technology (grant no. DRC‑14‑2‑KRISS). Availability of data and materials
The datasets used and/or analyzed during the present study are available from the corresponding author on reasonable request.
Authors' contributions
DYK and YKB designed the experiments, analyzed the data and wrote the manuscript. DYK conducted the experiments. SSL conducted the experiments and analyzed the data. Ethics approval and consent to participate
Patient consent for publication Not applicable.
Competing interests
The authors declare that they have no competing interests. References
1. Maishi N and Hida K: Tumor endothelial cells accelerate tumor metastasis. Cancer Sci 108: 1921-1926, 2017.
2. Lopes‑Bastos BM, Jiang WG and Cai J: Tumour‑endothelial cell communications: Important and indispensable mediators of tumour angiogenesis. Anticancer Res 36: 1119-1126, 2016. 3. Bergers G and Benjamin LE: Tumorigenesis and the angiogenic
switch. Nat Rev Cancer 3: 401‑410, 2003.
4. Kazerounian S and Lawler J: Integration of pro‑ and anti‑angio-genic signals by endothelial cells. J Cell Commun Signal 12: 171-179, 2018.
5. Carmeliet P: Angiogenesis in life, disease and medicine. Nature 438: 932‑936, 2005.
6. Abhinand CS, Raju R, Soumya SJ, Arya PS and Sudhakaran PR: VEGF‑A/VEGFR2 signaling network in endothelial cells rele-vant to angiogenesis. J Cell Commun Signal 10: 347‑354, 2016. 7. Wang Z, Dabrosin C, Yin X, Fuster MM, Arreola A, Rathmell WK,
Generali D, Nagaraju GP, El‑Rayes B, Ribatti D, et al: Broad targeting of angiogenesis for cancer prevention and therapy. Semin Cancer Biol 35 (Suppl): S224‑S243, 2015.
8. Shibuya M: Vascular endothelial growth factor (VEGF) and its receptor (VEGFR) signaling in angiogenesis: A crucial target for anti- and pro-angiogenic therapies. Genes Cancer 2: 1097-1105, 2011. 9. Kerbel RS: Tumor angiogenesis: Past, present and the near future.
Carcinogenesis 21: 505-515, 2000.
10. Lamalice L, Le Boeuf F and Huot J: Endothelial cell migration during angiogenesis. Circ Res 100: 782‑794, 2007.
11. Michaelis UR: Mechanisms of endothelial cell migration. Cell Mol Life Sci 71: 4131‑4148, 2014.
12. Filipowicz W, Bhattacharyya SN and Sonenberg N: Mechanisms of post‑transcriptional regulation by microRNAs: Are the answers in sight? Nat Rev Genet 9: 102‑114, 2008.
13. Kuehbacher A, Urbich C, Zeiher AM and Dimmeler S: Role of dicer and drosha for endothelial MicroRNA expression and angiogenesis. Circ Res 101: 59-68, 2007.
14. Otsuka M, Zheng M, Hayashi M, Lee JD, Yoshino O, Lin S and Han J: Impaired microRNA processing causes corpus luteum insuf-ficiency and infertility in mice. J Clin Invest 118: 1944‑1954, 2008. 15. Howe GA, Kazda K and Addison CL: MicroRNA‑30b controls
endothelial cell capillary morphogenesis through regulation of transforming growth factor beta 2. PLoS One 12: e0185619, 2017. 16. Chamorro-Jorganes A, Lee MY, Araldi E, Landskroner‑Eiger S,
Fernández‑Fuertes M, Sahraei M, Quiles Del Rey M, van Solingen C, Yu J, Fernández‑Hernando C, et al: VEGF‑induced expression of miR‑17‑92 cluster in endothelial cells is medi-ated by ERK/ELK1 activation and regulates angiogenesis. Circ Res 118: 38‑47, 2016.
17. Anand S, Majeti BK, Acevedo LM, Murphy EA, Mukthavaram R, Scheppke L, Huang M, Shields DJ, Lindquist JN, Lapinski PE, et al: MicroRNA‑132‑mediated loss of p120RasGAP activates the endothelium to facilitate pathological angiogenesis. Nat Med 16: 909‑914, 2010.
18. DeCicco‑Skinner KL, Henry GH, Cataisson C, Tabib T, Gwilliam JC, Watson NJ, Bullwinkle EM, Falkenburg L, O'Neill RC, Morin A and Wiest JS: Endothelial cell tube formation assay for the in vitro study of angiogenesis. J Vis Exp 1: e51312, 2014.
19. Livak KJ and Schmittgen TD: Analysis of relative gene expres-sion data using real-time quantitative PCR and the 2(‑Delta Delta C(T)) method. Methods 25: 402‑408, 2001.
20. McHugh ML: Multiple comparison analysis testing in ANOVA. Biochem Med (Zagreb) 21: 203-209, 2011.
21. Wang S and Olson EN: AngiomiRs‑key regulators of angiogen-esis. Curr Opin Genet Dev 19: 205‑211, 2009.
22. Zhuang G, Wu X, Jiang Z, Kasman I, Yao J, Guan Y, Oeh J, Modrusan Z, Bais C, Sampath D and Ferrara N: Tumour-secreted miR-9 promotes endothelial cell migration and angiogenesis by activating the JAK‑STAT pathway. EMBO J 31: 3513‑3523, 2012.
23. Landskroner‑Eiger S, Moneke I and Sessa WC: miRNAs as modulators of angiogenesis. Cold Spring Harb Perspect Med 3: a006643, 2013.
24. Würdinger T, Tannous BA, Saydam O, Skog J, Grau S, Soutschek J, Weissleder R, Breakefield XO and Krichevsky AM: miR‑296 regulates growth factor receptor overexpression in angiogenic endothelial cells. Cancer Cell 14: 382‑393, 2008. 25. Bagga S, Bracht J, Hunter S, Massirer K, Holtz J, Eachus R and
Pasquinelli AE: Regulation by let‑7 and lin‑4 miRNAs results in target mRNA degradation. Cell 122: 553-563, 2005.
26. Humphreys DT, Westman BJ, Martin DI and Preiss T: MicroRNAs control translation initiation by inhibiting eukary-otic initiation factor 4E/cap and poly(A) tail function. Proc Natl Acad Sci USA 102: 16961-16966, 2005.
27. Wilczynska A and Bushell M: The complexity of miRNA‑medi-ated repression. Cell Death Differ 22: 22‑33, 2015.
28. Sun W: Angiogenesis in metastatic colorectal cancer and the benefits of targeted therapy. J Hematol Oncol 5: 63, 2012. 29. Siegel RL, Miller KD and Jemal A: Cancer statistics, 2018. CA
Cancer J Clin 68: 7-30, 2018.
30. Umezu T, Ohyashiki K, Kuroda M and Ohyashiki JH: Leukemia cell to endothelial cell communication via exosomal miRNAs. Oncogene 32: 2747‑2755, 2013.
31. Wang J, Wang Y, Wang Y, Ma Y, Lan Y and Yang X: Transforming growth factor β-regulated microRNA-29a promotes angiogen-esis through targeting the phosphatase and tensin homolog in endothelium. J Biol Chem 288: 10418‑10426, 2013.
32. Wang W, Zhang E and Lin C: MicroRNAs in tumor angiogen-esis. Life Sci 136: 28‑35, 2015.
33. Salinas-Vera YM, Marchat LA, Gallardo‑Rincón D, Ruiz‑García E, Astudillo‑De La Vega H, Echavarría‑Zepeda R and López‑Camarillo C: AngiomiRs: MicroRNAs driving angiogenesis in cancer (Review). Int J Mol Med 43: 657‑670, 2018.
34. Zhou W, Fong MY, Min Y, Somlo G, Liu L, Palomares MR, Yu Y, Chow A, O'Connor ST, Chin AR, et al: Cancer-secreted miR-105 destroys vascular endothelial barriers to promote metastasis. Cancer Cell 25: 501‑515, 2014.
35. Li YX, Liu DQ, Zheng C, Zheng SQ, Liu M, Li X and Tang H: miR‑200a modulate HUVECs viability and migration. IUBMB Life 63: 553‑559, 2011.
36. Aday S, Zoldan J, Besnier M, Carreto L, Saif J, Fernandes R, Santos T, Bernardino L, Langer R, Emanueli C and Ferreira L: Synthetic microparticles conjugated with VEGF165 improve the survival of endothelial progenitor cells via microRNA‑17 inhibi-tion. Nat Commun 8: 747, 2017.
37. Larsson E, Fredlund Fuchs P, Heldin J, Barkefors I, Bondjers C, Genové G, Arrondel C, Gerwins P, Kurschat C, Schermer B, et al: Discovery of microvascular miRNAs using public gene expres-sion data: MiR‑145 is expressed in pericytes and is a regulator of Fli1. Genome Med 1: 108, 2009.
38. Zou C, Xu Q, Mao F, Li D, Bian C, Liu LZ, Jiang Y, Chen X, Qi Y, Zhang X, et al: MiR‑145 inhibits tumor angiogenesis and growth by N‑RAS and VEGF. Cell Cycle 11: 2137‑2145, 2012. 39. Bonauer A, Carmona G, Iwasaki M, Mione M, Koyanagi M,
Fischer A, Burchfield J, Fox H, Doebele C, Ohtani K, et al: MicroRNA‑92a controls angiogenesis and functional recovery of ischemic tissues in mice. Science 324: 1710‑1713, 2009.
40. Ma Y, Wang P, Xue Y, Qu C, Zheng J, Liu X, Ma J and Liu Y: PVT1 affects growth of glioma microvascular endothelial cells by negatively regulating miR‑186. Tumor Biol 39: 1010428317694326, 2017.
This work is licensed under a Creative Commons Attribution-NonCommercial-NoDerivatives 4.0 International (CC BY-NC-ND 4.0) License.