R E S E A R C H A R T I C L E
Open Access
Context-dependent transcriptional regulations
between signal transduction pathways
Sohyun Hwang
1, Sangwoo Kim
1, Heesung Shin
2, Doheon Lee
1*Abstract
Background: Cells coordinate their metabolism, proliferation, and cellular communication according to environmental cues through signal transduction. Because signal transduction has a primary role in cellular processes, many experimental techniques and approaches have emerged to discover the molecular components and dynamics that are dependent on cellular contexts. However, omics approaches based on genome-wide expression analysis data comparing one differing condition (e.g. complex disease patients and normal subjects) did not investigate the dynamics and inter-pathway cross-communication that are dependent on cellular contexts. Therefore, we introduce a new computational omics approach for discovering signal transduction pathways regulated by transcription and transcriptional regulations between pathways in signaling networks that are
dependent on cellular contexts, especially focusing on a transcription-mediated mechanism of inter-pathway cross-communication.
Results: Applied to dendritic cells treated with lipopolysaccharide, our analysis well depicted how dendritic cells respond to the treatment through transcriptional regulations between signal transduction pathways in dendritic cell maturation and T cell activation.
Conclusions: Our new approach helps to understand the underlying biological phenomenon of expression data (e.g. complex diseases such as cancer) by providing a graphical network which shows transcriptional regulations between signal transduction pathways. The software programs are available upon request.
Background
Signal transduction is the primary process by which cells coordinate their metabolism, proliferation, and cellular communication according to environmental signals such as hormones, nutrients, and other chemical stimuli. Cells sense environmental signals by receptor proteins which convert the signals into various responses through signal transduction that are dependent on cellu-lar contexts such as signals, receptor proteins that cells possess, and intracellular machinery by which cells inte-grate and interpret the signals [1]. For example, the JAK-STAT signal transduction pathway, which provides one of the most direct routes from cell-surface receptors to a nucleus, is activated by more than 30 cytokines of soluble mediators in cell communication. The cellular responses are different according to their cytokines even
though they are stimulated by the same JAK-STAT sig-nal transduction pathway [1].
As well as for various responses stimulated by signal transduction pathways or signaling pathways, recent arti-cles have presented abundant evidence for inter-pathway cross-communication according to cellular contexts [2-4]. Cytokine signaling which is critical in immune system regulates functions of other signaling pathways either by transcription-mediated consequences of cytokine signal-ing or by transcription-independent mechanisms [2]. As an example of transcription-mediated mechanisms, inter-feron gamma activates signal transduction pathways of toll-like receptors (TLRs) by inducing expression of TLRs [5]. An example of transcription-independent mechan-isms, Bezbradica and Medzhitove [2] suggested that lat-eral interactions between cytokine receptors and other cellular receptors may explain how different cells induce their cell-type specific responses with a highly limited set of janus kinase (JAK) and signal transducer and activator of transcription (STAT) signaling proteins.
* Correspondence: [email protected] 1
Department of Bio and Brain Engineering, KAIST, 373-1 Guseong-dong, Yuseong-gu, Deajeon, Republic of Korea
Full list of author information is available at the end of the article
© 2011 Hwang et al; licensee BioMed Central Ltd. This is an Open Access article distributed under the terms of the Creative Commons Attribution License (http://creativecommons.org/licenses/by/2.0), which permits unrestricted use, distribution, and reproduction in any medium, provided the original work is properly cited.
Among the two mechanisms of cross-communication between signaling pathways according to cellular con-texts, we focus on the transcription-mediated mechan-ism that can be inferred by integrating omics data as well as genome-wide expression data. Various methods analyzing expression data by integrating omics data have been employed to infer sub-networks perturbed at cellu-lar context with protein-protein interaction (PPI) data [6-10]. Ideker et al. [8] first proposed to identify sub-networks by devising an adequate scoring function on PPI networks based on the significant changes in gene expression. By adapting the scoring concept, many simi-lar approaches have improved the search algorithms [10] or scoring functions [6,9]. However, previous approaches that inferred sub-networks did not provide transcription-mediated communication between signal-ing pathways, because they could not identify signalsignal-ing pathways regulated by transcription at cellular contexts and PPI data have the noise problem [11].
Therefore, we propose a new computational omics approach for discovering signaling pathways regulated by transcription, Transcription-Regulating Signaling Path-ways (TRS PathPath-ways) and transcriptional regulations between pathways in Transcription-Regulating Signaling Networks (TRS Networks) that are dependent on cellular contexts. In this approach, cellular contexts are restricted to the experimental condition of expression data. TRS Pathways are signaling pathways of which some proteins are regulated by transcription according to the context of expression data. Signaling pathways are chains of proteins relaying a signal from ligands or transmembrane proteins to transcription factors, or some proteins whose roles are clearly known such as caspase3 [1,12]. Proteins regulated by transcription represent the mRNA expression levels of proteins at the context which are significantly changed. TRS Networks are sub-networks which result from tran-scriptional relation between TRS Pathways. Applied to dendritic cells treated with lipopolysaccharide, we found several biological facts and transcriptional regulations as examples of inter-pathway cross-communication, related to dendritic cell maturation and T cell activation.
Methods
Our system comprises three major steps: (1) constructing a human omics network from PPIs and Protein-DNA (PD) interactions; (2) identifying TRS Pathways by two strategies: three constraints to reduce the search space for TRS Pathways and designing a scoring function for TRS Pathways; (3) identifying the TRS Networks by a search algorithm. After explaining these three major steps of the system, we briefly explain the scoring function for TRS Networks, designed to compare with sub-networks inferred by previous methods, expression data analyses and kinase reaction annotations.
Constructing a human omics network
A human omics network is a directed graph comprising Protein-Protein Interactions (PPIs) and Protein-DNA (PD) interactions. The interactions were collected from three types of data: PPI, PD, and KEGG database. Firstly, PPI data were from four public databases; BioGRID ver-sion 2.0.26 [13], IntAct [14], HPRD Release 7 [15], and MINT [16]. Secondly, the PD interaction data were from three public data; the results of ORFeome-based analysis [17], bZIPDB [18], and MSigDB [19]. Thirdly, we added the PPI and PD interaction data of KEGG [20] into the above integrated PPI and PD data, because they missed many signaling PPI interactions in the KEGG database (Figure S1). Even though adding KEGG interactions into the omics network can cause a circularity problem of the results, we proved that it is a useful and necessary method to find new pathways that do not exist in KEGG pathways from searching the omics network (Figure 1). These interaction data, collected from the eight databases, were integrated based on the Entrez gene information at NCBI providing abundant external references to other databases [21]. The integrated omics network comprises 10,960 nodes and 113,220 edges. Since PPI interactions from four public PPI database have no directional infor-mation, one PPI was transformed into two PPIs having opposite directions.
The two strategies for identifying TRS Pathways
Because finding the highest-scoring connected sub-networks like TRS Pathways in the entire interaction network is a NP-hard problem [8], we adopted two stra-tegies. The first strategy is to reduce the search space for TRS Pathways by three constraints. The second is to find the pathways only with top scores by defining the scoring function for a TRS Pathway.
The first strategy for identifying TRS Pathways: three constraints to reduce the search space for TRS Pathways
The first strategy for identifying TRS Pathways is to reduce the search space of the entire network for TRS Pathways by three constraints. The three constraints are based on three previous approaches mining candidate sig-naling pathways from PPI data, given a pair of starting and ending proteins [12,22,23]. Firstly, we search for TRS Pathways relaying a signal from 1,728 start proteins to 479 end proteins. According to the definition of signaling pathways by which cells convert extracellular signals into cellular responses [1], start proteins are defined as ligand or transmembrane proteins; end proteins as transcription factor proteins or some proteins whose roles are clearly known in cells. 1,728 Start proteins and 479 end proteins were found by searching three databases: 1,310 trans-membrane proteins as start proteins from the Locate data-base [24]; 236 transcription factors as end proteins from
the PD interaction data; 418 start (e.g. ligand proteins) and 243 end proteins (roles are clearly known in cells, e.g. cas-pase8) from the KEGG database [20]. These 243 end pro-teins are terminal nodes of KEGG signaling pathways linked to other signaling pathways or biological processes such as apoptosis.
Secondly, because signals are transmitted from an extra-cellular region into a nucleus, we defined the right orders of pathways as the following: from an extracellular region to a plasma membrane, from a plasma membrane to cyto-plasm and from cytocyto-plasm to a nucleus. When we search for TRS Pathways, we remove edges whose directions are opposite to the right orders such as from a plasma mem-brane to an extracellular region. Removing the opposite edges can lead to the loss of some feedback regulation processes between PPIs, but is an indispensible step to
make the complex PPI data into a simple signaling path-way model to deal with. Moreover, since we can identify the transcriptional feedback regulation processes from the PD interaction data, the processes can compensate the loss defect. The sub-cellular localization data were from Locate database [24]. Lastly, we search for TRS Pathways whose path lengths are less than or equal to 10, since the path lengths of all signaling paths in the KEGG database [20] are distributed from 1 to 10 (Figure S2). We search the KEGG database for all signaling paths with the found start and end proteins, then count their path lengths.
The second strategy for identifying TRS Pathways: the scoring function and search algorithm
The other strategy is to find the pathways only with the top scores by defining the scoring function for a TRS
Figure 1 TRS Pathways relaying of a signal from TNF to NFKB. Each node represents a protein whose name follows the gene name. The color indicates its expression levels (fold change): red (≥ 3), orange (≥ 2 and < 3), yellow (≥ 1 and < 2), light yellow (≥ 0.5 and <1), white (> -0.5 and < 0.5), light cyan (> -1 and≤ -0.5), cyan (> -2 and ≤ -1) and navy blue (> -3 and ≤ -2) and blue (≤ -3). The small UB and P circles represent ubiquitins and phosphates. (A) One of the known pathways from TNF to NFKB [35]. (B) In the KEGG TRS Pathway relaying a signal from TNF to NFKB, MAP3K1 (mekk1) is used as IKB kinase kinase (IKKK). (C) The omics network TRS Pathway seems to select each protein from its corresponding protein complex of (A) to make a linear path. The expression condition is 2h after the LPS treatment.
Pathway. Let N and E represent a set of nodes and edges of a TRS Pathway respectively. The scoring function P(N,E) is the sum of the two functions T(N) and R(E);
P( , )N E =T( )N +R( ).E (1) T(N) measures how many nodes in a TRS Pathway are regulated by transcription. This measure is based on the method of Ideker et al. [8].
T( )N = Zstart +Zend +S( ).N (2) Zstartand Zend represent the Z score values of the start
and end nodes of a TRS Pathway. Z score Zi=F-1(1-pi)
is converted from the p value piof a gene i to a
signifi-cance level, where F-1is the inverse normal cumulative density function. The pi value is acquired from the
results of the expression data analysis.
S( ) (Z );Z Z | | . | | | | N N N N N N i i N = − = ∈
∑
1 (3) We sum the Ziover all |N| genes in a TRS Pathway toproduce an aggregate Z score (ZN) for a TRS Pathway.
Then, in order to properly capture the connection between expression and network topology, we investi-gate whether the score ZN of a TRS Pathway in Eq. (3)
is higher than expected relative to a random set of genes. We randomly take 100,000 samples from all gene sets of size k using a Monte Carlo approach and calcu-late their scores ZN. The mean μk and standard
devia-tion (SD) sk for each k are estimated and the noise in
the estimates is reduced using a sliding window average. Using these estimates, the corrected score S(N) is calcu-lated. The corrected score of random TRS Pathways is guaranteed to have a mean ofμ = 0 and SD s = 1.
R(E) estimates how reliable PPIs in a TRS Pathway are. Estimating the PPI reliability R(E) of a TRS Path-way is absolutely necessary to indentify the signaling pathways consisting of PPIs [12], because the PPI data are noisy [11]. In this study, we adopt Bebek and Yang’s method based on a logistic regression model [25]. The model represents the probability of a true interaction Pr( | ) exp( ) ( ) ( ) I X x i i o m m i m = + − − =
∑
1 1 1 4 as a function of four observed random variables
X( )i =(X1( )i ,...,X( )4i) on a pair of proteins: (1) the
observed number of papers in which the interaction between two proteins was observed, (2) the Pearson correlation coefficient of expression measurements of the corresponding genes, (3) the proteins’ small world clustering coefficient [26], and (4) the binary (0/1)
protein subcellular localization data of interacting pro-teins [27]. When interacting propro-teins co-localize in the same subcellular location, we give 1 to the interacting protein pair.
Given positive and negative training data sets, one can optimize the parameters (b0,...,b4) to maximize the
like-lihood of the data. To optimize the parameters, we use the lrm function of the Design R package. We randomly select 5,000 PPIs from 12,363 determined by coimmu-noprecipitation as our positive training data set [28]. For the negative training data set, we also randomly select 5,000 PPIs that are not in the interactions. Firstly, we selected 1,000 PPIs for each positive and negative train-ing data as carried out by Bebek and Yang [12]. How-ever, since the number of the entire PPIs was higher than that of Bebek and Yang, we had to increase the training data set to 5,000 PPIs. We repeat these experi-ments 1,000 times and estimate the mean reliability of each PPI. To calculate a reliability score R(E) of a TRS Pathway, we take the same procedure of estimating the corrected expression score S(N) from the ZNscores of a
TRS Pathway. For an edge of TRS Pathways, we did not use PPIs which reliability scores were less than 0.6 (about 85 quantile) (Figure S3).
R( ) (Y );Y Y Y I | | ; Pr( ). | | | | E E E E E E i i E i i = − = 1
∑
∈ = (4) To search for the top path score TRS Pathways, we used Dijkstra’s algorithm [29]. Although we reduce the search space for TRS Pathways by three constraints, it is still impossible to search for all possible TRS Pathways in a few days. Also, we do not have to find them all. However, other alternative pathways of the same start and end nodes may also be important, just as the high-est-scoring path in cell biology. Therefore, we slightly modified Dijkstra’s algorithm, which searches for only the smallest-scoring path, to identify TRS Pathways with several top path scores. The statistical significance of TRS Pathways is measured by randomly permutating the expression of individual genes and performing the same search for TRS Pathways 1,000 times.Identification of TRS Networks by a search algorithm
The following is the pseudo code of a search algorithm for a TRS Network. Input: an entire omics network G, all TRS Pathways relevant to the context, and a start gene. If the start gene is not given, the start gene is determined as the start node of the highest scoring TRS Pathway.
Output: a sub-network Gpof G
(1) Initialize Gp by the top ranked TRS Pathway
(2) Add the end node of the initial TRS Pathway into Queue;
(3) WHILE end nodes exist in Queue (4) POLL an end node e,
(5) FOR i = 1 to n of outgoing edges of e;
(6) IF a target node tiof eiis a DEG (Differentially
Expressed Gene) or exists in Gp, add tiand eiinto Gp;
(7) IF added ti is a start node, a DEG, and
posi-tively regulated, add the top ranked TRS Pathways of tiinto Gpand add the end node of the top ranked
TRS Pathways into Queue;
(8) IF added ti is an end and DEG, add ti into
Queue;
(9) Output Gpand its score.
The above search algorithm represents the following; by the top ranked TRS Pathway, the signal is trans-mitted into the end nodes. The activated end nodes carry out their own roles in cells; transcription feedback regulation, enzyme activity or inducing the expression of new start proteins. The newly activated start proteins can send signals to other end nodes, thus we added the TRS Pathways activated by start proteins of a positively regulated DEG into the TRS Network. Since there are so many TRS Pathways at context, we have to select only the highly significant TRS Pathways for adding a TRS Network. The newly added end nodes also carry out their own roles in cells. Therefore, we repeat this process until there is no protein in the Queue.
The scoring function for TRS Networks for sub-network comparison
The scoring function for a TRS Network SF( , ) com-prises three parts: how much its nodes are differentially expressed S(), how many significant TRS Pathways P( , ) it includes, and how many edges || it has
S( , ) = ln ( ) ln ( , ) ln | |,S + P − (5) S ( ) (Z );Z Z Z | | ; ( ), | | | | = − = = − ∈ −
∑
… 1 11 i i i Φ pi (6) P( , )=∑
i= P Pi; = ( , )=T( )+R( ), n i P N Ei i Ni Ei 1 (7) here =Uin=0Ni, =Uin=0Ei.In order to calculate S(), we use the same function for the expression score of a TRS Pathway (See Eq. (3)). Piis the score value (See Eq. (1)) of the ith TRS Pathway
in a TRS Network. Niand Ei also represent nodes and
edges of ithTRS Pathway. N0 and E0 represent a set of
nodes and a set of edges which do not belong to any TRS Pathway, respectively. They have a role to inter-connect TRS Pathways. To assess the statistical signifi-cance of TRS Networks, we take the same procedure in estimating the TRS Pathways by randomly permutating the expression of individual genes and performing the same search for TRS Networks 1,000 times.
Expression data analysis
We investigated dendritic cells treated with lipopolysac-charide (LPS), one of the TLR agonists. TLRs are very important innate receptors that sense microbial pro-ducts and trigger dendritic cell maturation and cytokine production, effectively bridging innate and adaptive immunity [30]. We downloaded GSE2706 data from the GEO database [31] and analyzed the data with limma [32]. The limma results were used in three different ways. Firstly, we used the probability values (p values) of genes for the scoring function. Secondly, we selected genes for which the probability value was p < 0.05 as differential expressed genes for the identification of TRS Networks by a search algorithm. When we compared the performance of the TRS Network identification according to several DEG cut-off p values, p < 0.05 was one of the best performances (Figure S4). Lastly, we used fold changes of gene expression for the color of protein nodes in the networks.
Kinase reaction annotation
Since phosphorylation is one of the most important and critical processes in the signal transduction pathway, we annotate TRS Networks with the relationships between kinases and their substrates [33,34]. We believe that the kinase reaction annotation makes the TRS Networks more reliable and more meaningful for a biological understanding.
Results
TRS Pathways found by searching KEGG pathways and the human omics network
To find which signaling paths are regulated by tran-scription in our known knowledge, we searched the KEGG pathways [20] for TRS Pathways in dendritic cells 2h after the LPS treatment. The top TRS Pathways can be ranked by the two scores: the expression score and the path score (Additional file 1: Table S1). The expression score is an aggregated expression score S(N) (Eq. (3)) and the path score is our own path scoring function (Eq. (1)). Among all in the expression score, the path from TNF to MAPK12 (p38) was the highest-scoring and among all in the path score, the path from TNF to NFKB1 (p50) was the highest-scoring.
From the viewpoint of understanding the underlying biological phenomena of cellular contexts, the path from
TNF to NFKB1 found by our path scoring function is more helpful, though it is difficult to determine which is more significant than the other. Let us suppose that intermediate signaling proteins exist to some extent in a cell to quickly respond to an environmental signal. Then, when the mRNA expression level of the start node of a path increases, we expect that the signal start-ing from the start node would be transmitted to the end protein of the path. Likewise if the mRNA expression level of the end node of a path increases, we also expect that the biological process of the end node would occur. In the path from TNF to NFKB, both the mRNA expres-sion levels of the start node TNF and the end node NFKB1 were increased. The signal starting from TNF would be transmitted to NFKB1 and NFKB1 would acti-vate the mRNA expression levels of its target genes as a transcription factor. Therefore, we can identify more explicable paths by using our path scoring function, adding the expression scores of the start and end node of a path (Zstartand Zendof Eq. (2)) into the aggregated
expression score, than by using just the aggregated score.
A TRS Pathway from TNF to NFKB1 was the highest-scoring when we searched the omics network with our path scoring function (See Eq. (1) and Methods). We compared it with the highest-scoring TRS Pathway of KEGG, since both pathways have the same start and end nodes (Figure 1). However, their intermediate nodes were shown to be quite different. Unless we thought of the actual biological system where a protein complex is usually used rather than a single protein for sending a signal, we could not recognize that the TRS Pathway of the omics network is also correct. The TRS Pathway of the omics network (Figure 1C) seems to be constructed by selecting each protein from its corresponding protein complex of Figure 1A to make a linear path.
The signaling pathway of Figure 1A has not been included in KEGG pathways, but it was already known in a paper [35]. This shows that our TRS Pathway method suggests highly reliable TRS Pathway candidates by searching the omics network. Moreover, we also con-firmed that our analysis can search not only highly reli-able but also significantly regulated TRS Pathways from the omics network by assessing their significances quanti-tatively (See Methods). The TRS Pathway score (13.635) of the omics network (Figure 1C) was higher than that (11.936) of KEGG (Figure 1B), and the TRS Pathway p value (2.428e-4) of the omics network was lower than that (1.476e-3) of KEGG (Additional file 1: Table S2).
The first pathway sending a signal from LPS to the nuclear factor of kappa light polypeptide gene enhancer in B-cells (NFKB) was unfortunately hardly regulated by transcription. Not only was the path score low, but so was its expression score that we could not identify this
pathway as a TRS Pathway. It was the correct result because the first pathway was not a TRS Pathway but a relevant signaling pathway in this context. These results shows that our TRS Pathway analysis can search highly reliable TRS Pathway candidates regulated by transcrip-tion according to cellular contexts well, even though it cannot guarantee to find all the relevant signaling path-ways to the contexts. In our analysis, we fortunately knew that TLR4 senses LPS as the start protein that initiates all relevant signaling pathways. Therefore, we could identify transcriptional regulations between the first pathway and other signaling pathways in TRS Net-works, though not when searching for TRS Pathways.
TRS Networks found by searching the omics network
We found that the TLR signaling pathway and Apopto-sis are the most relevant and known pathways among all the KEGG pathways 2h after the LPS treatment, by Impact analysis [36]. Impact analysis is one of the best methods ordering known pathways by estimating how each pathway is over-represented in a specific context. However, a major drawback to analyses using known pathways is that the large number of genes are unin-volved in pathways or have no functional classification [37]. Even though we discovered the over-represented pathways in the context of expression data, we could not sometimes find out the new understanding of the biological phenomenon. Therefore, these two pathways are not the TRS Networks we wanted to discover but the most relevant and known pathways in this context.
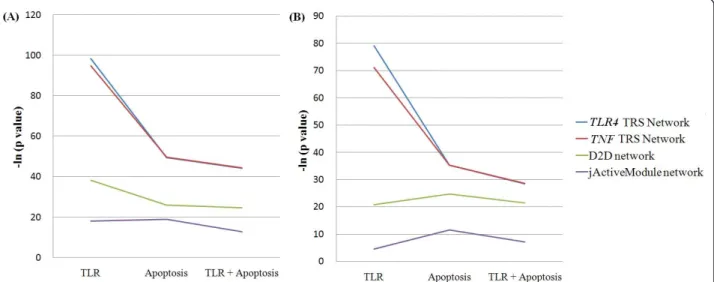
We used two pathways, the TLR signaling pathway and Apoptosis, to prove that our TRS Network approach finds more known nodes and edges than other previous approaches. The larger the overlap of a net-work with the two known pathways, the more known nodes and edges the approach constructing the network finds. To compare, two previous methods inferring sub-networks from omics sub-networks were used: a jActiveMo-dule network and a D2D network. A D2D network is constructed by linking DEGs with their corresponding PPIs [7]. A jActiveModule network is inferred from the omics network using Cytoscape [38]. The jActiveModule analysis infers sub-networks perturbed at the condition with thousands of PPI data by devising an adequate scoring function on PPI networks based on the signifi-cant changes of expression data [8]. The overlaps of two TRS Networks (TLR4 TRS Network and TNF TRS Net-work) were superior to those of other two networks: the D2D network and the jActiveModule network (Figure 2 and Additional file 1: Table S3). It shows that our TRS Network approach finds more known nodes and edges than the previous approaches do.
The TLR4 TRS Network and TNF TRS Network were named by the start node used to search for TRS
Networks (See Methods). To estimate the performance of our TRS Network analysis without knowing the start node, we searched for the two TRS Networks and com-pared their overlaps. In this context, TLR4 senses LPS as the start protein. If, however, we did not know the start protein, TNF, the start protein of the highest-scoring TRS Pathway would be selected as the start node of the search step. The TLR4 TRS Network was found by the actual start node and the TNF TRS Network was found by the inferred start node. The overall propensity of the overlaps of two networks looked very similar, though the performance by the actual start node was slightly better than by the inferred start node (Figure 2 and Additional file 1: Table S3). Therefore, this result shows that our TRS Network analysis works quite well on searching for TRS Networks without a known start protein.
By our TRS Network scoring function (Eq. (5)), we ordered 70 KEGG signaling pathways and four
sub-networks: the TLR4 TRS Network, the TNF TRS work, the jActiveModule network, and the D2D Net-work (Table 1). We compared the orders of KEGG pathways by our scoring function to those by Impact analysis. We obtained the same results in the top ranked KEGG pathways. By both analyses, the TLR pathway and Apoptosis were the most relevant to this context and highly regulated by transcription. However, the net-work scores (p values) of the two KEGG pathways were much lower (more significant) than those of the two TRS Networks. It shows that the two KEGG pathways are not good TRS Networks, though they are the most relevant to the context among the known pathways.
Among 70 KEGG pathways and the four sub-net-works, the highest-scoring pathway or sub-network was the TLR4 TRS Network (Table 1). It includes more sig-nificant TRS Pathways (P( , ): 942.988) than the TNF TRS Network (P( , ): 698.589) and the TLR
Table 1 The results of TRS Network analysis
Networks or pathways Network score (p value) S() P( , ) |ε|
TLR4 TRS Network 4.312 (<1.0e-03) 17.246 942.988 218 TNF TRS Network 4.046 (<1.0e-03) 17.509 698.589 214 TLR signaling pathway 2.078 (0.38) 5.173 32.789 213 Apoptosis 1.385 (0.83) 3.958 159.534 158 D2D network 0.118 (0.99) 29.244 32.089 834 jActiveModule network -0.194 (0.99) 41.025 19.484 970
The network scores are calculated by summing InS(), and InP( , ) and subtracting In|| (See Eq. (5)). S() indicates how much its nodes are differentially expressed. is calculated by summing the path scores of all TRS Pathways the network includes. P( , ) Sub-networks results are highlighted in bold to be easily recognized from KEGG pathway results. P values are assessed by random permutation of the expression of individual genes. The expression condition is 2h after the LPS treatment.
Figure 2 The overlap of four sub-networks with the TLR signaling pathway and Apoptosis. It shows the difference of the statistical significance of the node overlap (A) and the edge overlap (B) between four sub-networks. The line color of each sub-network is following: the TLR4 TRS Network (blue), the TNF TRS Network (red), the D2D network (green), and the jActiveModule network (purple). The overlaps of the two TRS Networks are larger than those of other networks: the D2D network and the jActiveModule Network. P values are measured by Fisher exact test [46] and are transformed by the negative natural logarithm. The condition is 2h after the LPS treatment.
signaling pathway (P( , ): 32.789), though the num-ber of its edges (| |: 218) is similar to that of the TNF TRS Network (| |: 214) and to that of the TLR signal-ing pathway (| |: 213). This suggests that edges of the TLR4 TRS Network have a higher probability in being the components of significant TRS Pathways than those of other networks. Thus, the TLR4 TRS Network is more explicable and the edges may be more important. The D2D network and jActiveModule network did not obtain high network scores despite their high expression scores (S(): 41.025 and 29.244). The networks com-prise many edges (| |: 834 and 970) but do not include a lot of TRS Pathways (P( , ): 19.484 and 32.089). This shows that most edges are not compo-nents of TRS Pathways. The two sub-networks are inex-plicable and do not provide many clues to understand biological phenomenon of the context. Therefore, the orders of the network scores (Table 1) shows that our TRS Network analysis efficiently finds more TRS Path-ways and TRS Networks than other approaches (includ-ing canonical pathway analyses).
Discussion
TRS Network analysis shows how dendritic cells respond to the LPS treatment
Dendritic cells sense the presence of LPS and are matured by presenting LPS as an antigen-presenting cell to initiate adaptive immune responses through T cell
activation [1]. Our TRS Network analysis found that NFKB activated by the signal starting from LPS induces biological process related to the maturation of dendritic cells. We discovered four biological processes related to dendritic cell maturation and among those processes, two processes showed inter-pathway cross-communica-tion of transcripcross-communica-tional regulacross-communica-tions between signaling pathways (Figure 3).
Firstly, NFKB has gotten a positive feedback by indu-cing TNF, which in turn reinforces the activation of NFKB (Figure 3A). When the dendritic cells are treated with LPS, LPS activates TLR4 which recruits adaptor proteins and sends a signal to NFKB to release NFKB into the nucleus (a TLR4-NFKB pathway). NFKB in the nucleus induces the transcription of genes that promote immune and inflammatory responses [1]. TNF, one of the target genes increased by NFKB, has the possibility to activate NFKB as a positive feedback by sending a signal to NFKB through a TNF-NFKB pathway. A posi-tive feedback is possible because the TLR4-NFKB path-way and the TNF-NFKB pathpath-way have a common downstream activating NFKB.
Secondly, NFKB activated by the TNF-NFKB pathway induces inflammatory responses by increasing the mRNA expression levels of inflammatory cytokines (e.g. IL6 and IL12B) (Figure 3B and Figure S5). The inflam-matory cytokines IL6 and IL2B stimulates the JAK-STAT signaling pathway. The JAK-JAK-STAT signaling
Figure 3 Transcriptional regulations in dendritic cells treated with LPS. (A) and (B) shows the transcriptional regulations between the two TRS Pathways at 2h and at 8h after the LPS treatment respectively. (A) At 2h after the treatment, TLR4 sensing LPS sends a signal to NFKB. NFKB reinforces to increase its own expression by increasing the mRNA expression level of TNF. (B) At 8h after the treatment, NFKB activates the JAK-STAT pathway through increasing the mRNA expression levels of IL6, IL12B, and OSM. The nodes represent proteins and their colors show their mRNA expression levels (the same as Figure 1). Light cyan colored boxes represent gene families. The black edges represent PPIs and red edges do positive PD interactions. The positive PD interactions are estimated based on the expression change of source and target genes.
pathway provides one of the most direct routes to the nucleus in which transcriptional activation is initiated by each particular member of the STAT family [1]. In spite of the simple pathway that consists of four JAKs and seven STATs, the pathway translates more than 30 cyto-kines into cell-type specific or context-dependent pat-terns of cytokine responsiveness and gene expression [39]. In this context, cytokine IL6, IL12B, and OSM were activated by the TNF-NFKB pathway and the cyto-kines increased the mRNA expression levels of the interferon regulatory transcription factor family genes, such as IRF1 and IRF7 by the JAK-STAT signaling path-way. The chosen genes were transcription factors involved in inflammation and apoptosis [40]. This inter-pathway cross-communication is a good example of transcriptional regulations between signaling pathways.
Thirdly, NFKB elevated the mRNA expression levels of necessary genes for T cell stimulation: CD40, CD80, ICAM1, CD83, CXCL10, CCL5, and CXCL11 (Figure S5). CD40 and CD80 are co-stimulatory molecules that bind to complementary receptors on the T cell surface, in activating a T cell [1]. ICAM1 enables a T cell to remain bound to an antigen-presenting cell long enough for the T cell to become activated by binding lfa-1 on the T cell surface [41]. Moreover, it was reported that the mature dendritic cells expressed CD83 and high levels of CD40, CD80, and CD86 [42]. CXCL10, CXCL11, and CCL5 are chemoattractants that guide the migrations of leukocytes such as T cells to induce a sui-table immune response [43-45].
Lastly, NFKB increases the mRNA expression levels of genes related to apoptosis, especially inhibitors of apop-tosis (IAPs) such as BIRC2 and BIRC3 suppressing cas-pases (Figure S5) [35]. At 2h after the LPS treatment, mRNA expression levels of IAPs were only increased. However, at 8h after the treatment, those of other genes inhibiting apoptosis (IL15, NFKB1) were also increased. This result shows that apoptosis would be repressed in dendritic cells and it agrees with this context of the den-dritic cell maturation. If apoptosis occurred in matured dendritic cells, they could not perform their roles initiat-ing adaptive immune responses as an antigen-presentinitiat-ing cell.
Conclusions
We propose a new computational omics approach to discover signaling pathways regulated by transcription (TRS Pathways) and transcriptional regulations between them in TRS Networks dependent on cellular contexts to investigate the transcription-mediated mechanism of inter-pathway cross-communication of signaling path-ways. Our new approach has three advantages. Firstly, highly reliable TRS Pathway candidates and transcrip-tional regulations between pathways can be discovered.
Secondly, the approach can discover more known knowledge than the previous approaches. Lastly, it helps to understand the underlying biological phenomena of cellular contexts by providing a graphical network. We demonstrated that our analysis performed well in the context of dendritic cells treated with LPS, since dendri-tic cells commanding the human immune system are very important to disease research. Likewise, our approach determines how some signaling pathways are transcriptionally regulated by other pathways in patients by analyzing expression data comprising patients and normal samples. Therefore, it would be very helpful to understand the underlying biological phenomena of complex diseases such as cancer.
Additional material
Additional file 1: Supplementary materials. It comprises 5 figures (Figure S1, Figure S2, Figure S3, Figure S4, and Figure S5), 3 tables (Additional file 1: Table S1, Table S2, Table S3) and 4 networks (the TLR4 TRS Network, the TNF TRS Network, the D2D Network and the jActiveModule network).
Acknowledgements
We thank Eunjung Lee, Taekwon Son and Sang Cheol Kim for biological and statistical consultation. We also thank Moonhee Lee for improving the manuscript. This work was supported by the Korean Systems Biology Research Project (20100002164), the World Class University program (R32-2008-000-10218-0) and the Basic Research Laboratory grant (2009-0086964) of the Ministry of Education, Science and Technology through the National Research Foundation of Korea.
Author details
1Department of Bio and Brain Engineering, KAIST, 373-1 Guseong-dong, Yuseong-gu, Deajeon, Republic of Korea.2Department of Mathematics, Inha University, 253 Yonghyun-dong, Nam-gu, Incheon, Republic of Korea. Authors’ contributions
SH, HS and DL conceived and designed the experiments. SH and SW analyzed the data. SH wrote the manuscript. DL directed this project and helped to draft the manuscript. All authors read and approved the final manuscript.
Received: 12 August 2010 Accepted: 13 January 2011 Published: 13 January 2011
References
1. Alberts B, Johnson A, Lewis J, Raff M, Roberts K, Walter P: Molecular Biology of the Cell , 4 2002.
2. Bezbradica JS, Medzhitov R: Integration of cytokine and heterologous receptor signaling pathways. Nat Immunol 2009, 10:333-339.
3. Ivashkiv LB: Cross-regulation of signaling by ITAM-associated receptors. Nat Immunol 2009, 10:340-347.
4. Wilson NS, Dixit V, Ashkenazi A: Death receptor signal transducers: nodes of coordination in immune signaling networks. Nat Immunol 2009, 10:348-355.
5. Schroder K, Sweet MJ, Hume DA: Signal integration between IFNgamma and TLR signalling pathways in macrophages. Immunobiology 2006, 211:511-524.
6. Guo Z, Li Y, Gong X, Yao C, Ma W, Wang D, Li Y, Zhu J, Zhang M, Yang D, Wang J: Edge-based scoring and searching method for identifying condition-responsive protein-protein interaction sub-network. Bioinformatics 2007, 23:2121-2128.
7. Hwang S, Son SW, Kim SC, Kim YJ, Jeong H, Lee D: A protein interaction network associated with asthma. J Theor Biol 2008, 252:722-731. 8. Ideker T, Ozier O, Schwikowski B, Siegel AF: Discovering regulatory and
signalling circuits in molecular interaction networks. Bioinformatics 2002, 18(Suppl 1):S233-240.
9. Rajagopalan D, Agarwal P: Inferring pathways from gene lists using a literature-derived network of biological relationships. Bioinformatics 2005, 21:788-793.
10. Sohler F, Hanisch D, Zimmer R: New methods for joint analysis of biological networks and expression data. Bioinformatics 2004, 20:1517-1521.
11. Deane CM, Salwinski L, Xenarios I, Eisenberg D: Protein interactions: two methods for assessment of the reliability of high throughput observations. Mol Cell Proteomics 2002, 1:349-356.
12. Bebek G, Yang J: PathFinder: mining signal transduction pathway segments from protein-protein interaction networks. BMC Bioinformatics 2007, 8:335.
13. Stark C, Breitkreutz BJ, Reguly T, Boucher L, Breitkreutz A, Tyers M: BioGRID: a general repository for interaction datasets. Nucleic Acids Res 2006, 34: D535-539.
14. Kerrien S, Alam-Faruque Y, Aranda B, Bancarz I, Bridge A, Derow C, Dimmer E, Feuermann M, Friedrichsen A, Huntley R, Kohler C, Khadake J, Leroy C, Liban A, Lieftink C, Montecchi-Palazzi L, Orchard S, Risse J, Robbe K, Roechert B, Thorneycroft D, Zhang Y, Apweiler R, Hermjakob H: IntAct–open source resource for molecular interaction data. Nucleic Acids Res 2007, 35:D561-565.
15. Peri S, Navarro JD, Kristiansen TZ, Amanchy R, Surendranath V, Muthusamy B, Gandhi TK, Chandrika KN, Deshpande N, Suresh S, Rashmi BP, Shanker K, Padma N, Niranjan V, Harsha HC, Talreja N, Vrushabendra BM, Ramya MA, Yatish AJ, Joy M, Shivashankar HN, Kavitha MP, Menezes M, Choudhury DR, Ghosh N, Saravana R, Chandran S, Mohan S, Jonnalagadda CK, et al: Human protein reference database as a discovery resource for proteomics. Nucleic Acids Res 2004, 32:D497-501. 16. Chatr-aryamontri A, Ceol A, Palazzi LM, Nardelli G, Schneider MV,
Castagnoli L, Cesareni G: MINT: the Molecular INTeraction database. Nucleic Acids Res 2007, 35:D572-574.
17. Messina DN, Glasscock J, Gish W, Lovett M: An ORFeome-based analysis of human transcription factor genes and the construction of a microarray to interrogate their expression. Genome Res 2004, 14:2041-2047. 18. Ryu T, Jung J, Lee S, Nam HJ, Hong SW, Yoo JW, Lee DK, Lee D: bZIPDB: a
database of regulatory information for human bZIP transcription factors. BMC Genomics 2007, 8:136.
19. Subramanian A, Tamayo P, Mootha VK, Mukherjee S, Ebert BL, Gillette MA, Paulovich A, Pomeroy SL, Golub TR, Lander ES, Mesirov JP: Gene set enrichment analysis: a knowledge-based approach for interpreting genome-wide expression profiles. Proc Natl Acad Sci USA 2005, 102:15545-15550.
20. Kanehisa M, Araki M, Goto S, Hattori M, Hirakawa M, Itoh M, Katayama T, Kawashima S, Okuda S, Tokimatsu T, Yamanishi Y: KEGG for linking genomes to life and the environment. Nucleic Acids Res 2008, 36: D480-484.
21. Sayers EW, Barrett T, Benson DA, Bryant SH, Canese K, Chetvernin V, Church DM, DiCuccio M, Edgar R, Federhen S, Feolo M, Geer LY, Helmberg W, Kapustin Y, Landsman D, Lipman DJ, Madden TL, Maglott DR, Miller V, Mizrachi I, Ostell J, Pruitt KD, Schuler GD, Sequeira E, Sherry ST, Shumway M, Sirotkin K, Souvorov A, Starchenko G, et al: Database resources of the National Center for Biotechnology Information. Nucleic acids research 2009, 37:D5-15.
22. Steffen M, Petti A, Aach J, D’Haeseleer P, Church G: Automated modelling of signal transduction networks. BMC Bioinformatics 2002, 3:34. 23. Scott J, Ideker T, Karp RM, Sharan R: Efficient algorithms for detecting
signaling pathways in protein interaction networks. J Comput Biol 2006, 13:133-144.
24. Sprenger J, Lynn Fink J, Karunaratne S, Hanson K, Hamilton NA, Teasdale RD: LOCATE: a mammalian protein subcellular localization database. Nucleic Acids Res 2008, 36:D230-233.
25. Sharan R, Suthram S, Kelley RM, Kuhn T, McCuine S, Uetz P, Sittler T, Karp RM, Ideker T: Conserved patterns of protein interaction in multiple species. Proc Natl Acad Sci USA 2005, 102:1974-1979.
26. Goldberg DS, Roth FP: Assessing experimentally derived interactions in a small world. Proc Natl Acad Sci USA 2003, 100:4372-4376.
27. Huh WK, Falvo JV, Gerke LC, Carroll AS, Howson RW, Weissman JS, O’Shea EK: Global analysis of protein localization in budding yeast. Nature 2003, 425:686-691.
28. Bader JS, Chaudhuri A, Rothberg JM, Chant J: Gaining confidence in high-throughput protein interaction networks. Nat Biotechnol 2004, 22:78-85. 29. Cormen TH, Leiserson CE, Rivest RL, Stein C: Introduction to Algorithms. 2
edition. MIT Press and McGraw-Hill; 2001.
30. Iwasaki A, Medzhitov R: Toll-like receptor control of the adaptive immune responses. Nat Immunol 2004, 5:987-995.
31. Barrett T, Troup DB, Wilhite SE, Ledoux P, Rudnev D, Evangelista C, Kim IF, Soboleva A, Tomashevsky M, Marshall KA, Phillippy KH, Sherman PM, Muertter RN, Edgar R: NCBI GEO: archive for high-throughput functional genomic data. Nucleic Acids Res 2009, 37:D885-890.
32. Smyth GK: Linear models and empirical bayes methods for assessing differential expression in microarray experiments. Stat Appl Genet Mol Biol 2004, 3:Article3.
33. Linding R, Jensen LJ, Ostheimer GJ, van Vugt MA, Jorgensen C, Miron IM, Diella F, Colwill K, Taylor L, Elder K, Metalnikov P, Nguyen V, Pasculescu A, Jin J, Park JG, Samson LD, Woodgett JR, Russell RB, Bork P, Yaffe MB, Pawson T: Systematic discovery of in vivo phosphorylation networks. Cell 2007, 129:1415-1426.
34. Manning G, Whyte DB, Martinez R, Hunter T, Sudarsanam S: The protein kinase complement of the human genome. In Science. Volume 298. New York, NY; 2002:1912-1934.
35. Bhoj VG, Chen ZJ: Ubiquitylation in innate and adaptive immunity. Nature 2009, 458:430-437.
36. Draghici S, Khatri P, Tarca AL, Amin K, Done A, Voichita C, Georgescu C, Romero R: A systems biology approach for pathway level analysis. Genome Res 2007, 17:1537-1545.
37. Curtis RK, Oresic M, Vidal-Puig A: Pathways to the analysis of microarray data. Trends Biotechnol 2005, 23:429-435.
38. Shannon P, Markiel A, Ozier O, Baliga NS, Wang JT, Ramage D, Amin N, Schwikowski B, Ideker T: Cytoscape: a software environment for integrated models of biomolecular interaction networks. Genome Res 2003, 13:2498-2504.
39. Murray PJ: The JAK-STAT signaling pathway: input and output integration. J Immunol 2007, 178:2623-2629.
40. El Bougrini J, Pampin M, Chelbi-Alix MK: Arsenic enhances the apoptosis induced by interferon gamma: key role of IRF-1. Cell Mol Biol (Noisy-le-grand) 2006, 52:9-15.
41. Dustin ML, Springer TA: T-cell receptor cross-linking transiently stimulates adhesiveness through LFA-1. Nature 1989, 341:619-624.
42. Hayati AR, Zulkarnaen M: An immunohistochemical study of CD1a and CD83-positive infiltrating dendritic cell density in cervical neoplasia. Int J Gynecol Pathol 2007, 26:83-88.
43. Cocchi F, DeVico AL, Garzino-Demo A, Arya SK, Gallo RC, Lusso P: Identification of RANTES, MIP-1 alpha, and MIP-1 beta as the major HIV-suppressive factors produced by CD8+ T cells. In Science. Volume 270. New York, NY; 1995:1811-1815.
44. Cole KE, Strick CA, Paradis TJ, Ogborne KT, Loetscher M, Gladue RP, Lin W, Boyd JG, Moser B, Wood DE, Sahagan BG, Neote K: Interferon-inducible T cell alpha chemoattractant (I-TAC): a novel non-ELR CXC chemokine with potent activity on activated T cells through selective high affinity binding to CXCR3. J Exp Med 1998, 187:2009-2021.
45. Jinquan T, Jing C, Jacobi HH, Reimert CM, Millner A, Quan S, Hansen JB, Dissing S, Malling HJ, Skov PS, Poulsen LK: CXCR3 expression and activation of eosinophils: role of IFN-gamma-inducible protein-10 and monokine induced by IFN-gamma. J Immunol 2000, 165:1548-1556. 46. Fisher RA: On the interpretation ofχ2from contingency tables, and the
calculation of P. J Royal Stat Soc 1922, 85:87-94. doi:10.1186/1471-2105-12-19
Cite this article as: Hwang et al.: Context-dependent transcriptional regulations between signal transduction pathways. BMC Bioinformatics 2011 12:19.