년 한국농공학회 학술발표회 논문집 년 월 일
2005 (2005 10 28 )
A Case History of the Remediation of a Petroleum Contaminated Site
using the Bioventing Method
생물학적 통풍법을 이용한 유류오염지역 복원사례
Yu, Chan* ․ Yun, Sung-Wook ․ Jung, Yeon-Wook, Park, Han-Eun 유 찬* ․ 윤 성 욱 ․ 정 연 욱 ․ 박 한 은 경상대( ) Abstract 물리 화학적 원리에 의한 환경오염 정화방법은 종종 낮은 효율을 보이면서 공사비 부담은 큰․ 것으로 나타나고 있다 그러나 생물학적 방법들은 이러한 단점들을 극복하면서 토양과 지하수를. 정화할 수 있는 대안으로서 그 가능성을 입증하고 있는 실정이다 그 중에서 생물학적 통풍법은. 유류오염지역에 적용하고 있으며 그 원리는 지중 오염지역에 충분한 산소를 공급함으로서 오염성 분이 토착 미생물에 의해 제거되도록 하는 것이다 본 발표는 유류오염 지역에 적용된 생물학적. 통풍법의 효율을 평가하여 제시하였다. I. Introduction
Bioventing is an in situ process to enhance biodegradation of hydrocarbons by providing oxygen, generally in the form of air, to aerobic soil microorganism and is a commonly used technique to remediate PHC contaminated soils, as it enhances the ability of soil microbiota to degrade natural and xenobiotic compounds. Bioventing is normally accomplished using mechanical blower systems to inject air into unsaturated soils(USEPA, 1998). Fig. 1 illustrates a typical air injection bioventing system. Air injected in the unsaturated zone provides microorganisms with adequate oxygen conditions so that degradation may continue efficiently for longer periods of time.
Fig. 1 Typical bioventing system
The present study evaluated a bioventing treatment of petroleum contaminated site to provide in situ monitoring data that could be used to make the decision of the application of this method to other contaminated sites.
II. Site description and bioventing application
년 한국농공학회 학술발표회 논문집 년 월 일
2005 (2005 10 28 )
The site was a public garden of a maintenance facility zone of railroad vehicle and placed in the edge of that zone, in area of 2,662 m2. But it had been used as a waste landfill for a long time and thus seriously contaminated by PHC, mainly diesel fuel, in the level of TPH = 2,367~5,611 mg/kg and to a depth of 6.5 m according to the results of subsurface investigation in 2002. There was approximately +7.0m of fill from ex-groundsurface after the landfill closure and then finally developed as a public garden for employers. Depth to groundwater ranges from approximately 7.5~8.0m below the present ground surface.
Bioventing method was applied to this site to remedy the PHC contaminants from November, 2004 to October, 2005(see, Fig. 2). Totally 73 injection and 61 extraction wells(diameter= mm) were installed to the depth of 6.5m in the well space of 4.1~4.4m. The centrifugal blower plant was used to provide oxygen and air flow rate of blower was 10 m3/hr. The operation of blower was started on Feb., 2005. About 1,500 ton of commercial Nutrients which was being liquid state and the mixture of C, N, P in ratio of 100:10:1 with microorganisms in the interval of 2 weeks was injected to maintain the number of microorganisms greater than 10 cfu/g and so to enhance the degradation of PHC contaminants from Feb., to Sep., 2005.
Office 10 ROI 2.5cm Depth Injection well Extraction well 73 ea 61 ea Area Volume 2,662m2 7,723m3 Well spacing 4.1~4.4m Max. 6.5m Office 10 ROI 2.5cm Depth Injection well Extraction well 73 ea 61 ea Area Volume 2,662m2 7,723m3 Well spacing 4.1~4.4m Max. 6.5m
Fig. 2 Site description and well locations
To evaluate the effectiveness of bioventing, soil sampling and soil vapor monitoring were carried out on the 23 points. Soil sampling was carried out to investigate the reduction of PHC contaminants in term of TPH level on 3 times(January, April & August, 2005) in a project period and soil vapor monitoring was also carried out in the terms of O2, CO2, VOCs
and soil temperature in a week days using PID.
III. Results
The results of soil vapor monitoring were as Fig. 3 ~ Fig. 6 and the results of TPH analysis were as Fig. 7 ~ Fig. 10.
년 한국농공학회 학술발표회 논문집 년 월 일 2005 (2005 10 28 ) 0 1 2 3 4 5 6 7 0 1 0 2 0 3 0 4 0 5 0 6 0 7 0 Temperatu re( C.) D e p th (m ) 0 1 2 3 4 5 0 5 10 15 20 25 30 Daily V OCs (ppm) D a ily C O 2 (% )
Fig. 3 Soil temperature with depth Fig. 4 Relationship between CO2 vs VOCs during Bioventing 0 50 100 150 200 250 300 350 17-Feb 24-Feb 3-M ar 10-M ar 17-M ar 24-M ar 31-M ar 7-Apr 14-Apr 21-Apr 28-Apr 5-M ay 12-M ay 19-M ay 26-M ay 2-Jun 9-Jun 16-Jun 23-Jun 30-Jun 7-Jul 14-Jul 21-Jul 28-Jul Date A c c u m . C O 2 (% ) D1-1 D1-2 D1-3 D1-4 D1-5 D1-6 D1-7 D1-8 D1-9 D1-10 D1-11 D1-12 D1-13 D1-14 D1-15 미 생 물 :5 00 L 영 양 제 :1 34 kg 미 생 물 :5 00 L 영 양 제 :1 33 kg 미 생 물 :2 10 0 L 영 양 제 :5 35 kg 영 양 제 :6 7 0 kg 미 생 물 :2 50 0 L 미 생 물 :1 10 0 L 영 양 제 :4 00 kg 미 생 물 :13 0 0L 영 양 제 :27 0 kg 0 50 100 150 200 250 300 350 17-Feb 24-Feb 3-M ar 10-M ar 17-M ar 24-M ar 31-M ar 7-Apr 14-Apr 21-Apr 28-Apr 5-M ay 12-M ay 19-M ay 26-M ay 2-Jun 9-Jun 16-Jun 23-Jun 30-Jun 7-Jul 14-Jul 21-Jul 28-Jul Date A c c u m . C O 2 (% ) D1-1 D1-2 D1-3 D1-4 D1-5 D1-6 D1-7 D1-8 D1-9 D1-10 D1-11 D1-12 D1-13 D1-14 D1-15 미 생 물 :5 00 L 영 양 제 :1 34 kg 미 생 물 :5 00 L 영 양 제 :1 33 kg 미 생 물 :2 10 0 L 영 양 제 :5 35 kg 영 양 제 :6 7 0 kg 미 생 물 :2 50 0 L 미 생 물 :1 10 0 L 영 양 제 :4 00 kg 미 생 물 :13 0 0L 영 양 제 :27 0 kg
Fig. 5 Accumulated CO2 concentration with wells during Bioventing
0 5 0 1 0 0 1 5 0 2 0 0 2 5 0 3 0 0 3 5 0 4 0 0 4 5 0 1 7 -F e b 2 4 -F e b 3 -M a r 1 0 -M a r 1 7 -M a r 2 4 -M a r 3 1 -M a r 7 A p r 1 4 -A p r 2 1 -A p r 2 8 -A p r 5 -M a y 1 2 -M a y 1 9 -M a y 2 6 -M a y 2 -J u n 9 -J u n 1 6 -J u n 2 3 -J u n 3 0 -J u n 7 - J u l 1 4 -J u l 2 1 -J u l D a te A c c u m . V O C s (p p m ) D 1 - 1 D 1 - 2 D 1 - 3 D 1 - 4 D 1 - 5 D 1 - 6 D 1 - 7 D 1 - 8 D 1 - 9 D 1 - 1 0 D 1 - 1 1 D 1 - 1 2 D 1 - 1 3 D 1 - 1 4 D 1 - 1 5 미 생 물 :5 0 0 L 영 양 제 :1 3 4 k g 미 생 물 :5 0 0 L 영 양 제 :1 3 3 k g 미 생 물 :2 1 0 0 L 영 양 제 :5 3 5 k g 영 양 제 :6 7 0 k g 미 생 물 :2 5 0 0 L 미 생 물 :1 1 0 0 L 영 양 제 :4 0 0 k g 미 생 물 :1 3 0 0 L 영 양 제 :2 7 0 k g 0 5 0 1 0 0 1 5 0 2 0 0 2 5 0 3 0 0 3 5 0 4 0 0 4 5 0 1 7 -F e b 2 4 -F e b 3 -M a r 1 0 -M a r 1 7 -M a r 2 4 -M a r 3 1 -M a r 7 A p r 1 4 -A p r 2 1 -A p r 2 8 -A p r 5 -M a y 1 2 -M a y 1 9 -M a y 2 6 -M a y 2 -J u n 9 -J u n 1 6 -J u n 2 3 -J u n 3 0 -J u n 7 - J u l 1 4 -J u l 2 1 -J u l D a te A c c u m . V O C s (p p m ) D 1 - 1 D 1 - 2 D 1 - 3 D 1 - 4 D 1 - 5 D 1 - 6 D 1 - 7 D 1 - 8 D 1 - 9 D 1 - 1 0 D 1 - 1 1 D 1 - 1 2 D 1 - 1 3 D 1 - 1 4 D 1 - 1 5 미 생 물 :5 0 0 L 영 양 제 :1 3 4 k g 미 생 물 :5 0 0 L 영 양 제 :1 3 3 k g 미 생 물 :2 1 0 0 L 영 양 제 :5 3 5 k g 영 양 제 :6 7 0 k g 미 생 물 :2 5 0 0 L 미 생 물 :1 1 0 0 L 영 양 제 :4 0 0 k g 미 생 물 :1 3 0 0 L 영 양 제 :2 7 0 k g
Fig. 6 Accumulated VOCs concentration with wells during Bioventing
년 한국농공학회 학술발표회 논문집 년 월 일 2005 (2005 10 28 ) 0 1 2 3 4 5 6 7 0 5 10 15 20 25 30
M ois ture Contents(%)
D e p th (m ) 1st & 2nd 3rd
Fig. 7 Water contents of soils sampled
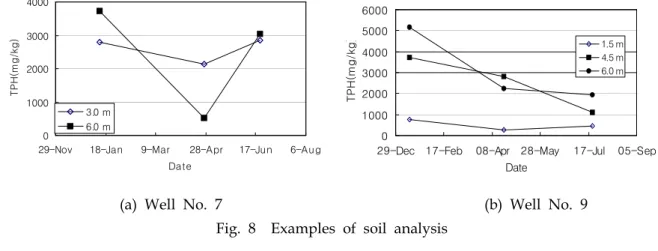
0 1000 2000 3000 4000
29-Nov 18-Jan 9-Mar 28-Apr 17-Jun 6-Aug
Date T P H (m g /k g ) 3.0 m 6.0 m 0 1000 2000 3000 4000 5000 6000
29-Dec 17-Feb 08-Apr 28-May 17-Jul 05-Sep
Date T P H (m g/ k g) 1.5 m 4.5 m 6.0 m
(a) Well No. 7 (b) Well No. 9
Fig. 8 Examples of soil analysis
IV. Conclusion
During bioventing application, the effectiveness was evaluated with the results of soil vapor monitoring and the TPH analysis of soil samples. The results has been shown that the obvious reduction of TPH concentration as Fig. 8(b). Therefore the bioventing method was expected to apply to the PHC contaminated site by the effective and economic countermeasure.
However it was also appeared such points that no effectiveness was shown as Fig. 8(a) although it was not dominated and it could be made the big trouble in the total project plan. Now it is performing the additional investigation to verify the causes of it and it is believing that the components of contaminants is not diesel fuel but oil or grease which were not detected in the prior investigation and are known the very difficult components to degrade by bioremediation principle.
Reference
USEPA,, 1998, Bioremediation, Innovative Site Remediation Technology Design & Application Vol. 1, pp. 4.4, etc.