INTRODUCTION
Magnetic resonance imaging(MRI) is a method of gener-ating images through mathematical processing on a comput-er by measuring the degree of diffcomput-erence in the signal gen-erated in a tissue by resonating hydrogen nuclei in the
tis-sue region. It is widely used as a diagnostic imaging device that facilitates the diagnosis of disease and the discovery of disease by utilizing it as information of physiology, anato-my, and pathology(Zhu et al. 2016). The protons of the hy-drogen nuclei in the human body are almost coincident with the direction of the magnetic field when a magnetic field is applied from the outside. In such external magnetic field, when the hydrogen nuclei in the magnetized state emit a ra-dio-frequency(RF) signal of a certain frequency, hydrogen ─ 15 ─
Technical Paper
* Corresponding author: Dae Cheol Kweon, Tel. +82-31-870-3411, Fax. +82-31-870-3419, E-mail. [email protected]
Analysis of Chemical Shift Artifacts Using the TSE
Pulse Sequence and Bandwidth at MR Imaging
Mun Hwa Hong1, Min Hyeok Lee1, Song Yoon Lee1, Ju Yeon Lee1,
Jin Gyung Lee1, Jin Han1 and Dae Cheol Kweon1,*
1Department of Radiological Science, College of Bioecological Health, Shinhan University, Uijeongbu 11644, Republic of Korea
Abstract - In order to experimentally analyze the artifacts of the chemical shift of water and oil, we made a phantom by mixing water and oil to change the turbo spin-echo(TSE) pulse sequence and various bandwidth(BW) and parameters. A phantom made of water and canola oil was prepared, and an eight-channel head coil of MRI 1.5T and 3.0T was used. The scan parameters were TR(5069ms), TE(100ms), water fat shift(0.999 and 1.891pix) at 1.5T and TR(3000ms), TE(100ms), and water fat shift(3.836pix) at 3.0T. In all sequences, a matrix(256×256), field of view(FOV)(240mm), and slice thickness were scanned at 3mm; the frequency direction was RL (right-left), and the BW was calculated using the Philips ACR Bandwidth Calculator. The images were analyzed by obtaining the plot profile and the Fourier transform image. The signal-to-noise ratio(SNR), peak signal-to-noise ratio(PSNR), mean square error(MSE), root mean square error (RMSE), and maximum absolute error(MAE) were calculated to evaluate the images according to the 1.5T and 3.0T BWs of MR. In order to compare the image of chemical shift artifact, the layer of the chemical shift artifact was larger than that of 1.5T of BW 114.9Hz compared to 217.5Hz, and at 3.0T, 113.2Hz compared to 218.1Hz, and chemical shift artifact. The spatial frequency changes due to the Fourier transform were 1.5T and 3.0T. The reference image(BW 55.7kHz) and the test image(BW 29.4kHz) had the SNR of 7.753dB, PSNR of 22.869dB, RMSE of 26.808, and MAE of 7.758 in the 1.5T MRI. The reference image(BW 55.9kHz) and the test image(BW 29kHz) had the SNR of 17.79dB, PSNR of 34.062dB, RMSE of 33.401, and MAE of 5.971 in the 3.0T MRI. The SNR and PSNR were measured at 1.5T and 3.0T when the BW parameter was changed. At the 1.5 T and 3.0T MRI, there was a statistically significant difference(p-value<.05). The chemical shift
artifacts occurred in the phantom of water and oil, and the artifact was less at 1.5T than at 3.0T, and the artifact decreased as the BW increased. In order to reduce the chemical shift artifact in MRI, it is considered appropriate to decrease the intensity of the field and to broaden the BW. Key words : Chemical shift, MRI, Parameter, Pulse sequence, Turbo spin-echo
nuclei of some low ground state absorb the high-frequency energy and enter a high-energy state(excited state). The phenomenon where a proton of hydrogen causing the exci-tation resonance returns to its original ground state with a low energy level is called relaxation, and a magnetic reso-nance signal is generated in the tissue of the human body at this time(Ann et al. 2017).
MRI is an important measurement instrument in clinical practice because it is not harmful to the human body and images the characteristics of the internal constituent mate-rial compared with other imaging diagnostic devices. The MRI apparatus can obtain tissue parameters such as spin density, T1, T2, chemical shift, spectroscopy, and blood flow, which are inherent in the information of a living body, and various biological information images can be obtained through these parameters. However, it is somewhat difficult to obtain accurate images in MRI because of the presence of fat and water components in living tissue. Fat and water induce T1 and T2 relaxation time differences in MRI, and depending on the sensitivity of the MR signals, artifacts oc-cur in conventional MRI technique due to inadequate con-trast and chemical shift. In particular, the detailed anatomi-cal shape of a marginal part of the structures surrounded by fat is lost owing to the chemical migration phenomenon due to fat and water components, and the fat tissue of high sig-nal intensity generates phase artifacts due to respiration.
Chemical shift artifacts are generally classified as arti-facts caused by special waveforms externally applied in special environments owing to the inherent characteristics of MRI, improper image acquisition methods, malfunctions of the machine itself, and special or adjacent tissue charac-teristics. Therefore, in order to remove various artifacts, we should try to obtain accurate images by using the MRI pa-rameter of turbo spin-echo(TSE).
In this study, a phantom was fabricated by mixing water and oil to analyze the artifacts of the chemical migration of water and fat. Using the parameterization of TSE pulse se-quence and various bandwidth(BW) and frequency encod-ing, the chemical shift artifacts were studied experimentally.
THEORY
1. Chemical Shift
A water molecule forms an electron cloud around hydro-gen atoms, oxyhydro-gen atoms and oxyhydro-gen atoms with strong
electron affinity, and the fats combine with hydrogen atoms and carbon atoms and form electron clouds around hydro-gen. Among these various artifacts, the chemical shift arti-facts due to the different chemical environments of water molecules and fats were studied. The spectral frequency u of the chemical shift is expressed in units of Hz(1/sec). However, this unit has the inconvenience that it can change the frequency depending on the strength of the magnetic field, which is applied from outside, even for the same ma-terial. Therefore, the units expressed in terms of frequency are expressed in terms of ppm(parts per million), and the unit of a chemical shift is measured in terms of a relative value, in units of R, which does not depend on the strength of the magnetic field. This represents the degree of a chem-ical shift(δ) from the reference material and can be ex-pressed using the following equation.
νsample-νref
Chemical shift(δ)=---×106 (1) νref
νsample is the absolute resonance frequency of the sample, and νref is the absolute resonance frequency of a standard reference compound, measured in the same applied magnetic field B0. Since the numerator is usually expressed in hertz, and the denominator in megahertz, δ is expressed in ppm.
The water molecule δ is 4.7ppm and the fat δ is 1.2ppm. Therefore, water molecules and fats have a chemical shift of 3.5ppm in an external magnetic field of 1.5T(resonance frequency of 60MHz, f=64MHz)(3.5ppm)[(64×106 HZ) (3.5×10⁻⁶)]. That is, a high effective magnetic field larger than 1H of water molecules. A chemical shift is a phenome-non that occurs owing to the difference in the shielding ef-fect of the device field, which is generated by the type and number of electrons and adjacent nuclei around the nucleus, even though it is the same kind of nucleus. Therefore, if there is a tissue containing water around it, a black line ap-pears on one side and a bright white line apap-pears on the op-posite side. These lines appear in the direction of frequency encoding. The higher the field strength of the magnet, the greater the chemical shift artifacts and the number of pixels shifted by the chemical shift is 1.5 Tesla.
224Hz/(BW/Nx) (2)
BW is the bandwidth and Nx is the pixel size in the fre-quency encoding direction.
According to this equation, the larger the BW and the smaller the Nx values, the less the artifact due to the
chemi-cal shift misregistration.
2. Evaluation of Imaging
The signal-to-noise ratio(SNR) and peak signal-to-noise ratio(PSNR) were calculated by dividing the signal inten-sity value in the tissue by the standard deviation of the sig-nal intensity value of the background. The most commonly used objective data measures are the maximum absolute error(MAE), mean square error(MSE), root mean square error(RMSE), SNR, and PSNR. The SNR, PSNR, RSME, and MAE applied in this study are as follows(Ghrare et al. 2008; Gonzalez et al. 2008).
Signal intensity of region, surrounding tissues SNR=--- (3) Standard deviation of noise in background SNR=10log m-1 n-1 ∑∑(f*(i, j))2 i=0 j=0 --- m-1 n-1 ∑ ∑
[
f(i, j)-(f*(i, j))2]
i=0 j=0 dB (4) PSNR=10·log10 max(r(x, y))2 1 nx-1 ny-1 --- ·∑∑[
r(x, y)-t(x, y)]
2 nxny 0 0 (5) RMSE= 1 ---·∑nx-1 n∑y-1[
r(x, y)-t(x, y)]
2 nxny 0 0 (6) 1 nx-1 ny-1 MAE=--- ·∑∑|
r(x, y)-t(x, y)|
(7) nxny 0 0MATERIALS AND METHODS
1. MRI ScanningThe phantom was prepared by mixing water and canola oil(Cheiljedang Co. Ltd., Seoul, Korea) to investigate the artifacts of the chemical shifts according to the parameter changes using the TSE pulse sequence of MRI. The phan-tom was scanned experimentally after a clean sterilized bottle was filled with 300mL of both water and oil, and the water and oil separated in the bottle on keeping them at rest for about 5min, as shown in Fig. 1. An image was exam-ined using an eight-channel head coil using MRI 1.5T and 3.0T(Achieva, Philips Medical Systems, The Netherlands), and the frequency direction experimented with was right-left(RL). The sequence used for the test was a TSE pulse sequence. The scan parameters used in the TSE pulse se-quence were TR(5069ms), TE(100ms) and water fat shift (WFS) 0.999 and 1.891 pix at 1.5T(Table 1)(100ms), and the WFS scanned at 3.0T was 1.991 and 3.836pix(Table 2). In all sequences, a matrix(256 ×256), field of view (FOV)(240mm), and slice thickness were scanned at 3 mm. The BW applied to the TSE pulse sequence was calcu-lated using the Philips ACR Bandwidth Calculator. The BW used for the phantom scan is shown in the following equa-tion.
ACR BW(kHz)=
Philips BW(Hz)×ACQ Measurement Matrix/1000Hz (8)
Fig. 1. MRI apparatus and water-canola oil phantom.
2. Imaging Analysis
In order to analyze the chemical shift artifacts quanti-tatively, the image profile was analyzed using the ImageJ program(NIH, Bethesda, MD, USA) to obtain the plot pro-file and the Fourier transform image. The PSNR, RMSE, RMSE, and MAE were calculated to evaluate the images according to the 1.5T and 3.0T BWs of MR.
3. Statistical Analysis
Statistical significance was set at p<.05 using SPSS (Version 21, IBM Corp., NY, USA) for statistical process-ing of data accordprocess-ing to the TSE pulse sequences.
RESULTS
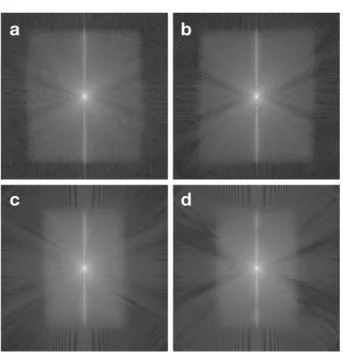
In order to compare the image of the chemical shift arti-fact, the layer of the chemical shift artifact was larger than that of 1.5T of BW 114.9Hz compared to 217.5Hz, and at 3.0T, 113.2Hz compared to 218.1Hz, and chemical shift artifact(Fig. 2). The spatial frequency changes due to the Fourier transform were 1.5T and 3.0T(Fig. 3).
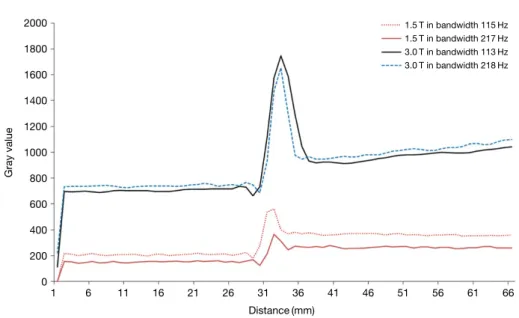
In the ImageJ program, there was a difference in gray value between the chemical shifts at 1.5T and 3.0T(Fig. 4). The SNR, PSNR, RMSE, and MAE values were obtained using the ImageJ program in order to evaluate the scanned MR images by a quantitative evaluation method. The
ref-Fig. 2. TSE pulse sequence image and the magnified images at 1.5T with the BW of 207.5Hz(a) and 114.9Hz(b), and at 3.0T with the BW
of 218.1Hz(c) and 113.2Hz(d) of the canola oil phantom.
a b
c d
Table 1. MR imaging scanning parameters used in the TSE pulse sequence of 1.5T MR
Pulse
sequence Water fat shift(pix) Frequency*(Hz) (kHz)BW (ms)TR (ms)TE matrixACQ Slice thickness(mm) (mm)FOV
TSE 0.9991.891 217.5114.9 55.729.4 50695069 100100 256×256256×256 3 240
*Frequency: Frequency difference between fat and water
Table 2. MR imaging scanning parameters used in the TSE pulse sequence of 3.0T MR
Pulse
sequence Water fat shift(pix) Frequency*(Hz) (kHz)BW (ms)TR (ms)TE matrixACQ Slice thickness(mm) (mm)FOV
TSE 1.9913.836 218.1113.2 55.929 30003000 100100 256×256256×256 3 240
erence image(BW 55.7kHz) and the test image(BW 29.4 kHz) had the SNR of 7.753dB, PSNR of 22.869dB, RMSE of 26.808, and MAE of 7.758 in the TSE pulse sequence scan image at with the magnetic field strength of 1.5T(Table 3). The reference image(BW 55.9kHz) and the test image (BW 29kHz) had the SNR of 17.79dB, PSNR of 34.062 dB, RMSE of 33.401, and MAE of 5.971 in the TSE pulse sequence with a magnetic field strength of 3.0T(Table 4). The SNR and PSNR were measured at 1.5T and 3.0T when the BW parameter was changed(Fig. 5). At 1.5T and 3.0T, there was a statistically significant difference(p-value<.05) between the SNR and PSNR with parameter changes.
DISCUSSION
In this study, we experimented to observe the chemical shift artifact. When MRI was performed by mixing water and oil, it was confirmed that the artifact occurred at the interface. In addition, we can confirm that the artifact is reduced when the main field strength is lowered and the BW is widened. Although there were various frequency encoding directions, in this experiment, only the part that performed in the RL direction was used as an
unsatisfacto-ry point, and it was also unsatisfactounsatisfacto-ry that the quantitative evaluation was different but the qualitative evaluation was not significantly different. Chemical shift artifacts are ar-tifacts caused by a frequency difference. If an equipment with a low main magnetic field is used, the frequency dif-ference between fat and water is higher and the image is improved in terms of artifacts than when using an equip-ment with a stronger magnetic field.
MRI has difficulties in capturing accurate images because of the presence of fat and water components in living tissue, and it causes artifacts. Fat and water induce time differenc-es in MRI and generate artifacts of inadequate contrast and chemical mobility, depending on the sensitivity of the MRI signal. This phenomenon of chemical migration causes the loss of the anatomical shape of the structure surrounded by fat, and the fat tissue of high signal intensity generates phase artifacts due to respiration, making it difficult to draw images for an accurate diagnosis(Zhu et al. 2016).
The TSE(also called fast spin-echo), which is common-ly used in MRI, is a pulse sequence technique preferred by many radiologists for abdominal examination(Keogan et al. 2001; Ward et al. 2006). Breath-hold TSE and breath-hold HASTE images are used as an option to reduce the re-spiratory tract. Artifacts and short acquisition times or other approaches, such as respiratory triggering, enhance the TSE technology with a high spatial resolution, can improve the detection of lesions, and have been applied to the abdomen and respiration(Kanematsu et al. 1999; Pauleit et al. 2001).
In this study, by using MRI to experimentally study the artifacts of chemical migration, it was confirmed that the artifacts occur at the interface, where water and canola oil are mixed. In the same way as the theoretical part, it was confirmed that the artifacts were reduced when the main field strength was lowered and the width of the BW was widened. There were various frequency coding directions, and there was a difference in quantitative evaluation, but there was no significant difference in qualitative evaluation.
The artifacts of chemical migration are artifacts that oc-cur more often under higher magnetic fields. Magnetic res-onance spectroscopy of the human body by using the chem-ical transfer effect provides a lot of diagnostic information, but the quality of the image is deteriorated in the anatomi-cal diagnosis. It is an artifact that occurs in the phase or fre-quency direction and is generated only in the gradient echo pulse sequence. The chemical transfer artifacts were more severe at 3.0T than at 1.5T(Goo et al. 2016). As a method
Fig. 3. Fourier transform of the TSE imaging. All spatial
frequen-cy information necessary to create this MR image is stored
in the Fourier space of 1.5T with the BW of 207.5Hz(a)
and 114.9Hz(b), and 3.0T with the BW of 218.1Hz(c) and
113.2Hz(d) in the canola oil phantom.
a b
Table 3. SNR, PSNR, RMSE and MAE in the TSE pulse sequence
of 1.5T MRI
Reference
image Test image SNR(dB) PSNR(dB) RMSE MAE
BW(55.7kHz) BW(29.4kHz) 7.753 22.869 26.808 7.758
p<.05
Table 4. SNR, PSNR, RMSE and MAE in the TSE pulse sequence
of 3.0T MRI
Reference
image Test image SNR(dB) PSNR(dB) RMSE MAE
BW(55.9kHz) BW(29kHz) 17.79 34.062 33.401 5.971
p<.05
Fig. 4. Plot profile of the TSE imaging at 1.5T with the BW of 207.5Hz(a) and 114.9Hz(b), and at 3.0T with the BW of 218.1Hz(c) and
113.2Hz(d) in the canola oil phantom.
a
b
c
d
Gray value Gray value Distance(mm) Distance(mm) Distance(mm) Distance(mm) Gray value Gray value 0 5 10 15 20 25 30 0 5 10 15 20 25 30 0 5 10 15 20 25 30 0 5 10 15 20 25 30 350 300 250 200 150 500 400 300 200 1500 1000 1600 1400 1200 1000 800of preventing the artifacts of chemical migration, fat and water are generated owing to different car wash frequen-cy, so a fat suppression technique or a low magnetic field should be used.
The amount of chemical shift is often expressed in ar-bitrary units known as parts per million(ppm) of the main field strength. This value is always independent of the main field strength and is about 3.5ppm for fat and water, but the car wash frequency is proportional to the run length B0 (e.g., the car wash frequency difference at 1.5T is 224Hz). That is, the fat wash is 224Hz lower than water. At 1.0T, this difference is 147Hz at a lower field strength(less than 0.5T) and is generally not important. Chemical shift similar to changes in susceptibility, the chemical shifts measured in ppm are linearly proportional to the chemical shifts mea-sured in hertz, independent of the field strength.
Chemical shift[measured in Hz]∝B0 (9) Water resonates at a Larmor frequency of about 3.3~3.5 ppm higher than lipid. This corresponds to about 140~150 Hz per tesla. A range of frequencies occurs because the geological resonance is relatively large with its multiple components being short T2. Therefore, water at 3.0T is about 420~440Hz higher than fat at Larmor frequency(Goo 2016). Since MRI has both fat and water components in liv-ing tissues, the chemical shift selective saturation(CHESS) technique is used in clinical applications to obtain accurate images. Prior to applying the MR pulse, an RF-frequency
pulse is applied to selectively excite only water or fat to ac-quire only one component(Antoine et al. 2000; Cabanes et al. 2001). The chemical shift refers to the change in the res-onance frequency depending on the bonding type of elec-trons. In the image, the signal of fat tissue shifts toward the tissue containing water in the frequency encoding direction, one side shows a black signal and the other side shows the signal of fat and water. The resonance frequency of the fat CH2 group is 3.5ppm less than the resonance frequency of the -OH group of water, so the chemical shift of fat and wa-ter is approximately 223Hz in case of a magnetic field of 1.5T. When the frequency band of a pixel is set to approxi-mately 120Hz, the boundary between fat and water can be seen to move in the frequency direction by about two pix-els. The degree of movement gets more remarkable as the frequency band is narrowed or the run length is increased. Chemical shifts have been applied clinically by using in-phase and out-of-in-phase(Henrick et al. 1997; Ragab et al. 2009). Currently, it is applied to diagnosis of tumor and embolism in clinical practice. Therefore, it is necessary to apply and study the artifacts of chemical movement, so that artificial oil and water are mixed and experimentally ap-plied various parameters of MRI experimentally as a phan-tom(Douis et al. 2016; Priolaa et al. 2016). Therefore, in order to reduce the chemical artifacts in the 1.5T and 3.0T MRI scan of the chemical shift runners weak field strength, it is thought to be appropriate to widen the width of the BW (Kweon 2016).
Fig. 5. Plot profile of the TSE pulse sequence of gray value and distance in the 1.5T and 3.0T difference in BW using the canola mixed water
phantom. 1.5T in bandwidth 115Hz 1.5T in bandwidth 217Hz 3.0T in bandwidth 113Hz 3.0T in bandwidth 218Hz Distance(mm) Gray value 1 6 11 16 21 26 31 36 41 46 51 56 61 66 2000 1800 1600 1400 1200 1000 800 600 400 200 0
PSNR is a measure of image quality. It shows that there is a difference between images under 1.5T(22.869dB) and 3.0T(34.062dB). Most MR images are limited by the SNR in the reconstructed MR image. Particularly, when the SNR increases by 20dB or more, it is not clinically important for the analysis of MR imaging(Hayes et al. 1990; Roemer et al. 1990). The gain rate of the image increases and there-fore is used to reduce the image cost and motion. If the SNR is more than 20dB, there is no difference in image quality(Masuda et al. 2001). The MSE is expressed as the square of the pixel difference, and the larger the distortion, the larger the value is. The square root of this MSE is ex-pressed as the pixel error magnitude with the RMSE and is useful for comparing the scales of objective image quality. The RMSE increased to 1.5T(26.808) and 3.0T(33.041) as the magnetic field strength was increased.
The artifacts of chemical migration are artifacts caused by frequency difference. If an equipment with a low inten-sity of the main magnetic field is used, the frequency dif-ference between fat and water is better than when using an equipment with stronger intensity.
The limitations of the study on the artifacts of chemical migration of water and oil are as follows. First, it is neces-sary to measure the image quality by using various pulse sequences. Second, the artifacts of chemical migration us-ing the BW and various parameters should be studied.
CONCLUSION
The occurrence of chemical shift artifacts was observed in images scanned with the TSE pulse sequence using a phantom consisting of mixed water and oil. We can confirm that the artifact is relatively smaller at 1.5T than at 3.0T. In addition, we can confirm that the artifact decreases as the width of bandwidth increases in each parameter. Therefore, in order to reduce the chemical shift artifact in MRI, it is considered that the intensity of the magnetic field is weak-ened and the bandwidth is broadweak-ened.
REFERENCES
Ann HW, Moon JH, Lee DI, Lee TH, Jeong JG and Kweon DC. 2017. Measurement of MR pulse sequence for acous-tic noise and image quality of opening and closing door
in 1.5T and 3.0T MRI scanning room. J. Radiat. Indt. 11(4):227-233.
Antoine JP, Coron A and Dereppe JM. 2000. Water peak sup-pression: time-frequency vs time-scale approach. J. Magn.
Reson. 144:189-194.
Cabanes E, Confort-Gouny S, Le Fur Y, Simond G and Coz-zone PJ. 2001. Optimization of residual water signal re-moval by HLSVD on simulated short echo time proton MR spectra of the human brain. J. Magn. Reson. 150:116-125. Douis H, Davies AM, Jeys L and Sian P. 2016. Chemical shift
MRI can aid in the diagnosis of indeterminate skeletal le-sions of the spine. Eur. Radiol. 26:932-940.
Ghrare SE, Ali MAM, Ismail M and Jumari K. 2008. The ef-fect of image data compression on the clinical information quality of compressed computed tomography images for teleradiology applications. Eur. J. Sci. Res. 23:6-12. Gonzalez RC and Woods RE. 2008. Digital image processing,
third edition, Prentice Hall.
Goo EH. 2016. The evaluation of image quality in gradient echo MRI of the pancreas: comparison with 2D T1 FFE and 3D T1 THRIVE imaging. J. Korean Soc. Radiol. 10: 71-79.
Goo EH and Dong KR. 2016. Quantitative and Qualitative Evaluation of Brain Diffusion Weighted Magnetic Reso-nance Imaging: Comparison with 1.5T and 3.0T Units. J.
Radiat. Indt. 10(4):227-230.
Hayes CE and Roemer PB. 1990. Noise correlations in data simultaneously acquired from multiple surface coil arrays.
Magn. Reson. Med. 16:181-191.
Herrick RC, Hayman LA, Taber KH, Diaz-Marchan PJ and Kuo MD. 1997. Artifacts and pitfalls in MR imaging of the orbit: A clinical review. Radiographics 17:707-724. Kanematsu M, Hoshi H, Itoh K, Murakami T, Hori M, Kondo H,
Yokoyama R and Nakamura H. 1999. Focal hepatic lesion detection: comparison of four fat suppressed T2-weighted MR imaging pulse sequences. Radiology 211:363-371. Keogan MT and Eldelman RR. 2001. Technologic advances in
abdominal MR imaging. Radiology 220:310-320.
Kweon DC. 2016. Experimental study of chemical shift arti-facts at 1.5T and 3.0T MRI using gradient echo pulse se-quence. J. Korean. Soc. Radiol. 10:530-537.
Masuda J, Nabika T and Notsu Y. 2001. Silent stroke: patho-genesis, genetic factors and clinical implications as a risk factor. Curr. Opin. Neurol. 14:77-82.
Pauleit D, Textor J, Bachmann R, Conrad R, Flacke S, Kreft B and Schild H. 2001. Improving the detectability of focal liver lesions on T2-weighted MR images: ultrafast breath-hold or respiratory-triggered thin-section MRI? J. Magn.
Reson. Imaging. 14:128-133.
Priolaa AM, Priolaa SM, Gneda D, Giraudob MT, Fornaric A and Veltria A. 2016. Comparison of CT and chemical-shift
MRI for differentiating thymoma from non-thymomatous conditions in myasthenia gravis: value of qualitative and quantitative assessment. Clin. Radiol. 71:157-169.
Ragab Y, Emad Y, Gheita T, Mansour M, Abou-Zeid A, Ferrari S and Rasker JJ. 2009. Differentiation of osteoporotic and neoplastic vertebral fractures by chemical shift(in-phase and out-of phase) MR imaging. Eur. J. Radiol. 72:125-133. Roemer PB, Edelstein WA, Hayes CE, Souza SP and Mueller
OM. 1990. The NMR phased array. Magn. Reson. Med. 16: 192-225.
Ward J. 2006. New MR techniques for the detection of liver metastases. Cancer Imaging 6:33-42.
Zhu C, Haraldsson H, Faraji F, Owens C, Gasper W, Ahn S, Liu J, Laub G, Hope MD and Saloner D. 2016. Isotropic 3D black blood MRI of abdominal aortic aneurysm wall and intraluminal thrombus. Magn. Reson. Imaging 34:18-25.
Received: 29 December 2017 Revised: 15 January 2018 Revision accepted: 12 February 2018