저작자표시-비영리-변경금지 2.0 대한민국 이용자는 아래의 조건을 따르는 경우에 한하여 자유롭게 l 이 저작물을 복제, 배포, 전송, 전시, 공연 및 방송할 수 있습니다. 다음과 같은 조건을 따라야 합니다: l 귀하는, 이 저작물의 재이용이나 배포의 경우, 이 저작물에 적용된 이용허락조건 을 명확하게 나타내어야 합니다. l 저작권자로부터 별도의 허가를 받으면 이러한 조건들은 적용되지 않습니다. 저작권법에 따른 이용자의 권리는 위의 내용에 의하여 영향을 받지 않습니다. 이것은 이용허락규약(Legal Code)을 이해하기 쉽게 요약한 것입니다. Disclaimer 저작자표시. 귀하는 원저작자를 표시하여야 합니다. 비영리. 귀하는 이 저작물을 영리 목적으로 이용할 수 없습니다. 변경금지. 귀하는 이 저작물을 개작, 변형 또는 가공할 수 없습니다.
A THESIS
FOR THE DEGREE OF DOCTOR OF PHILOSOPHY
Exploration of Stress Biomarkers in Disk Abalone by
cDNA Microarray Technique
Qiang Wan
Department of Biotechnology
GRADUATE SCHOOL
JEJU NATIONAL UNIVESITY
Exploration of Stress Biomarkers in Disk Abalone by
cDNA Microarray Technique
(Supervised by Professor Jehee Lee)
A thesis submitted in partial fulfillment of the requirement of
the degree
Department of
GRADUATE SCHOO
JEJU NATIONAL UNIVERSITY
Exploration of Stress Biomarkers in Disk Abalone by
cDNA Microarray Technique
Qiang Wan
(Supervised by Professor Jehee Lee)
A thesis submitted in partial fulfillment of the requirement of
of DOCTOR OF PHILOSOPHY
2011.02
Department of Biotechnology
GRADUATE SCHOOL
JEJU NATIONAL UNIVERSITY
Exploration of Stress Biomarkers in Disk Abalone by
A thesis submitted in partial fulfillment of the requirement of
2011-02 Date
CONTENTS
요약... I Summary ... V List of Figures ... IX List of Tables ... XI
Chapter I. Global profiling of gene expression in disk abalone Haliotis discus discus
challenged with various environmental stressors by cDNA microarray ... 1
Abstract ... 2
1. Introduction ... 3
2. Materials and Methods 2.1 Animals, treatments and experimental design ... 4
2.2 cDNA library construction and microarray printing ... 5
2.3 RNA isolation, fluorescent labeling and hybridization ... 6
2.4 Microarray data analysis ... 7
2.5 Real-time PCR validation ... 8
3. Results and Discussions 3.1 Overview of gene expression profiling in abalone by cDNA microarray ... 10
3.2 Microarray analysis of expression response to physical stressors ... 18
3.3 Microarray analysis of expression response to heavy metal pollutants ... 37
3.4 Microarray analysis of expression response to organic EDCs ... 55
Chapter II. HSP20 of disk abalone Haliotis discus disucs as a novel universal biomarker of environmental stresses ... 74
Abstract ... 75
1. Introduction ... 76
2. Materials and Methods 2.1 Chemicals and reagents ... 78
2.2 Animals ... 78
2.3 Cloning and recombinant expression of abalone HSP20 ... 79
2.4 Thermotolerance of E. coli BL21(DE3) expressing abalone HSP20 ... 79 2.5 Multiple-alignment, Phylogenetic analysis and Homology modeling of abalone HSP20 80
2.6 Quantitative reverse transcription PCR (qRT-PCR) analysis of abalone HSP20
expression ... 81
3. Results 3.1 Cloning and sequence analysis of abalone HSP20 ... 82
3.2 Recombinant expression and purification of abalone HSP20 ... 87
3.3 Enhanced thermotolerance of E. coli cells overexpressing abalone HSP20 ... 90
3.4 Tissue distribution of HSP20 mRNA in disk abalone ... 92
3.5 Expression of abalone HSP20 in response to physical stress ... 92
3.6 Expression of abalone HSP20 in response to marine pollutants exposure ... 98
4. Discussion ... 101
Chapter III. Validation of housekeeping genes as internal controls for studying biomarkers of endocrine-disrupting chemicals in disk abalone by real-time PCR ... 108
Abstract ... 109
1. Introduction ... 110
2. Materials and Methods 2.1 Animals ... 111
2.2 Total RNA extraction and cDNA synthesis ... 112
2.3 Primer design and qRT-PCR analysis ... 112
2.4 Data processing and statistics ... 113
3. Results 3.1 General expression levels of twelve abalone HKGs ... 115
3.2 Relative expression levels of twelve abalone HKGs following EDCs exposure ... 117
3.3 Expression stability analysis and selection of the most suitable HKGs for normalization ... 120
3.4 Effect of different HKGs on biomarker gene quantification ... 122
4. Discussions ... 125
Reference ... 132
국문 국문 국문 국문요약요약요약 요약 전복은 복족류로써 고부가가치를 가지는 동물입니다. 다른 동물에 비하여 늦게 성장하고 주위의 환경적 변화에 대단히 민감합니다. 최근 몇십년에 있어서, 전세계적으로 전복의 수는 과잉수확, 기후변화, 환경오염 및 급작스런 병으로 인하여 급격히 감소하였습니다. 그동안 전복의 양식 과정에서 pH, 온도, 염분, 용존산소, 병원균등 이 같은 환경적 요인으로부터 전복의 체력과 생산 효율을 유지하는 것이 중요한 문제로 대두 되고 있습니다. 따라서, 이러한 스트레스 반응의 메커니즘을 이해하고, 그 후에 전복에 사용될 수 있는 적절한 스트레스바이오마커에 의한 조기경계 시스템을 개발하는 것은 매우 중요합니다. 이 논문에서는 이러한 연구를 3 개의 파트로 나누었으며 파트 I 에서는 cDNA microarray 를 통한 스트레스 반응에 뛰어난 유전자의 식별, 파트 II 에서는 바이오마커로서 스트레스 반응에 좋은 유전자의 기능적인 설명, 파트 III 에서는 바이오마커로써 활용이 가능한 housekeeping 유전자의 선택으로 이루어져 있습니다.
파트 I 에서는 까막전복 (Haliotis discus discus)으로부터 부분적인 유전적 정보를 얻어 이를 기초로 하여 cDNA 칩을 만들었습니다. 이렇게 만들어진 cDNA 칩은 4188 개의 까막전복의 유전자를 갖고 있었습니다. cDNA 칩을 통하여 까막전복의 유전적 발현 실험을 하였으며 다음과 같이 각각의 다른 환경적 요인을 적용하여 실험을 하였습니다. 열(30 oC), 냉기(10 oC), 저염분(25
psu), 고염분(40 psu)카드뮴(20ppm CdCl2), 구리(20ppm CuSO4), 수은(5ppm
HgCl2), PAHs ( 25ppmβ-NF), PCBs ( 50ppm Aroclor),및 TBT ( 2ppm TBT-Cl).
결과적으로 825 개의 유전자에서 유의적인 발현이 나타났으며 이는 전체 4188 개의 유전자 중에 20%정도를 차지합니다. 고온, 저온, 카드뮴
스트레스에서 각각 200 개 이상의 많은 유전자가 반응을 하였습니다. 염분, 구리, 수은, EDC 에서는 69-125 개의 유전자가 발현 변화를 나타내었습니다. 고온 스트레스를 통하여 발현된 유전자는 protein folding, nucleic acid processing, metabolism 과 oxidative stress 등의 기능을 Gene ontology 분석을 통하여 나타내었습니다. 저온 스트레스를 통하여 발현된 유전자는 nucleic acid processing 과 metabolism 기능이 있다는 것을 알 수 있었습니다. 염분 스트레스를 통한 실험에서는 biosynthesis and metabolism 기능을 갖고 있었습니다. 중금속 스트레스를 통한 실험에서는 protein synthesis, molecular chaperone, proteolysis 과 apoptosis regulation 기능을 갖고 있었습니다. 3 가지의 EDC 실험에서는 유전자는 많지 않았으며 transport, apoptosis regulation, innate immunity 의 기능을 갖고 있었습니다. 각각의 실험중에서도 서로 겹치는 동일한 유전자인 small HSP, kruppel factor, programmed cell death 5, insulin-related peptide binding protein and cholinergic receptor 를 찾았으며 이는 매우 중요한 유전자로 인식을 하였습니다. 이유는 다른 환경요인적 스트레스에도 같은 기작을 갖고 있으며 스트레스 반응 네트워크에 중점적인 유전자이기 때문입니다.
파트 II 에서는 저분자 heat shock protein 인 HSP20 를 중심으로 실험을 하였으며 이 유전자는 실험을 한 모든 요인에서 매우 높은 발현을 나타내었기
때문입니다. 이는 스트레스마이오마커로써의 가능성을 내보입니다.
분자유전학적으로 이 유전자를 연구하기 위하여 전형적인 구조적 특징인 α–crystallin domain, Cysteine-free, Glx/Asx-rich 과 compact β-sandwich structure 을 내포하고 있었습니다. HSP20 재조합 단백질을 포함하고 있는 대장균 셀의 열 내성을 강화 할 수 있었습니다. qRT-PCR 의 표현 분석에 의해
까막전복의 HSP20 가 열쇼크에 의해 극단적으로 상승하였으며 최고 2000 배의 차이를 나타내었습니다. 또한 저온, 염분, 중금속 및 다양한 EDCs 에 의해서도 상당히 상승하였습니다. 이러한 결과는 cDNA microarray 분석에 의한 결과와 일치하고 있습니다. 이를 통하여 HSP20 유전자는 고온을 비롯하여 다양한 환경 요인에서도 유전자의 발현량이 상승한다는 것을 알 수 있었습니다. 이는 환경적 요인으로 인해 세포가 입는 데미지를 줄이기 위하여 chaperone 기능을 갖고 있다는 것을 알 수 있었습니다. HSP20 는 환경 스트레스에 매우 민감한 유전자이며 이는 전복의 건강상태를 완전히 반영할 수 있는 이상적인 바이오마커로서 사용이 가능할지도 모르겠습니다. 파트 3 에서는 housekeeping 유전자로 사용이 가능한지에 대해서 실험을 하였습니다. 총 12 개의 유전자를 실험하였으며 qRT-PCR 을 통하여 실험을 하였습니다. EDC 스트레스를 받은 까막전복의 아가미와 간췌장으로 실험을 하였습니다. 기존에 사용된 housekeeping 유전자 중에 18s rRNA, glyceraldehyde-3-phosphate dehydrogenase 과 β-actin 은 각각의 발현수준이 많이 변화하였으며 이는 housekeeping 유전자로 사용을 할 수 없다는 것을 나타내었습니다. 그렇기 때문에 우리는 이러한 housekeeping 유전자로 사용을 할 수 있는 새로운 유전자를 찾아야 했으며 다양한 실험에 사용된 유전자를 분석 한 결과 TBT 스트레스 실험에서는 ribosomal protein L-5, elongation factor 1 유전자가 매우 안정적으로 발현이 되었으며 E2 스트레스 실험에서는 ribosomal protein L-5/ succinate dehydrogenase 유전자가 안정적으로 발현이 되었습니다. 유전자의 발현 정도를 알아보기 위해 비교하는 housekeeping 유전자가 부적절한 경우, 이를 통해 실험의 결과가 부정확하거나 과대 혹은 과소 분석이 될 수 있습니다. 이것은 바이오마커의 정량을 얻기 위해서 안정하며
확인이 가능한 housekeeping 유전자를 확보하는 것이 중요하다는 것을 알 수 있었습니다. 결론적으로 본 논문에서는 DNA microarray 기술을 사용하여 까막전복의 스트레스 반응에 좋은 유전자를 찾기 위하여 전체적인 탐색을 실행 하였으며 많은 유전자들이 환경적 스트레스에 반응을 하여 변화를 하였으며 이는 감시를 위한 바이오마커로서 가능성이 있다는 것을 내비치고 있습니다. 그리고 이 연구에서 까막전복의 스트레스 반응에 따른 메커니즘을 분자유전학적으로 그 증거를 제공하였습니다. 지금까지는 저분자 HSP20 유전자만 기능적 분석을 하였습니다. 또한 이 유전자는 EDCs 를 통한 스트레스에서 housekeeping 유전자로써 사용이 가능하다고 여겨집니다. 전복의 스트레스 감시 시스템을 설립하기 위해서 이 밖에도 다양한 연구가 추가적으로 필요합니다.
Summary
Abalone is a family of gastropod molluscs with great economic values. However, abalone is relatively slow growing and highly sensitive to the change of ambient environment. In recent decades, the worldwide population of wild abalone has been declined steadily due to the overharvesting, climate change, environment pollution and/or disease outbreak. Meanwhile, for abalone in aquaculture process, how to maintain the heath and production efficiency of abalone by avoiding the stress from pathogens and environmental factors such as temperature, salinity, dissolved oxygen and pH is also a critical issue. Therefore, understanding the mechanisms of stress response and subsequently developing an early warning system by appropriate stress biomarkers in abalone is of great significance.
Our experimental works in this present study is consisted of three parts: I, identification of stress-responsive genes by cDNA microarray; II, functional characterization of an import stress-responsive gene as biomarker; III, selection of appropriate housekeeping genes for biomarker application. In Part I, on the basis of the partial transcriptomic information of disk abalone Haliotis discus discus obtained by our earlier works, we constructed a cDNA microarray composed of 4188 unique abalone genes. The cDNA microarray was then employed for the expression analysis of abalone genes in response to a set of environmental stressors: heat (30 oC), cold (10 oC), low-salinity (25 psu), high-salinity (40 psu), cadmium (20 ppm CdCl2), copper (20 ppm CuSO4), mercury (5 ppm HgCl2), PAHs (25 ppm β-NF),
PCBs (50ppm Aroclor) and TBT (2 ppm TBT-Cl). Following microarray assay, a real-time PCR analysis of 10 target genes was also conducted for microarray data validation. Then, in Part II we carried out molecular cloning, characterization and expression analysis for a small heat shock protein, which has shown great inducibility by various environmental stressors in microarray assay. The data accuracy of biomarker expression analysis is highly dependent on the selection of housekeeping gene as reference. In this regard, a systematic comparison of abalone housekeeping genes for biomarker monitoring of EDCs was finally conducted in
Part III.
Upon the challenges of different environmental stressors, a total of 825 genes were shown significant expression changes by cDNA microarray anlysis, over 20% of 4188 analyzed genes. Heat, cold and cadmium stress affected the highest number of genes (>200 in each), whereas the exposures of extreme salinities, copper, mercy and three organic EDCs represented only moderate impact on abalone global gene expression, with 69-125 differentially expressed genes. Gene ontology analysis revealed that genes associated with protein folding, nucleic acid processing, metabolism and oxidative stress were largely regulated by heat stress. While in cold stress, the genes associated with nucleic acid processing and metabolism exhibited as the predominant part of response. Following salinity changes, the genes in the process of biosynthesis and metabolism were highlighted. The genes elicited by heavy metals are mainly associated with the protein synthesis, molecular chaperone and proteolysis as well as the apoptosis regulation. Three organic EDCs significantly affected the least number of genes amongst all the environmental stressors. However, their expression patterns of quite similar where genes associated with transport, apoptosis regulation and innate immunity were commonly regulated. Importantly, we noted that there are considerable overlaps of differentially expressed genes between different stress conditions. Furthermore, we also identified a certain number of genes that commonly respond to various stress, such as small HSP, kruppel factor, programmed cell death 5, insulin-related peptide binding protein and cholinergic receptor. Taken together, the results indicated a crosstalk in the stress response pathways to different environmental stressors. These commonly responsive genes may perform as the key nodes of stress response network in abalone.
In disk abalone genome, we identified two putative small HSPs (HSP20 and HSP26). The HSP20 gene has registered the highest induction levels in several stress conditions by microarray analysis, indicating a potential as sensitive stress biomarker. Thereby, we carried out the further functional characterization for this gene. It exhibited several typical structural
characteristics such as conserved α–crystallin domain, Cysteine-free, Glx/Asx-rich and compact β-sandwich structure in C-terminal region. In addition, the over-expression of recombinant HSP20 protein could enhance the thermotolerance of E. coli cells in vivo. The expression analysis by qRT-PCR expression showed that abalone HSP20 was dramatically induced by heat shock (up to 2000-fold), but also significantly elevated by cold shock, extreme salinities, heavy metals and organic endocrine disrupting chemicals (EDCs). These data are consistent with the findings by cDNA microarray. Taken together, the data in the present study demonstrate positive correlations between the expression of abalone HSP20 and various environmental stressors. During stress, HSP20 probably plays protective roles against cellular damage as a molecular chaperone in abalone. HSP20 could be ideal as a sensitive biomarker to completely reflect the integrated severity of the environmental stress and the health condition of abalone in field.
In the work of housekeeping gene validation, relative expression levels of twelve candidate housekeeping genes were examined by qRT-PCR in gill and hepatopancreas of abalone following the challenge with tributyltin chloride and 17β-estradiol, respectively. The expression levels of several conventional HKGs, such as 18s rRNA, glyceraldehyde-3-phosphate dehydrogenase and β-actin, were significantly altered by challenges, indicating that they might not be suitable internal controls. Instead, ribosomal protein L-5/ elongation factor 1 and ribosomal protein L-5/ succinate dehydrogenase were shown as the most stable HKGs under TBT and E2 challenges, respectively. When unsuitable HKGs were used for normalization, the influence of two EDCs on biomarker was imprecisely overestimated or underestimated, which strongly emphasized the importance of selecting appropriately validated housekeeping genes for biomarker quantitation.
In conclusion, through the application of DNA microarray technology, we carried out a global exploration of stress-responsive genes in the transcriptome of disk abalone. A large number of genes have shown correlations between their expression and environmental stress, thus indicating potential as biomarkers for environmental monitoring. Our study also
provides the molecular evidences for stress response mechanisms in abalone. So far the functional characterization of these biomarker candidate genes is only carried out in a small HSP (HSP20). Also, the housekeeping validation for biomarker application is limited in the aspect of organic EDCs. Further efforts thereby will be needed to establish the stress monitoring system in abalone.
LIST OF FIGURES
Fig 1. Differentially expressed genes in response to different environmental stressors.
Fig 2. Hierarchical clustering analysis of differentially expressed genes of abalone under
different environmental stress.
Fig 3. Functional categorization of up- and down-regulated genes under heat stress. Fig 4. Functional categorization of up- and down-regulated genes under cold stress.
Fig 5. Functional categorization of up- and down-regulated genes under low-salinity stress. Fig 6. Functional categorization of up- and down-regulated genes under high-salinity stress. Fig 7. Overlapping of genes up- and down-regulated by physical stresses in abalone. Fig 8. Functional categorization of up- and down-regulated genes under cadmium stress. Fig 9. Functional categorization of up- and down-regulated genes under copper stress. Fig 10. Functional categorization of up- and down-regulated genes under cadmium stress. Fig 11. Overlapping of genes up- and down-regulated by different heavy metals in abalone. Fig 12. Functional categorization of up- and down-regulated genes under PAHs stress. Fig 13. Functional categorization of up- and down-regulated genes under PCBs stress. Fig 14. Functional categorization of up- and down-regulated genes under TBT stress. Fig 15. Overlapping of genes up- and down-regulated by different EDCs in abalone.
Fig 16. Comparison of the mRNA levels change estimated by cDNA microarray and
real-time PCR of ten selected genes.
Fig 17. Nucleotide and deduced amino acid sequences of abalone HSP20. Fig 18. Multiple-alignment of HSP20s from different species.
Fig 19. Neighbor-joining phylogenetic tree of different HSP20 genes. Fig 20. 3D modeling structure of abalone HSP20.
Fig 21. SDS-PAGE analysis of the recombinant abalone HSP20.
Fig 22. Thermaltolerance of E. coli cells overexpressing abalone HSP20. Fig 23. Tissue distribution of abalone HSP20 transcript.
Fig 24. Expression profiles of abalone HSP20 in response to physical stressors. Fig 25. Expression profiles of abalone HSP20 in response to heavy metal exposure.
Fig 26. Expression profiles of abalone abalone HSP20 in response to model EDCs exposure. Fig 27. Raw Ct values of twelve abalone HKGs and one biomarker gene CYP4 for different
tissues (gill and hepatopancreas), genders (male and female), and experimental conditions (control, 7-day exposure of 1.0 µg/L TBT and 100 µg/L E2).
Fig 28. Relative gene expression of twelve abalone HKGs following 7-day TBT and E2
challenges.
Fig 29. Average expression stability measure (M) of twelve abalone HKGs following
exposure to 1.0 µg/L TBT (A), 100 µg/L E2 (B) and overall (C), respectively.
Fig 30. Relative gene expression of biomarker gene CYP4 in abalone gill (A), and
hepatopancreas (B), following 7-day TBT and E2 challenges, with or without normalization to twelve housekeeping genes and a normalization factor (NF).
LIST OF TABLES
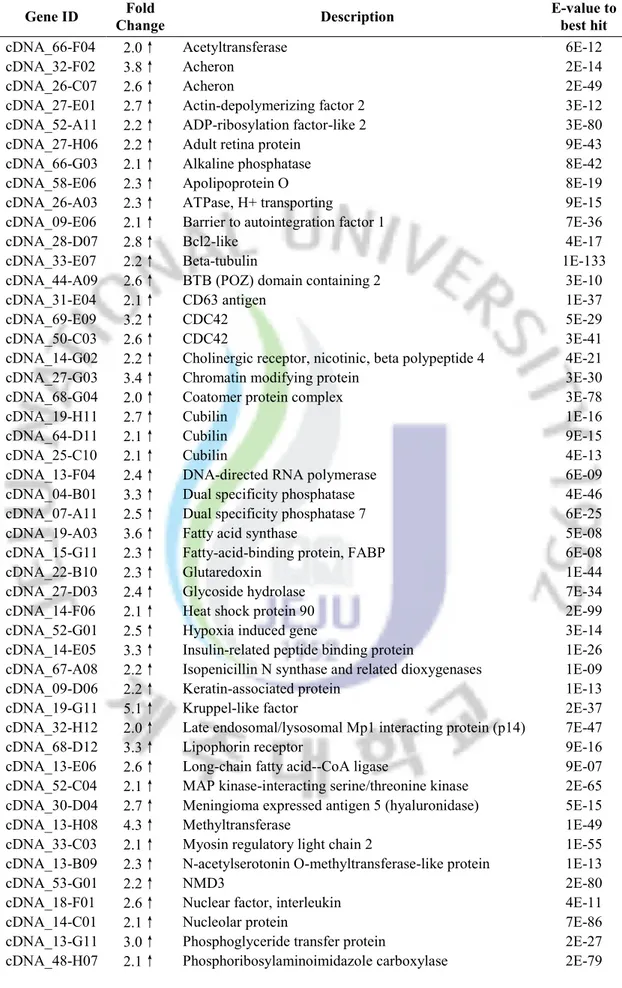
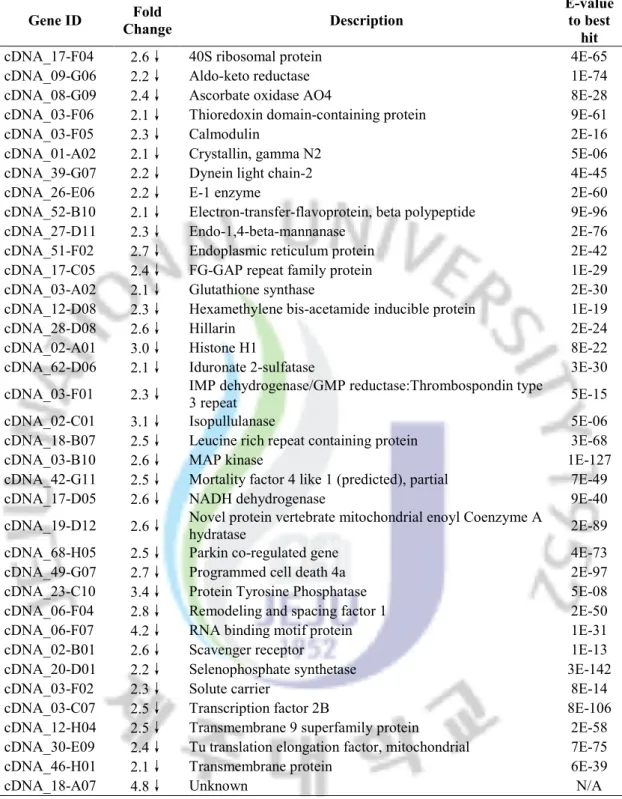
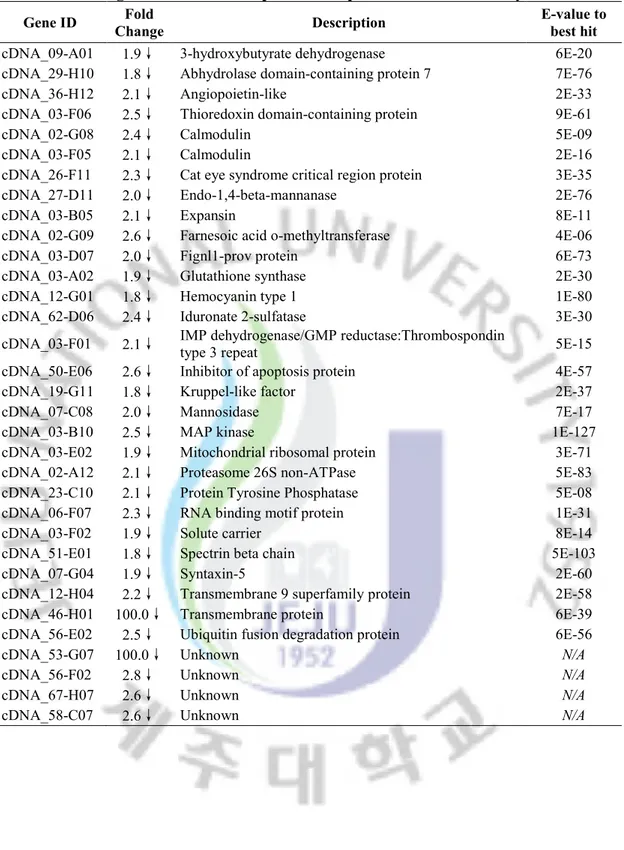
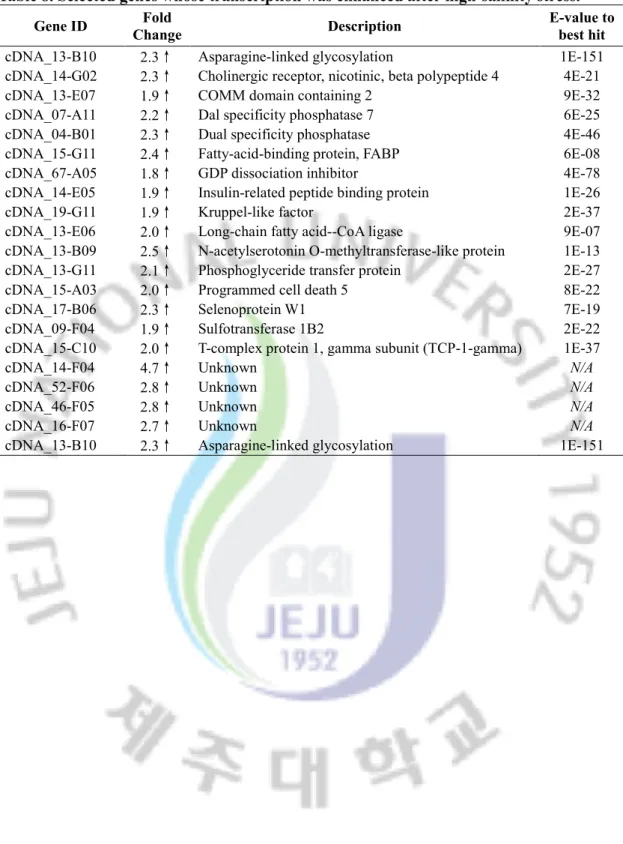
Table 1. List of primers used for Real-time PCR validation of ten abalone genes. Table 2. Selected genes whose transcription was enhanced after heat stress. Table 3. Selected genes whose transcription was repressed after heat stress. Table 4. Selected genes whose transcription was enhanced after cold stress. Table 5. Selected genes whose transcription was repressed after cold stress. Table 6. Selected genes whose transcription was enhanced after low-salinity stress. Table 7. Selected genes whose transcription was repressed after low-salinity stress. Table 8. Selected genes whose transcription was enhanced after high-salinity stress. Table 9. Selected genes whose transcription was repressed after high-salinity stress. Table 10. Selected genes whose transcription was enhanced after cadmium stress. Table 11. Selected genes whose transcription was repressed after cadmium stress. Table 12. Selected genes whose transcription was enhances after copper stress. Table 13. Selected genes whose transcription was repressed after copper stress. Table 14. Selected genes whose transcription was enhances after mercury stress. Table 15. Selected genes whose transcription was repressed after mercury stress. Table 16. Selected genes whose transcription was enhances after PAHs stress. Table 17. Selected genes whose transcription was repressed after PAHs stress. Table 18. Selected genes whose transcription was enhances after PCBs stress. Table 19. Selected genes whose transcription was repressed after PCBs stress. Table 20. Selected genes whose transcription was enhances after TBT stress. Table 21. Selected genes whose transcription was repressed after TBT stress.
Table 22. Candidate housekeeping genes, biomarker gene of interest and their specific
Chapter I.
Global profiling of gene expression in disk abalone Haliotis
discus discus challenged with various environmental stressors
Abstract
In the present study, a cDNA microarray composed of 4188 uinique genes was constructed and employed to profile gene expression pattern in the disk abalone (Haliotis discus discus) challenged with different environmental stressors including heat, cold, low-and high-salinity, heavy metals and endocrine-disrupting chemicals (EDCs). Following bioinformatic analysis, we identified a total of 825 genes responsive to these stress conditions. Approximately 50% of these genes are with no homology to known sequences or with unidentified functions, whereas the rest half of known genes are involved in a number of biological processes. In heat stress, the genes associated with protein folding, nucleic acid processing, metabolism and oxidative stress were largely regulated. In cold stress, the genes associated with nucleic acid processing and metabolism possessed the predominant proportion. In response to the stress due to salinity change, the genes in the process of biosynthesis and metabolism were highlighted. The exposure of heavy metals elicited the response of genes mainly involved in the synthesis, modification and catabolism of proteins as well as the apoptosis regulation. Three organic EDCs commonly affected the expression of genes involved in transport, apoptosis regulation and innate immunity. Additionally, through analyses of the overlapping gene expression pattern in different stress conditions, we identified several genes that commonly respond to various environmental stressors, as the key nodes in stress response network. Overall, data reported in our study provide novel insights into the molecular pathways that could mediate stress responses in abalone. The identified genes with differential expression in response to environmental stressors may be useful as potential novel biomarkers.
Key words: Abalone, Microarray, Environmental stress, Biomarker, Heavy metal, EDCs
1. Introduction
Abalone is an herbivorous mollusc species from the Haliotidae family. It is widely fished and cultured along the coastal lines of many countries, bringing great economic values. However, in recent decades, the wild population of abalone worldwide has been steadily declining. As a consequence, several species of abalone family, such as white abalone (H.
sorenseni), black abalone (H. cracherodii) and northern abalone (H. kamtschatkana), have
been listed on the red list as critically endangered (Hobday and Tegner). The deterioration of marine environment was considered as to virtually attribute the declines of abalones. Similar with other lifes in marine environment, wild abalone is constantly exposed to various biological and abiotic stressors that include the exposure to predators, food deprivation, pollutants, disease pathogens as well as the variations of ambient temperature, salinity and dissolved oxygen. Yet little is currently known about the underlying genes, proteins, molecular pathways, and physiological mechanisms in response to environmental stressors in abalone.
Our most extensive knowledge about stress response comes from studies carried out in other model organisms (Stronach and Perrimon 1999). It is described as an evolutionally high conserved defense mechanism that protects cells and organisms from threatening agents in their environment (Steinberg, Sturzenbaum et al. 2008). Physiologically speaking, stress response is referred to as a immediate cascade of neuroendocrine events that comprise the secretion of the hormones into the blood, the elevation of plasma glucose level and the increase of heart rate and metabolism in all vertebrates and some invertebrates as well (Wendelaar Bonga 1997; Lacoste, Malham et al. 2001). Meanwhile, at the cellular level, a set of stress proteins including molecular chaperones, cell cycle regulators, proteasome regulators, DNA repair proteins and enzymes involved in homeostasis of redox and energy metabolism often are also elicited during stress (Pearce and Humphrey 2001; Kultz 2005). If the stress is too severe and/or is chronic, however, protective mechanisms can be overridden,
resulting in several deleterious effects on individual organisms such as reduced growth rate, decreased disease resistance, altered behavior and reduced survivability. Therefore, to prevent the irreversible impacts of environment stress on wildlife and ecosystem, development of an early warning system based on the sensitively responsive biomarker genes are critically needed.
DNA microarray is a novel technology revolutionizing the basic and applied molecular biology and medical research and diagnosis. It allows scientists to study tens of thousands of genes at once, instead of working on a gene-by-gene basis. In the field of marine environmental monitoring, DNA microarray has become a significant tool for biomarker exploration. Measurements of global change in gene expression by DNA microarray have been widely conducted in several fish, shrimp and mollusc species; and a number of novel stress-specific and common stress-responsive genes have been identified as biomarker candidates (Venier, De Pitta et al. 2006; Evans and Somero 2008; Aoki, Wang et al. 2010). In addition, these experiments also represented the primary level of integration between environmental factors and their genomes, providing a comprehensive view of how an organism is responding to the change of its ambient environment and an ultimate guide to diagnose the major stressors. To identify stress-responsive genes and document widespread transcriptional changes occurring in the stress response of abalone species, we developed a cDNA microarray for disk abalone H. discus discus in the present study. To the best of our knowledge, this study describes the first utilization of cDNA microarray for the study of gene expression profiles of abalone exposed to different environmental stressors.
2. Materials and Methods
2.1 Animals, treatments and experimental design
Healthy two-year-old disk abalones (Haliotis discus discus) weighing 50-60 g and with well-developed gonads were obtained from the Youngsoo abalone farm on Jeju Island, South
Korea. Abalones were acclimated in laboratory aquaria for 1 week prior to the challenge experiment. The seawater was filtered and aerated continuously, with the salinity and temperature maintained at 32 ± 1 ‰, and 20 ± 1 °C, respectively. During the acclimation, abalones were fed daily with fresh seaweed diet. Thereafter, abalones were divided into three control groups and ten challenge groups, comprised of four abalones in each. To induced heat stress, we challenged abalones by an immersion in the seawater of 30oC for 6 hours; while for cold stress, the immersion was at 10oC for 24 hours. In the groups of high- and low- salinity, the salinity of seawater was adjusted to 40 psu and 25 psu by adding artificial sea salt or distilled water, respectively. For challenge, abalones were maintained in the seawater with the prepared salinities for 24 hours. In heavy metal challenge groups, CdCl2·2.5 H2O, CuSO4·5H2O or HgCl2 was dissolved in PBS and intramuscularly injected
into abalones at the dose of 20 µg, 20 µg and 4 µg per g body weight, respectively. In EDC challenge groups, beta-naphathoflavone (β-NF), aroclor-1254 (Aroclor) and tributyltin chloride (TBT) were dissolved in DMSO and intramuscularly injected into abalones at the dose of 20 µg, 50 µg and 2 µg per g body weight, respectively. The challenge of heavy metals and EDCs were carried out in duration of 24 hours. The control abalones for physical stress, heavy metal stress and EDC stress challenges were prepared by using untreated, PBS-injected and DMSO-injected animals, respectively. After challenge experiment, the gill tissues from the physical stress groups and the hepatopancreas tissues from the heavy metals and EDCs groups were dissected, frozen immediately in liquid nitrogen and stored at -80 oC.
2.2 cDNA library construction and microarray printing
The disk abalone cDNA library was constructed using mRNA isolated from different tissues of abalone (H. discus discus) and cDNA library construction kit (Creator SMART, Clontech, Mountain View, CA, USA). The cDNA library was normalized with a Trimmer-Direct normalization kit according to the manufacturer's protocol (Evrogen,
Moscow, Russia). After the massive sequencing by a Big Dye Terminator sequencing kit and ABI 3700 sequencer (Macrogen, Korea), sequences were further edited to remove vector and adaptor sequences, cleaned and filtered Cleaning involved masking of poor quality bases and low complexity sequences such as poly A tails. Filtering removed contaminating sequences (bacteria, yeast) and only high quality sequences of more than 100 bases in length were retained. Contigs were annotated using the BLASTX program (http://www.ncbi.nlm.nih.gov/BLAST/), and the entry to which they received the highest similarity was assigned as the gene identity. To construct cDNA microarray, the cDNA inserts of 4188 selected clones were amplified by PCR using adaptor-specific primers. The amplicons were examined by 1% agarose gel electrophoresis, purified using Sephadex G-50 columns, air-dried and resuspended in 50% DMSO solution. The purified amplicons were then spotted using an OmnigridTM Microarrayer (GeneMachine, San carlos, CA) onto silanized glass slides (GAPS-IITM, Corning, Charlotte, NC). Each slide was finally crosslinked with 300 mJ of short wave ultraviolet (UV) irradiation (Stratalinker, Stratagene, La Jolla, CA) and stored in humidity and light-controlled conditions until use.
2.3 RNA isolation, fluorescent labeling and hybridization
The gill or hepatopancrease total RNA from 4 stressed and 4 control animals for each stress challenge was isolated in the method of tissue pools using the Tri Reagent (Sigma,USA) according to the manufacturer’s protocol. The quality of all RNA preparations was confirmed prior to microarray hybridization with an Agilent Bioanalyzer 2100 (Agilent Technologies, Palo Alto, CA) using the RNA 6000 Nano Labchip kit (Agilent Technologies). For fluorescent cRNA synthesis, high-quality total RNA (150 ng) was labeled with Low RNA Input Fluorescent Linear Amplification Kit (Agilent Technologies) according to the manufacturer's instructions. In this procedure, cyanine 5-dCTP (Cy5) and cyanine 3-dCTP (Cy3) (PerkinElmer, Boston, MA, USA) were used to generate labeled cRNA from the
stress-treated RNA and the control RNA, respectively. Labeled cRNAs (0.75 µg each) from one treatment and the control were combined and fragmented in a hybridization mixture with the In Situ Hybridization Kit Plus (Agilent Technologies) according to the manufacturer's instructions. The mixture was hybridized for 17 h at 60 °C to the printed microarray, which carries probes to 4188 transcripts of abalone. After hybridization, the microarray was washed with SSC buffer, and then scanned in Cy3 and Cy5 channels with the Agilent DNA Microarray Scanner (model G2565BA).
2.4 Microarray data analysis
The signal intensity and local background of each spot generated from the Two channel scanned images with Feature Extraction Software version 7.5 (Agilent Technologies) in the default settings. Spots that did not pass quality control procedures in this software were flagged and removed from further analysis (abiding by the software's default settings). The data obtained were imported to GeneSpring GX 7.3 (Agilent Technologies) to normalize the ratio (Cy5/Cy3) of the signal intensities generated in each microarray in Lowess (locally weighted linear regression curve fit) method. On the basis of the Lowess-normalized ratios, analytical tools in GeneSpring GX were systematically employed to extract differentially expressed genes between all stress-treated samples and the controls. Thereafter, a statistical significance of the difference was examined by One-way analysis of variance (ANOVA) controlling false discovery rate (FDR) at the level of 0.05.The processed data were further analyzed using an integrated function in the GeneSpring GX software version 7.3 for gene tree clustering. Hierarchical cluster classifies samples according to their overall gene expression on the basis of correlations of their expression level pattern in all samples. To analyze the function of each differentially expressed abalone gene present in the microarray, gene ontology (GO) annotation was performed by means of the universal platform Blast2GO with a threshold cutoff at 10-3.
2.5 Real-time PCR validation
Microarray results were validated by real-time PCR of 10 target genes. Primers of 10 target genes were designed by using Primer 3 program with the size of amplicons ranged between 100 and 150 base pairs (Table. 1). Abalones were similarly challenged with different environmental stressors, and the total RNA was isolated as described above. First-strand cDNA was synthesized from 2.5 µg of total RNA and 500 ng of dT primer in a reaction volume of 20 µl, using SuperScript III reverse transcriptase (Invitrogen). PCR reactions were set up as follows: 12.5 µl of SYBR Premix Extaq (Takara), 1 µl of 10 µM sense and antisense gene-specific primers, 4 µl of cDNA template at a dilution of 1:20 and RNase-free water to a final volume of 25 µl. The Takara™ real time PCR detector TP800 was used for performing the amplification in triplicate. The thermal profile was programmed as follows: 3 min at 94°C, and 40 cycles of 20 s at 95°C for, 20 s at 60°C, and 30 s at 72°C. Dissociation curves were examined at the end of the PCR reaction to check for unspecific amplification and primer-dimers. PCR efficiency (E) was estimated for each primer pair by serial dilutions (from 1/20 to 1/640) of cDNA. The primers efficiency was determined by the slope of the standard curves by the following formula: E=10[−1/slope]. Real-time PCR Ct values were converted to expression level in the method of 2∆Ct. The obtained data were then compared to the microarray values.
3. Results and Discussions
3.1 Overview of gene expression profiling in abalone by cDNA
microarray
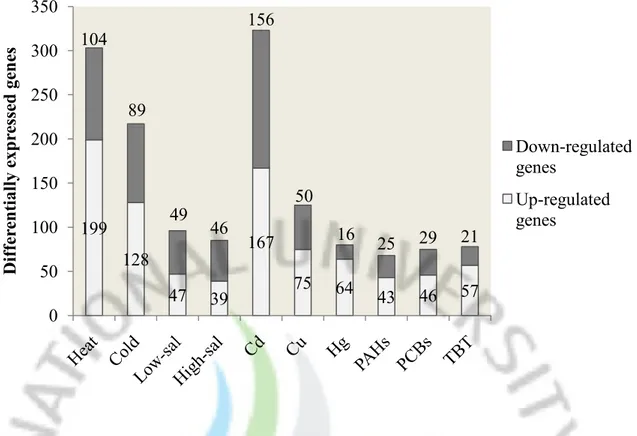
A disk abalone cDNA microarray chip containing 4188 spots was produced by printing a series of PCR products from the pre-constructed cDNA library. After microarray assay, the spot quality of each microarray chip was examined to filter the bad spots that are resulted from the poor-quality PCR products or printing have been eliminates. Finally, expression data of 4168 clones for heat, cold, low-salinity and high-salinity treatments, 4184 clones for cadmium, copper, PCBs and TBT treatments, and completely 4188 clones for mercury and PAHs treatment were retained after normalization and filtering. The additional data quality examination for each hybridization was also performed in the way of M-A and scatter plots. To identify the differentially expressed genes in response to different environmental stresssors, we applied two sets of criteria to the microarray data: a fold change cutoff of 2-fold for heat and cold stress treatment or a P value of 0.05 plus fold change cutoff of 1.8 for the other treatment. In total, 825 cDNA clones were identified as differentially expressed. The distribution pattern of these identified cDNA clones under different stress was illustrated in Figure 1. Heat, cold and cadmium stress possessed the highest number of differentially expressed genes (>200 in each), whereas the other seven environmental stressors represented more moderate impact on abalone global gene expression, with significant changes in 69-125 genes. In addition, to explore the relationship among the stress-responsive genes, the microarray data were further examined by hierarchical clustering analysis (Fig 2). Three trees were constructed according to gene expression patterns in physical stress, heavy metals and EDCs, respectively. The branch length of tree represents the similarity between genes.
Fig 1. Differentially expressed genes in response to different environmental stressors.
The number of significantly down-regulated (black bars) and up-regulated (white bars) genes in response to heat (cutoff of 2-fold), cold (cutoff of 2-fold), low-salinity (cutoff of 1.8-fold and P<0.05), high-salinity (cutoff of 1.8-fold and P<0.05), cadmium (cutoff of 1.8-fold and
P<0.05), copper (cutoff of 1.8-fold and P<0.05), mercury (cutoff of 1.8-fold and P<0.05,
PAHs (cutoff of 1.8-fold and P<0.05), PCBs (cutoff of 1.8-fold and P<0.05) and TBT (cutoff of 1.8-fold and P<0.05) are represented.
199 128 47 39 167 75 64 43 46 57 104 89 49 46 156 50 16 25 29 21 0 50 100 150 200 250 300 350 D if fe re n ti al ly exp re ss ed ge n es Down-regulated genes Up-regulated genes
Fig 2. Hierarchical clustering analysis of differentially expressed genes of abalone under different environmental stress. Each row represents a single gene and each column
an experimental sample. Genes were linked by the dendrogram shown on the left to illustrate similarity in their expression pattern. Up-regulated genes are red and down-regulated genes are green.
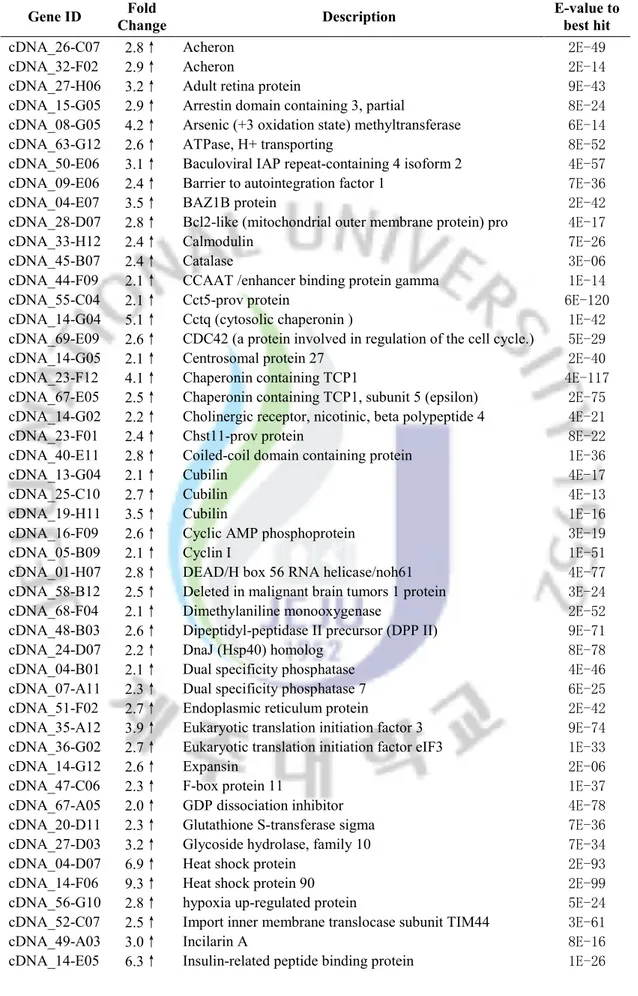
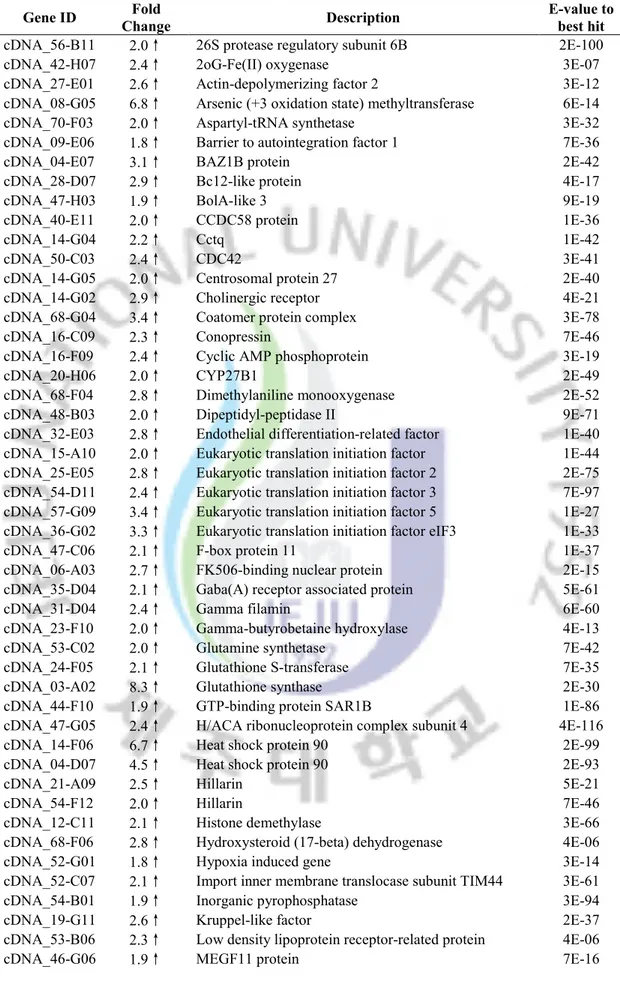
Table 2. Selected genes whose transcription was enhanced after heat stress.
Gene ID Fold
Change Description
E-value to best hit
cDNA_26-C07 2.8↑ Acheron 2E-49
cDNA_32-F02 2.9↑ Acheron 2E-14
cDNA_27-H06 3.2↑ Adult retina protein 9E-43
cDNA_15-G05 2.9↑ Arrestin domain containing 3, partial 8E-24 cDNA_08-G05 4.2↑ Arsenic (+3 oxidation state) methyltransferase 6E-14
cDNA_63-G12 2.6↑ ATPase, H+ transporting 8E-52
cDNA_50-E06 3.1↑ Baculoviral IAP repeat-containing 4 isoform 2 4E-57 cDNA_09-E06 2.4↑ Barrier to autointegration factor 1 7E-36
cDNA_04-E07 3.5↑ BAZ1B protein 2E-42
cDNA_28-D07 2.8↑ Bcl2-like (mitochondrial outer membrane protein) pro 4E-17
cDNA_33-H12 2.4↑ Calmodulin 7E-26
cDNA_45-B07 2.4↑ Catalase 3E-06
cDNA_44-F09 2.1↑ CCAAT /enhancer binding protein gamma 1E-14
cDNA_55-C04 2.1↑ Cct5-prov protein 6E-120
cDNA_14-G04 5.1↑ Cctq (cytosolic chaperonin ) 1E-42
cDNA_69-E09 2.6↑ CDC42 (a protein involved in regulation of the cell cycle.) 5E-29
cDNA_14-G05 2.1↑ Centrosomal protein 27 2E-40
cDNA_23-F12 4.1↑ Chaperonin containing TCP1 4E-117
cDNA_67-E05 2.5↑ Chaperonin containing TCP1, subunit 5 (epsilon) 2E-75 cDNA_14-G02 2.2↑ Cholinergic receptor, nicotinic, beta polypeptide 4 4E-21
cDNA_23-F01 2.4↑ Chst11-prov protein 8E-22
cDNA_40-E11 2.8↑ Coiled-coil domain containing protein 1E-36
cDNA_13-G04 2.1↑ Cubilin 4E-17
cDNA_25-C10 2.7↑ Cubilin 4E-13
cDNA_19-H11 3.5↑ Cubilin 1E-16
cDNA_16-F09 2.6↑ Cyclic AMP phosphoprotein 3E-19
cDNA_05-B09 2.1↑ Cyclin I 1E-51
cDNA_01-H07 2.8↑ DEAD/H box 56 RNA helicase/noh61 4E-77 cDNA_58-B12 2.5↑ Deleted in malignant brain tumors 1 protein 3E-24 cDNA_68-F04 2.1↑ Dimethylaniline monooxygenase 2E-52 cDNA_48-B03 2.6↑ Dipeptidyl-peptidase II precursor (DPP II) 9E-71
cDNA_24-D07 2.2↑ DnaJ (Hsp40) homolog 8E-78
cDNA_04-B01 2.1↑ Dual specificity phosphatase 4E-46
cDNA_07-A11 2.3↑ Dual specificity phosphatase 7 6E-25
cDNA_51-F02 2.7↑ Endoplasmic reticulum protein 2E-42
cDNA_35-A12 3.9↑ Eukaryotic translation initiation factor 3 9E-74 cDNA_36-G02 2.7↑ Eukaryotic translation initiation factor eIF3 1E-33
cDNA_14-G12 2.6↑ Expansin 2E-06
cDNA_47-C06 2.3↑ F-box protein 11 1E-37
cDNA_67-A05 2.0↑ GDP dissociation inhibitor 4E-78
cDNA_20-D11 2.3↑ Glutathione S-transferase sigma 7E-36 cDNA_27-D03 3.2↑ Glycoside hydrolase, family 10 7E-34
cDNA_04-D07 6.9↑ Heat shock protein 2E-93
cDNA_14-F06 9.3↑ Heat shock protein 90 2E-99
cDNA_56-G10 2.8↑ hypoxia up-regulated protein 5E-24
cDNA_52-C07 2.5↑ Import inner membrane translocase subunit TIM44 3E-61
cDNA_49-A03 3.0↑ Incilarin A 8E-16
cDNA_16-G04 2.6↑ Isocitrate dehydrogenase 2 (NADP+), mitochondrial 2E-130 cDNA_67-A08 2.1↑ Isopenicillin N synthase and related dioxygenases 1E-09
cDNA_19-G11 6.9↑ Kruppel-like factor 2E-37
cDNA_18-B07 2.1↑ Leucine rich repeat containing protein 3E-68 cDNA_53-B06 3.3↑ Low density lipoprotein receptor-related protein 3 4E-06 cDNA_52-C04 3.9↑ MAP kinase-interacting serine/threonine kinase 2E-65 cDNA_51-A12 4.1↑ Mu class glutathione S-transferase 1E-68
cDNA_01-F07 2.7↑ Muscle LIM protein 2E-35
cDNA_08-D04 3.6↑ MYND domain protein 5E-08
cDNA_61-F11 2.3↑ Myophilin-like protein 2E-41
cDNA_05-A09 2.1↑ Myosin II heavy chain 7E-79
cDNA_63-F12 2.2↑ Myosin regulatory light chain 2E-55 cDNA_13-B09 2.2↑ N-acetylserotonin O-methyltransferase-like protein 1E-13
cDNA_53-G01 2.1↑ NMD3 2E-80
cDNA_05-C08 2.7↑ Nonmuscle myosin essential light chain 5E-52 cDNA_49-F06 2.1↑ Novel protein vertebrate aldo-keto reductase family 1 3E-62
cDNA_18-F01 3.3↑ Nuclear factor, interleukin 4E-11
cDNA_44-B08 7.2↑ Omega class glutathione S-transferase 2E-37 cDNA_38-F03 9.6↑ Omega class glutathione S-transferase 3E-62 cDNA_21-F10 2.1↑ Oxidoreductase, zinc-binding dehydrogenase 2E-59
cDNA_02-H07 3.5↑ P23-like protein 1E-20
cDNA_13-G11 4.0↑ Phosphoglyceride transfer protein 2E-27 cDNA_48-H07 2.7↑ Phosphoribosylaminoimidazole carboxylase 2E-79 cDNA_35-D05 2.6↑ Phosphoribosylaminoimidazole carboxylase 3E-72
cDNA_14-E01 2.3↑ Poly(A) polymerase alpha 2E-101
cDNA_66-C09 2.6↑ Probable Beta-agarase 1E-09
cDNA_15-A03 2.5↑ Programmed cell death 5 8E-22
cDNA_11-G07 4.0↑ Proteasome beta 2E-72
cDNA_12-D11 3.0↑ Putative ubiquitin-conjugating enzyme 4E-77 cDNA_37-A09 2.1↑ pyruvate dehydrogenase complex, component X 6E-43
cDNA_30-E11 2.6↑ Scavenger receptor class F 2E-36
cDNA_17-B06 2.2↑ Selenoprotein W1 7E-19
cDNA_65-H04 2.0↑ SEP15_BRARE 15 kDa selenoprotein precursor 7E-37 cDNA_67-A07 4.1↑ Short-chain dehydrogenease/reductase 2E-72
cDNA_26-E09 9.4↑ Small heat shock protein 8E-10
cDNA_12-E05 2.8↑ Small nuclear ribonucleoprotein F 1E-35 cDNA_54-F10 3.9↑ Stress-induced-phosphoprotein (Hsp70/Hsp90-organizing
protein) 5E-53
cDNA_17-A09 4.3↑ Succinate-Coenzyme A ligase, ADP-forming, beta subunit 7E-60
cDNA_52-A03 3.3↑ Sulfatase 1 precursor 1E-86
cDNA_09-F04 2.0↑ Sulfotransferase 2E-22
cDNA_07-G03 2.0↑ SUMO1/sentrin/SMT3 specific protease 3 isoform 16 4E-175
cDNA_05-D01 3.3↑ T-complex polypeptide 0E+00
cDNA_15-C10 5.3↑ T-complex protein 1, gamma subunit (TCP-1-gamma) 1E-37
cDNA_39-G03 2.2↑ Thioredoxin 6E-18
cDNA_50-B06 3.3↑ Thioredoxin peroxidase 1E-86
cDNA_16-F10 2.4↑ Transgelin 2E-48
cDNA_18-A06 2.2↑ Twitchin 2E-64
cDNA_13-D01 2.6↑ Type I iodothyronine deiodinase 2E-11 cDNA_61-B11 2.4↑ U2 small nuclear ribonucleoprotein auxiliary factor large
subunit 8E-56
cDNA_54-F04 2.2↑ Universal stress protein 4E-11
cDNA_26-A05 5.6↑ Unknown N/A
cDNA_47-D02 5.8↑ Unknown N/A
cDNA_20-G12 6.0↑ Unknown N/A
cDNA_13-G03 7.4↑ Unknown N/A
cDNA_09-C05 7.7↑ Unknown N/A
cDNA_14-E06 7.8↑ Unknown N/A
cDNA_13-H02 9.8↑ Unknown N/A
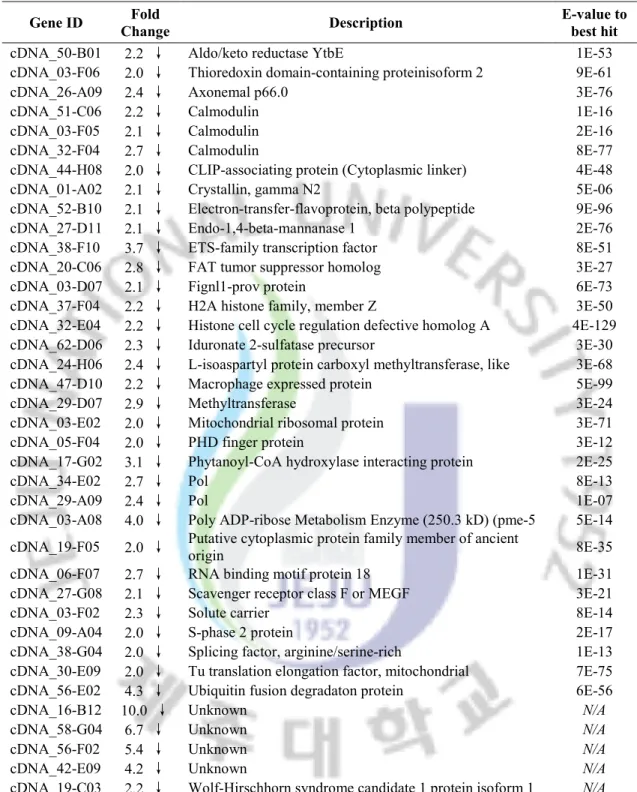
Table 3. Selected genes whose transcription was repressed after heat stress.
Gene ID Fold
Change Description
E-value to best hit
cDNA_50-B01 2.2 ↓ Aldo/keto reductase YtbE 1E-53
cDNA_03-F06 2.0 ↓ Thioredoxin domain-containing proteinisoform 2 9E-61
cDNA_26-A09 2.4 ↓ Axonemal p66.0 3E-76
cDNA_51-C06 2.2 ↓ Calmodulin 1E-16
cDNA_03-F05 2.1 ↓ Calmodulin 2E-16
cDNA_32-F04 2.7 ↓ Calmodulin 8E-77
cDNA_44-H08 2.0 ↓ CLIP-associating protein (Cytoplasmic linker) 4E-48
cDNA_01-A02 2.1 ↓ Crystallin, gamma N2 5E-06
cDNA_52-B10 2.1 ↓ Electron-transfer-flavoprotein, beta polypeptide 9E-96
cDNA_27-D11 2.1 ↓ Endo-1,4-beta-mannanase 1 2E-76
cDNA_38-F10 3.7 ↓ ETS-family transcription factor 8E-51
cDNA_20-C06 2.8 ↓ FAT tumor suppressor homolog 3E-27
cDNA_03-D07 2.1 ↓ Fignl1-prov protein 6E-73
cDNA_37-F04 2.2 ↓ H2A histone family, member Z 3E-50 cDNA_32-E04 2.2 ↓ Histone cell cycle regulation defective homolog A 4E-129 cDNA_62-D06 2.3 ↓ Iduronate 2-sulfatase precursor 3E-30 cDNA_24-H06 2.4 ↓ L-isoaspartyl protein carboxyl methyltransferase, like 3E-68 cDNA_47-D10 2.2 ↓ Macrophage expressed protein 5E-99
cDNA_29-D07 2.9 ↓ Methyltransferase 3E-24
cDNA_03-E02 2.0 ↓ Mitochondrial ribosomal protein 3E-71
cDNA_05-F04 2.0 ↓ PHD finger protein 3E-12
cDNA_17-G02 3.1 ↓ Phytanoyl-CoA hydroxylase interacting protein 2E-25
cDNA_34-E02 2.7 ↓ Pol 8E-13
cDNA_29-A09 2.4 ↓ Pol 1E-07
cDNA_03-A08 4.0 ↓ Poly ADP-ribose Metabolism Enzyme (250.3 kD) (pme-5 5E-14 cDNA_19-F05 2.0 ↓ Putative cytoplasmic protein family member of ancient
origin 8E-35
cDNA_06-F07 2.7 ↓ RNA binding motif protein 18 1E-31 cDNA_27-G08 2.1 ↓ Scavenger receptor class F or MEGF 3E-21
cDNA_03-F02 2.3 ↓ Solute carrier 8E-14
cDNA_09-A04 2.0 ↓ S-phase 2 protein 2E-17
cDNA_38-G04 2.0 ↓ Splicing factor, arginine/serine-rich 1E-13 cDNA_30-E09 2.0 ↓ Tu translation elongation factor, mitochondrial 7E-75 cDNA_56-E02 4.3 ↓ Ubiquitin fusion degradaton protein 6E-56
cDNA_16-B12 10.0 ↓ Unknown N/A
cDNA_58-G04 6.7 ↓ Unknown N/A
cDNA_56-F02 5.4 ↓ Unknown N/A
cDNA_42-E09 4.2 ↓ Unknown N/A
Fig 3. Functional categorization of up
Go annotations of differentially expressed genes are based on Blast2GO analysis for level 3 of the biological process category.
47%
Protein folding and modification Nucleic acid processing
Stress and stimulus response Cell signaling
Metabolism and biosynthesis Unknown function
67%
Protein folding and modification Nucleic acid processing
Stress and stimulus response Cell signaling
Metabolism and biosynthesis Unknown function
Functional categorization of up- and down-regulated genes under heat stress.
Go annotations of differentially expressed genes are based on Blast2GO analysis for level 3 of the biological process category.
5% 3% 6% 5% 9% 7%
Heat up-regulated genes
Protein folding and modification Protein catabolism
Nucleic acid processing Cell structure and cell adhesion Stress and stimulus response Transport
Cell proliferation and apoptosis Metabolism and biosynthesis Other functions
Unknown function
2% 3%
7% 2%
3%
67%
Heat down-regulated genes
Protein folding and modification Protein catabolism
Nucleic acid processing Cell structure and cell adhesion Stress and stimulus response Transport
Cell proliferation and apoptosis Metabolism and biosynthesis Other functions
Unknown function
regulated genes under heat stress. The
Go annotations of differentially expressed genes are based on Blast2GO analysis for level 3
4% 7%
4% 3% 5%
Cell structure and cell adhesion Cell proliferation and apoptosis
2% 3% 2% 0% 3% 6% 6%
Cell structure and cell adhesion Cell proliferation and apoptosis
3.2 Microarray analysis of expression response to physical stressors
Heat Temperature is one of the most important environmental factors affecting marine
organisms, determining their general metabolism, behavioral responses as well as the population distribution. As poikilotherms, abalone must adjust the body temperature to cope with the thermally variable environments. The transcriptomic analysis of abalone genes under extreme temperatures could be helpful in understanding the heat and cold adaption machinery of these animals. To induced heat stress, we used the sudden upshift in temperature from 20 to 30°C for 6 hours. A total of 303 genes were regulated by heat stress in abalone, including 199 up-regulated genes and 104 down-regulated genes. The genes with great fold change were selected and listed in Table 2 and Table 3. To further analyze and interpret the data, we classified all genes that were significantly regulated into 11 functional classes on the basis of their roles in different biological processes. For purpose of classification and illustration, each gene was assigned to only one primary functional category.
As shown in Fig 3, about half of the heat-induced genes were with no homology to known sequences or with unidentified functions, while the rest half of genes averagely fell into 10 different classes with percentages ranging from 3% to 9%. One of the most important impacts of heat stress on cell is the damage of cellular protein. As expected, we observed 10 genes in protein folding and modification category strongly induced by heat stress. They are comprised of 4 heat shock proteins (HSP) and 6 T-complex peptide (TCP) family proteins and registered the highest fold-change amongst all functional categories. Accumulation of these molecular chaperones could facilitate the fold of newly synthesized proteins and repair the misfolded proteins during heat stress. In addition, the expression of 6 protease or peptidase related genes in protein catabolism category were also enhanced, indicating the need of degradation of the abnormally folded protein. Not surprisingly, 14 genes of general stress and stimulus response were also significantly induced by heat stress. They possessed
the second large cluster of total heat-induced genes and include a set of antioxidant proteins like glutathione S-transferase, thioredoxin and thioredoxin peroxidase. This result is in agreement with the connection between heat shock and oxidative stress proposed by previous studies (Pappolla, Sos et al. 1996). The largest functional category in heat-induced genes is the metabolism and biosynthesis, which is comprised of 17 genes playing roles in macromolecule synthetic and carboharate metabolic processes. Importantly, the genes involved in carboharate metabolism could perform as cellular energy pools to fuel stress response and repair mechanisms. It has been proven that many post-translational mechanisms are important for regulating the proteins in this category. In this regard, they were absent of strong elevation in mRNA levels, generally with about 2-fold change. Similar to the findings in fish, a number of genes that encode abalone cytoskeletal proteins were also moderately induced (Podrabsky and Somero 2004; Buckley, Gracey et al. 2006). However, no such gene in this category was found to be regulated by heat shock in archaeon M.
barkeri or bacillus Y. pestis (Han, Zhou et al. 2005; Zhang, Culley et al. 2006). The
underlying mechanism is uncertain, but the accumulation of cytoskeletal proteins may be a general strategy to stabilize the eukaryotic cell structure at high temperature. 30°C is a fatal temperature for disk abalone (H. discus discus), leading to severe tissue and cellular injury. As a consequence, 9 genes in cell proliferation and apoptosis category were significantly induced. Of them, incilarin and bcl-2 are considered to positively regulate cell proliferation and inhibit the apoptotic effect caused by heat stress, but programmed cell death 5 (PCD5) has been reported to be able to enhance cell apoptosis by several investigations (Chen, Sun et al. 2001). On the other hand, three genes including one cyclin and two dual specificity phosphastases are the key molecules required for passage through the restriction point in cell cycle. It was demonstrated that exposing mammalian cells to heat stress conditions could result in transient cell cycle arrest at G1/S and thereby increase the cylclin level in a temperature- and time-dependent manner (Nitta, Okamura et al. 1997). Apart from these genes involved in the classical biological processes of stress response, we also noted a group
of genes (7% of total) with the other functions were up-regulated by heat. Similar to those genes with unknown functions, they may represent critical parts of heat stress adaption that not yet been identified and studied.
Compared with the profile of up-regulation, much larger proportion of genes repressed by heat stress (67%) were with no blast hit or with unidentified functions. As shown in Fig 3, the major negative regulation on abalone gene expression occurred in the category of nucleonic acid processing, which includes 7 genes responsible for ribosome modification (poly ADP-ribose Metabolism Enzyme), transcription control (ETS-family transcription factor), post-transcriptional regulation (splicing factor, arginine/serine-rich) and protein translation (Tu translation elongation factor). This finding suggested a generally reduced cellular pool of RNAs and proteins resulted by heat stress. Also, in the protein catabolism category, we found an ubiquitin fusion degradaton protein. The down-regulation of this protein is believed to faciliate the degradation of damaged proteins. In stress and stimulus response category we noted the repression of three putative calmodulin genes. Interestingly, they were reported to play roles in various stress conditions (Phean, Punteeranurak et al. 2005). In heat stress, Ca2+/calmodulin transduction pathways have been implicated in mediating heat shock signal transduction by promoting the DNA-bind activity of HSF (Liu, Li et al. 2003). Similar to the result of up-regulation, there are 6% of down-regulated genes involved in other biological processes. Further investigation is needed to elucidate their roles in stress response.
Table 4. Selected genes whose transcription was enhanced after cold stress.
Gene ID Fold
Change Description
E-value to best hit
cDNA_66-F04 2.0↑ Acetyltransferase 6E-12
cDNA_32-F02 3.8↑ Acheron 2E-14
cDNA_26-C07 2.6↑ Acheron 2E-49
cDNA_27-E01 2.7↑ Actin-depolymerizing factor 2 3E-12 cDNA_52-A11 2.2↑ ADP-ribosylation factor-like 2 3E-80
cDNA_27-H06 2.2↑ Adult retina protein 9E-43
cDNA_66-G03 2.1↑ Alkaline phosphatase 8E-42
cDNA_58-E06 2.3↑ Apolipoprotein O 8E-19
cDNA_26-A03 2.3↑ ATPase, H+ transporting 9E-15
cDNA_09-E06 2.1↑ Barrier to autointegration factor 1 7E-36
cDNA_28-D07 2.8↑ Bcl2-like 4E-17
cDNA_33-E07 2.2↑ Beta-tubulin 1E-133
cDNA_44-A09 2.6↑ BTB (POZ) domain containing 2 3E-10
cDNA_31-E04 2.1↑ CD63 antigen 1E-37
cDNA_69-E09 3.2↑ CDC42 5E-29
cDNA_50-C03 2.6↑ CDC42 3E-41
cDNA_14-G02 2.2↑ Cholinergic receptor, nicotinic, beta polypeptide 4 4E-21
cDNA_27-G03 3.4↑ Chromatin modifying protein 3E-30
cDNA_68-G04 2.0↑ Coatomer protein complex 3E-78
cDNA_19-H11 2.7↑ Cubilin 1E-16
cDNA_64-D11 2.1↑ Cubilin 9E-15
cDNA_25-C10 2.1↑ Cubilin 4E-13
cDNA_13-F04 2.4↑ DNA-directed RNA polymerase 6E-09
cDNA_04-B01 3.3↑ Dual specificity phosphatase 4E-46 cDNA_07-A11 2.5↑ Dual specificity phosphatase 7 6E-25
cDNA_19-A03 3.6↑ Fatty acid synthase 5E-08
cDNA_15-G11 2.3↑ Fatty-acid-binding protein, FABP 6E-08
cDNA_22-B10 2.3↑ Glutaredoxin 1E-44
cDNA_27-D03 2.4↑ Glycoside hydrolase 7E-34
cDNA_14-F06 2.1↑ Heat shock protein 90 2E-99
cDNA_52-G01 2.5↑ Hypoxia induced gene 3E-14
cDNA_14-E05 3.3↑ Insulin-related peptide binding protein 1E-26 cDNA_67-A08 2.2↑ Isopenicillin N synthase and related dioxygenases 1E-09
cDNA_09-D06 2.2↑ Keratin-associated protein 1E-13
cDNA_19-G11 5.1↑ Kruppel-like factor 2E-37
cDNA_32-H12 2.0↑ Late endosomal/lysosomal Mp1 interacting protein (p14) 7E-47
cDNA_68-D12 3.3↑ Lipophorin receptor 9E-16
cDNA_13-E06 2.6↑ Long-chain fatty acid--CoA ligase 9E-07 cDNA_52-C04 2.1↑ MAP kinase-interacting serine/threonine kinase 2E-65 cDNA_30-D04 2.7↑ Meningioma expressed antigen 5 (hyaluronidase) 5E-15
cDNA_13-H08 4.3↑ Methyltransferase 1E-49
cDNA_33-C03 2.1↑ Myosin regulatory light chain 2 1E-55 cDNA_13-B09 2.3↑ N-acetylserotonin O-methyltransferase-like protein 1E-13
cDNA_53-G01 2.2↑ NMD3 2E-80
cDNA_18-F01 2.6↑ Nuclear factor, interleukin 4E-11
cDNA_14-C01 2.1↑ Nucleolar protein 7E-86
cDNA_13-G11 3.0↑ Phosphoglyceride transfer protein 2E-27 cDNA_48-H07 2.1↑ Phosphoribosylaminoimidazole carboxylase 2E-79
cDNA_14-B04 2.9↑ Pim-3 protein 1E-91
cDNA_20-B04 2.1↑ Pinx1 protein 8E-62
cDNA_43-C03 2.0↑ Proteasome (prosome, macropain) 26S subunit, ATPase 2 2E-59
cDNA_57-D09 2.4↑ RAE1 RNA export 1 homolog 4E-113
cDNA_16-E07 2.1↑ Rho1 GTPase 1E-45
cDNA_67-A07 2.0↑ Short-chain dehydrogenease/reductase 2E-72 cDNA_50-D10 2.2↑ Small nuclear ribonucleoprotein D2-like protein 2E-47 cDNA_12-E05 2.3↑ Small nuclear ribonucleoprotein F 1E-35
cDNA_15-D06 2.0↑ Solute carrier 7E-17
cDNA_19-E02 2.3↑ Solute carrier 3E-113
cDNA_67-E06 2.2↑ Sorbitol dehydrogenase 2E-84
cDNA_28-F09 2.5↑ Stearoyl-CoA desaturase (delta-9-desaturase) 3E-72
cDNA_19-B11 2.1↑ Sterile20-like kinase 3E-40
cDNA_43-A06 3.9↑ Sterol regulatory element binding transcription factor 5E-58
cDNA_52-A03 3.4↑ Sulfatase 1 precursor 1E-86
cDNA_27-F03 3.8↑ Sulfotransferase 5E-27
cDNA_07-G03 2.1↑ SUMO1/sentrin/SMT3 specific protease 3 isoform 16 4E-175 cDNA_16-H09 3.3↑ Suppressor of cytokine signaling 2 4E-27 cDNA_15-C10 2.2↑ T-complex protein 1, gamma subunit 1E-37
cDNA_20-E05 2.7↑ Topoisomerase (DNA) 1E-45
cDNA_13-D01 2.2↑ Type I iodothyronine deiodinase 2E-11
cDNA_14-F04 7.4↑ Unknown N/A
cDNA_13-E01 6.8↑ Unknown N/A
cDNA_13-A04 5.9↑ Unknown N/A
cDNA_26-A05 4.3↑ Unknown N/A
cDNA_13-H02 3.7↑ Unknown N/A
Table 5. Selected genes whose transcription was suppressed after cold stress. Gene ID Fold Change Description E-value to best hit
cDNA_17-F04 2.6↓ 40S ribosomal protein 4E-65
cDNA_09-G06 2.2↓ Aldo-keto reductase 1E-74
cDNA_08-G09 2.4↓ Ascorbate oxidase AO4 8E-28
cDNA_03-F06 2.1↓ Thioredoxin domain-containing protein 9E-61
cDNA_03-F05 2.3↓ Calmodulin 2E-16
cDNA_01-A02 2.1↓ Crystallin, gamma N2 5E-06
cDNA_39-G07 2.2↓ Dynein light chain-2 4E-45
cDNA_26-E06 2.2↓ E-1 enzyme 2E-60
cDNA_52-B10 2.1↓ Electron-transfer-flavoprotein, beta polypeptide 9E-96
cDNA_27-D11 2.3↓ Endo-1,4-beta-mannanase 2E-76
cDNA_51-F02 2.7↓ Endoplasmic reticulum protein 2E-42
cDNA_17-C05 2.4↓ FG-GAP repeat family protein 1E-29
cDNA_03-A02 2.1↓ Glutathione synthase 2E-30
cDNA_12-D08 2.3↓ Hexamethylene bis-acetamide inducible protein 1E-19
cDNA_28-D08 2.6↓ Hillarin 2E-24
cDNA_02-A01 3.0↓ Histone H1 8E-22
cDNA_62-D06 2.1↓ Iduronate 2-sulfatase 3E-30
cDNA_03-F01 2.3↓ IMP dehydrogenase/GMP reductase:Thrombospondin type
3 repeat 5E-15
cDNA_02-C01 3.1↓ Isopullulanase 5E-06
cDNA_18-B07 2.5↓ Leucine rich repeat containing protein 3E-68
cDNA_03-B10 2.6↓ MAP kinase 1E-127
cDNA_42-G11 2.5↓ Mortality factor 4 like 1 (predicted), partial 7E-49
cDNA_17-D05 2.6↓ NADH dehydrogenase 9E-40
cDNA_19-D12 2.6↓ Novel protein vertebrate mitochondrial enoyl Coenzyme A
hydratase 2E-89
cDNA_68-H05 2.5↓ Parkin co-regulated gene 4E-73
cDNA_49-G07 2.7↓ Programmed cell death 4a 2E-97
cDNA_23-C10 3.4↓ Protein Tyrosine Phosphatase 5E-08
cDNA_06-F04 2.8↓ Remodeling and spacing factor 1 2E-50
cDNA_06-F07 4.2↓ RNA binding motif protein 1E-31
cDNA_02-B01 2.6↓ Scavenger receptor 1E-13
cDNA_20-D01 2.2↓ Selenophosphate synthetase 3E-142
cDNA_03-F02 2.3↓ Solute carrier 8E-14
cDNA_03-C07 2.5↓ Transcription factor 2B 8E-106
cDNA_12-H04 2.5↓ Transmembrane 9 superfamily protein 2E-58 cDNA_30-E09 2.4↓ Tu translation elongation factor, mitochondrial 7E-75
cDNA_46-H01 2.1↓ Transmembrane protein 6E-39
Fig 4. Functional categorization of up
Go annotations of differentially expressed genes are based on Blast2GO analysis for level 3 of the biological process category.
46%
Protein folding and modification Nucleic acid processing
Stress and stimulus response Cell signaling
Metabolism and biosynthesis Unknown function
51%
Protein folding and modification Nucleic acid processing
Stress and stimulus response Cell signaling
Metabolism and biosynthesis Unknown function
Functional categorization of up- and down-regulated genes under cold
Go annotations of differentially expressed genes are based on Blast2GO analysis for level 3 of the biological process category.
2% 2%
9% 5%
12% 5%
Cold up-regulated genes
Protein folding and modification Protein catabolism
Nucleic acid processing Cell structure and cell adhesion Stress and stimulus response Transport
Cell proliferation and apoptosis Metabolism and biosynthesis Other functions
Unknown function
3% 2%
8% 2%
13% 6%
Cold down-regulated genes
Protein folding and modification Protein catabolism
Nucleic acid processing Cell structure and cell adhesion Stress and stimulus response Transport
Cell proliferation and apoptosis Metabolism and biosynthesis Other functions
Unknown function
cold stress. The
Go annotations of differentially expressed genes are based on Blast2GO analysis for level 3
5% 3%
8%
3% 5%
Cell structure and cell adhesion Cell proliferation and apoptosis
2% 3%
5% 5%
2%
Cell structure and cell adhesion Cell proliferation and apoptosis