Early-onset mild cognitive
impairment in Parkinson’s disease:
Altered corticopetal cholinergic
network
Injoong Kim
1, Na-Young Shin
2, Yunjin Bak
2, Phil Hyu Lee
3, Seung-Koo Lee
4& Soo Mee Lim
5 Degeneration of the substantia innominata (SI) is significantly correlated with cognitive performance in Parkinson’s disease (PD). We examined functional and structural patterns of SI degeneration in drug-naïve PD patients according to the duration of parkinsonism before mild cognitive impairment (MCI) diagnosis. Twenty PD patients with a shorter duration (PD-MCI-SD, <1 year), 18 patients with a longer duration (PD-MCI-LD, ≥1 year), and 29 patients with intact cognition (PD-IC) were included. Seed-based resting-state functional connectivity (rsFC) analysis using bilateral SI seed and region-of-interest-based volumetric analysis were performed. Compared to PD-IC, the collapsed PD-MCI group showed altered rsFC in the right frontal and bilateral parietal areas. PD-MCI-SD showed rsFC alteration in broader frontal and parietal areas compared to the other groups. Decreased rsFC in the right frontal area was also significantly correlated with shorter disease duration. No significant SI volume change was found between the groups. Altered rsFC between the SI and the frontal and parietal areas might be relevant to cognitive dysfunction in PD. Decreased rsFC between the SI and frontal area might be associated with early-onset MCI, suggesting that cholinergic deficits in the frontal brain areas might play an important role in the acceleration of cognitive decline in PD.Parkinson’s disease (PD) is a neurodegenerative disease mainly characterized by motor symptoms1. However, a
substantial percentage of PD patients have non-motor symptoms as well. Cognitive dysfunction is a common non-motor symptom observed in PD patients and its severity varies from mild cognitive impairment (PD-MCI) to dementia (PDD)2, 3.
Although the neural basis for cognitive dysfunction in PD remains unknown, pathological and neuroim-aging studies suggest that the cholinergic system arising from the nucleus basalis of Meynert (NBM) located in the substantia innominata (SI) of the basal forebrain plays an important role in the cognitive functions of PD patients. Cortical cholinergic deficits resulting from NBM neuronal loss have been strongly correlated with cog-nitive impairment in a past study4. Also, a previous study using structural magnetic resonance imaging (MRI)
demonstrated that the SI volume in PD differs depending on cognitive status and that the SI volume is signifi-cantly correlated with cognitive performance5. Previous positron emission tomography (PET) studies using in
vivo imaging of cerebral acetylcholinesterase have also demonstrated that cholinergic dysfunction occurs even in
the early course of PD and that it is more widespread and profound in PDD6, 7.
Patients with early-onset of PDD are reported to have higher pathological burden8, 9. Therefore, we postulated
that PD patients with early-onset of MCI might also show more pathological burden on the cholinergic system of the SI than those with late-onset of MCI. This different underlying neuropathology may influence both the functional and structural patterns of SI degeneration. Given that cholinergic projections from the SI innervate the entire cerebral cortex, we need to identify the specific brain cortical regions relevant to early-onset MCI, in other words, rapid cognitive decline, to understand the underlying pathophysiology of SI degeneration and to define new treatment targets.
1Department of Radiology, Veterans Health Service Medical Center, Seoul, 05368, Korea. 2Department of Radiology,
College of Medicine, The Catholic University of Korea, Seoul, 06591, Korea. 3Department of Neurology, Yonsei
University College of Medicine, Seoul, 03722, Korea. 4Department of Radiology, Yonsei University College of Medicine,
Seoul, 03722, Korea. 5Department of Radiology, Ewha Womans University School of Medicine, Seoul, 07985, Korea.
Correspondence and requests for materials should be addressed to N.-Y.S. (email: [email protected]) Received: 17 January 2017
Accepted: 11 April 2017 Published: xx xx xxxx
Resting-state functional connectivity (rsFC) can be used to evaluate altered relationships between the SI and particular areas of the whole brain, which means it can be used to define brain regions relevant to rapid cognitive decline. We also measured the SI volume to see whether structural degeneration was associated with the cognitive decline rate. Accordingly, we aimed to define different functional as well as structural patterns of SI degeneration in drug-naïve PD patients according to the duration of parkinsonism before MCI diagnosis using resting-state functional MRI (rsfMRI) and region-of-interest (ROI)-based volumetric analyses.
Results
Demographic and clinical characteristics.
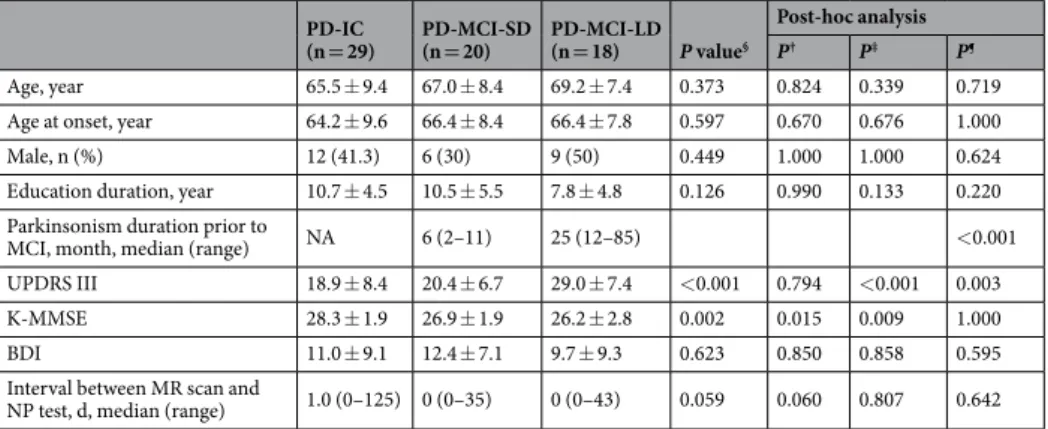
Among the 239 PD patients who underwent both MRI and neuropsychological tests, 38 age-, sex-, and years of education-matched drug-naïve patients were further classi-fied into 20 patients with a shorter duration of parkinsonism before MCI diagnosis (the PD-MCI-SD group, <1 year) and 18 patients with a longer duration (the PD-MCI-LD group, ≥1 year), respectively. Twenty-nine drug-naïve PD patients with intact cognition were also included for comparison (the PD-IC group). Demographic and clinical data of the patients are summarized in Table 1. The median duration of parkinsonism was 6.0 (range, 2–11) months in the PD-MCI-SD group and 25.0 (range, 12–85) months in the PD-MCI-LD group. The PD-MCI-LD group (29.0 ± 7.4) had a higher score in UPDRS-III, in other words, severer motor symptoms, compared to the PD-IC (18.9 ± 8.4; P < 0.001) and PD-MCI-SD groups (20.4 ± 6.7; P = 0.003). Both PD-MCI-SD (26.9 ± 1.9; P = 0.015) and PD-MCI-LD (26.2 ± 2.8; P = 0.009) groups had lower K-MMSE scores compared to the PD-IC group (28.3 ± 1.9). Other demographic and clinical characteristics were not significantly different between the groups.Group comparisons of Neuropsychological data.
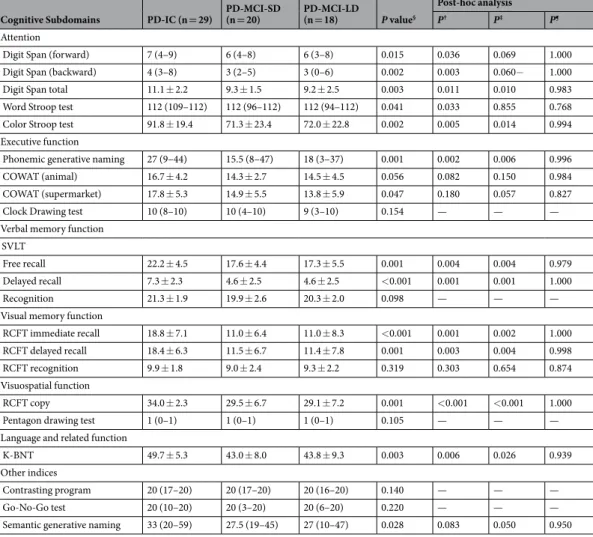
Neuropsychological data are summarized in Table 2. Compared to the PD-IC group, the PD-MCI groups showed lower performances on most neuropsychological tests, but there was no significant difference between the PD-MCI-SD and PD-MCI-LD groups for neuropsycho-logical performances.Group comparisons of SI volume.
There was no significant difference in SI volume between the col-lapsed PD-MCI group (0.977 ± 0.184 ml) and the PD-IC group (1.016 ± 0.147 ml; P = 0.359) as well as between all groups (PD-MCI-SD group, 0.971 ± 0.187 ml; PD-MCI-LD group, 0.984 ± 0.185 ml; and PD-IC group, 1.016 ± 0.147 ml; P = 0.641).Group comparisons of rsFC using the bilateral SI as the seed.
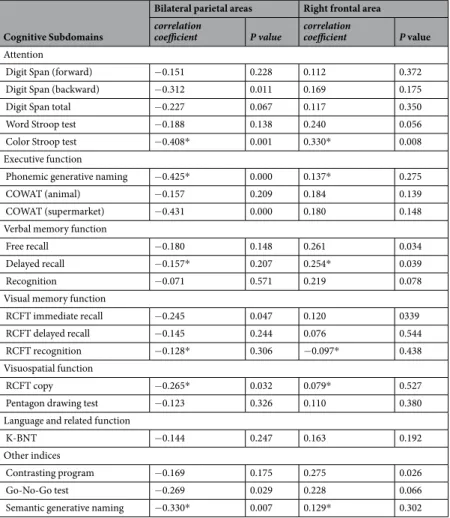
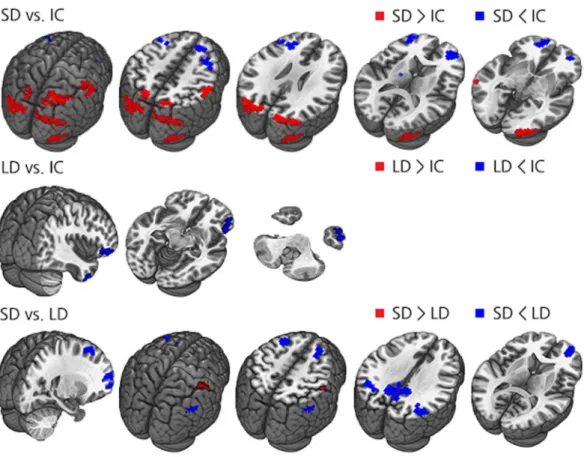
Compared to the PD-IC group, the collapsed PD-MCI group showed decreased rsFC in the right frontal area, while showing increased rsFC in the bilateral parietal and occipital areas (Fig. 1 and Supplementary Table 1). Decreased rsFC in the right frontal area was correlated with attention and verbal memory function. Increased rsFC in the bilateral posterior brain areas was significantly correlated with decreased attention, executive function, visuospatial and visual memory func-tion (Table 3).Compared to the PD-IC group, the PD-MCI-LD group exhibited decreased rsFC in a few small areas involv-ing the right inferior orbitofrontal and right inferior temporal gyri while no significantly increased rsFC was observed. On the other hand, the PD-MCI-SD group exhibited substantial altered rsFC relative to the PD-IC
PD-IC
(n = 29) PD-MCI-SD (n = 20) PD-MCI-LD (n = 18) P value§
Post-hoc analysis
P† P‡ P¶
Age, year 65.5 ± 9.4 67.0 ± 8.4 69.2 ± 7.4 0.373 0.824 0.339 0.719 Age at onset, year 64.2 ± 9.6 66.4 ± 8.4 66.4 ± 7.8 0.597 0.670 0.676 1.000
Male, n (%) 12 (41.3) 6 (30) 9 (50) 0.449 1.000 1.000 0.624
Education duration, year 10.7 ± 4.5 10.5 ± 5.5 7.8 ± 4.8 0.126 0.990 0.133 0.220 Parkinsonism duration prior to
MCI, month, median (range) NA 6 (2–11) 25 (12–85) <0.001
UPDRS III 18.9 ± 8.4 20.4 ± 6.7 29.0 ± 7.4 <0.001 0.794 <0.001 0.003 K-MMSE 28.3 ± 1.9 26.9 ± 1.9 26.2 ± 2.8 0.002 0.015 0.009 1.000
BDI 11.0 ± 9.1 12.4 ± 7.1 9.7 ± 9.3 0.623 0.850 0.858 0.595
Interval between MR scan and
NP test, d, median (range) 1.0 (0–125) 0 (0–35) 0 (0–43) 0.059 0.060 0.807 0.642
Table 1. Demographic and clinical characteristics of the PD-IC group and PD-MCI groups according to
the duration of parkinsonism before MCI diagnosis. Abbreviations: BDI = Beck Depression Inventory; K-MMSE = the Korean version of the Mini Mental State Examination; MCI = mild cognitive impairment; n = number; NP test = neuropsychological test; IC = Parkinson’s disease with intact cognition; PD-MCI-SD = Parkinson’s disease with a shorter duration of parkinsonism before mild cognitive impairment diagnosis; PD-MCI-LD = Parkinson’s disease with a longer duration of parkinsonism before mild cognitive impairment diagnosis; UPDRS III = Unified Parkinson’s Disease Rating Scale Part III. Note.-Unless otherwise indicated, data are means ± standard deviations. §P values for comparison among the 3 groups; †P values for comparison between the PD-IC and PD-MCI-SD groups; ‡P values for comparison between the IC and PD-MCI-LD groups; ¶P values for comparison between the PD-MCI-SD and PD-MCI-LD groups.
Cognitive Subdomains PD-IC (n = 29) PD-MCI-SD (n = 20) PD-MCI-LD (n = 18) P value§
Post-hoc analysis
P† P‡ P¶
Attention
Digit Span (forward) 7 (4–9) 6 (4–8) 6 (3–8) 0.015 0.036 0.069 1.000 Digit Span (backward) 4 (3–8) 3 (2–5) 3 (0–6) 0.002 0.003 0.060− 1.000 Digit Span total 11.1 ± 2.2 9.3 ± 1.5 9.2 ± 2.5 0.003 0.011 0.010 0.983 Word Stroop test 112 (109–112) 112 (96–112) 112 (94–112) 0.041 0.033 0.855 0.768 Color Stroop test 91.8 ± 19.4 71.3 ± 23.4 72.0 ± 22.8 0.002 0.005 0.014 0.994 Executive function
Phonemic generative naming 27 (9–44) 15.5 (8–47) 18 (3–37) 0.001 0.002 0.006 0.996 COWAT (animal) 16.7 ± 4.2 14.3 ± 2.7 14.5 ± 4.5 0.056 0.082 0.150 0.984 COWAT (supermarket) 17.8 ± 5.3 14.9 ± 5.5 13.8 ± 5.9 0.047 0.180 0.057 0.827
Clock Drawing test 10 (8–10) 10 (4–10) 9 (3–10) 0.154 — — —
Verbal memory function SVLT
Free recall 22.2 ± 4.5 17.6 ± 4.4 17.3 ± 5.5 0.001 0.004 0.004 0.979 Delayed recall 7.3 ± 2.3 4.6 ± 2.5 4.6 ± 2.5 <0.001 0.001 0.001 1.000
Recognition 21.3 ± 1.9 19.9 ± 2.6 20.3 ± 2.0 0.098 — — —
Visual memory function
RCFT immediate recall 18.8 ± 7.1 11.0 ± 6.4 11.0 ± 8.3 <0.001 0.001 0.002 1.000 RCFT delayed recall 18.4 ± 6.3 11.5 ± 6.7 11.4 ± 7.8 0.001 0.003 0.004 0.998 RCFT recognition 9.9 ± 1.8 9.0 ± 2.4 9.3 ± 2.2 0.319 0.303 0.654 0.874 Visuospatial function
RCFT copy 34.0 ± 2.3 29.5 ± 6.7 29.1 ± 7.2 0.001 <0.001 <0.001 1.000
Pentagon drawing test 1 (0–1) 1 (0–1) 1 (0–1) 0.105 — — —
Language and related function
K-BNT 49.7 ± 5.3 43.0 ± 8.0 43.8 ± 9.3 0.003 0.006 0.026 0.939
Other indices
Contrasting program 20 (17–20) 20 (17–20) 20 (16–20) 0.140 — — —
Go-No-Go test 20 (10–20) 20 (3–20) 20 (6–20) 0.220 — — —
Semantic generative naming 33 (20–59) 27.5 (19–45) 27 (10–47) 0.028 0.083 0.050 0.950 Table 2. Neuropsychological data in the PD-IC group and PD-MCI groups according to the duration
of parkinsonism before MCI diagnosis. Abbreviations: MCI = mild cognitive impairment; n = number; PD-IC = Parkinson’s disease with intact cognition; PD-MCI-SD = Parkinson’s disease with a shorter duration of parkinsonism before mild cognitive impairment diagnosis; PD-MCI-LD = Parkinson’s disease with a longer duration of parkinsonism before mild cognitive impairment diagnosis; COWAT = Controlled Oral Word Association Test; SVLT = Seoul Verbal Learning Test; RCFT = Rey complex figure test; K-BNT = Korean version of the Boston Naming Test. Note.-Unless otherwise indicated, data are means ± standard deviations. §P values for comparison among the 3 groups; †P values for comparison between the PD-IC and PD-MCI-SD groups; ‡P values for comparison between the PD-IC and PD-MCI-LD groups; ¶P values for comparison between the PD-MCI-SD and PD-MCI-LD groups.
Figure 1. Group comparison of rsFC using the bilateral SI as the seed between the collapsed PD-MCI
group and PD-IC group. Abbreviations: PD-MCI = Parkinson’s disease with mild cognitive impairment; PD-IC = Parkinson’s disease with intact cognition; rsFC =resting-state functional connectivity; SI = Substantia innominata.
in the bilateral parietal and occipital areas (Fig. 2 and Supplementary Table 1). Increased rsFC in the posterior cortical areas was attributable to loss of anti-correlation, while decreased rsFC in the frontal areas was attributable to declined positive correlation noted in the PD-IC group (Supplementary Figure 1).
When the PD-MCI-SD and PD-MCI-LD groups were directly compared, the PD-MCI-SD group showed decreased rsFC in the bilateral frontal and parietal areas including the precuneus, while increased functional con-nectivity was observed in the right primary somatosensory area (Fig. 2 and Supplementary Table 1). Significant group differences in the bilateral parietal areas and precuneus were attributable to the opposite direction of rsFC with the bilateral SI seed between the PD-MCI groups: positive correlation in the PD-MCI-LD group and nega-tive correlation in the PD-MCI-SD group. On the other hand, decreased rsFC in the bilateral frontal areas was due to prominent anti-correlation between the bilateral SI seed in the PD-MCI-SD group (Supplementary Figure 2).
To define brain regions relevant to disease duration, Spearman’s correlation analysis was performed between disease duration and rsFC in areas which showed significant group differences in PD-MCI-SD compared to both PD-MCI-LD and PD-IC. Among the three overlapped areas, only the right anterior frontal area (Montreal Neurological Institute [MNI] coordinates [x = 24, y = 57, z = 6]) showed significant associations between decreased rsFC and shorter disease duration (ρ = 0.277, P = 0.023; Fig. 3).
Discussion
In this study, there was no significant structural change in SI between the groups; however, we found altered rsFC in the corticopetal cholinergic network according to not only the cognitive status but also duration of parkinson-ism before MCI diagnosis in PD patients. There were three main findings in this study. First, decreased rsFC in the frontal areas and increased rsFC in the parietal areas with SI seed were associated with cognitive decline in drug-naïve PD patients. Second, patients with early-onset of MCI had prominent rsFC changes in these cognitive dysfunction-related areas, while little change was found in patients with late-onset of MCI. Lastly, decreased rsFC in the frontal area was associated with shorter disease duration before MCI diagnosis, suggesting that this area possibly plays a role in increasing the rate of cognitive decline.
In the present study, altered rsFC between the frontal and parietal areas with the bilateral SI seed was related with cognitive decline in PD patients. This result corresponds with previous imaging studies10, 11, which
demon-strated a correlation between cognitive decline and progressive degeneration in the frontal and parietal
corti-Cognitive Subdomains
Bilateral parietal areas Right frontal area correlation
coefficient P value correlation coefficient P value Attention
Digit Span (forward) −0.151 0.228 0.112 0.372
Digit Span (backward) −0.312 0.011 0.169 0.175
Digit Span total −0.227 0.067 0.117 0.350
Word Stroop test −0.188 0.138 0.240 0.056
Color Stroop test −0.408* 0.001 0.330* 0.008
Executive function
Phonemic generative naming −0.425* 0.000 0.137* 0.275
COWAT (animal) −0.157 0.209 0.184 0.139
COWAT (supermarket) −0.431 0.000 0.180 0.148
Verbal memory function
Free recall −0.180 0.148 0.261 0.034
Delayed recall −0.157* 0.207 0.254* 0.039
Recognition −0.071 0.571 0.219 0.078
Visual memory function
RCFT immediate recall −0.245 0.047 0.120 0339
RCFT delayed recall −0.145 0.244 0.076 0.544
RCFT recognition −0.128* 0.306 −0.097* 0.438
Visuospatial function
RCFT copy −0.265* 0.032 0.079* 0.527
Pentagon drawing test −0.123 0.326 0.110 0.380
Language and related function
K-BNT −0.144 0.247 0.163 0.192
Other indices
Contrasting program −0.169 0.175 0.275 0.026
Go-No-Go test −0.269 0.029 0.228 0.066
Semantic generative naming −0.330* 0.007 0.129* 0.302
Table 3. Correlation analysis between neuropsychological data and brain regions showing altered rsFC between
fronto-striatal network12, cholinergic dysfunction also contributes to frontal dysfunction. Previous studies have
reported that cholinergic hypometabolism in the frontal cortex was greater in PDD compared to non-demented PD and decreased cholinergic function showed decreased executive and attentional function13–15. So, it is not Figure 2. Group comparisons of rsFC using the bilateral SI as the seed in all group contrasts. Abbreviations:
PD-MCI-SD = Parkinson’s disease with a shorter duration of parkinsonism before mild cognitive impairment diagnosis; PD-MCI-LD = Parkinson’s disease with a longer duration of parkinsonism before mild cognitive impairment diagnosis; PD-IC = Parkinson’s disease with intact cognition; rsFC = resting-state functional connectivity; SI = Substantia innominata.
Figure 3. Correlation graph between the duration of parkinsonism before MCI diagnosis and rsFC between
the bilateral SI seed and conjunction mask of the bilateral frontal areas (r = 0.28, P = 0.023). Abbreviations: PD-MCI-SD = Parkinson’s disease with a shorter duration of parkinsonism before mild cognitive impairment diagnosis; PD-MCI-LD = Parkinson’s disease with with a longer duration of parkinsonism before mild cognitive impairment diagnosis; PD-IC = Parkinson’s disease with intact cognition; rsFC = resting-state functional connectivity; SI = Substantia innominata.
surprising that we found decreased rsFC between the frontal areas and bilateral SI in this study. We also found an association between decreased rsFC in the right frontal area with attention and verbal memory dysfunction.
Involvement of the posterior brain areas in cognitive dysfunction has also been well reported in other studies on PD16–18. A previous study showed posterior cortical atrophy in the dorsal parietal as well as the
occipitotemporal cortices of PDD patients19, and these areas overlapped a great deal with the areas showing
cholinergic hypometabolism in those patients20. Baggio et al. also reported posterior brain atrophy in PD-MCI
patients, but increased rsFC in the areas with the default mode network (DMN), which was correlated with visuospatial function21. The present study also showed increased rsFC in the bilateral parietal areas which was
linked with cognitive dysfunction in PD patients, in contrary to the decreased rsFC observed in the frontal areas. Accordingly, we have to consider possible associations between cholinergic dysfunction, posterior cor-tical atrophy, and increased rsFC in this area. However, it remains unclear what causes these opposite patterns of rsFC between the frontal and parietal areas. According to a previous study with 225 normal subjects22, SI
normally shows positive correlation with the frontal areas and negative correlation with the posterior brain areas. Our results also showed that decreased frontal connectivity was attributable to loss of positive correla-tion observed in the PD-IC group, and increased posterior brain connectivity to loss of negative correlacorrela-tion. Therefore, rsFC phenotypes caused by cholinergic deficits might seem to have opposite patterns depending on the inherent characteristics of the brain regions.
As we mentioned above, cognitive dysfunction-related changes in rsFC were prominent in the PD-MCI-SD group, but not in the PD-MCI-LD group when compared to the PD-IC group. These results suggest that the more disturbed intrinsic corticopetal cholinergic network might cause earlier-onset of MCI in the PD-MCI-SD group. In contrast, the PD-MCI-LD group with only minimal alteration in the cholinergic network was thought to preserve cognitive function for a relatively long disease duration, supporting our assumption that the PD-MCI-SD group has more burden in at least the corticopetal cholinergic system. This also corresponds to the ‘dual-syndrome hypothesis’ of cognitive impairment in PD suggested by Kehagia et al.23. Kehagia et al. proposed that while cognitive deficits
in early PD are mainly mediated by dysfunction in the fronto-striatal dopaminergic network, progressive cogni-tive decline leading to dementia in PD is associated with superimposition of additional basal forebrain cholinergic system degeneration. However, other than dopaminergic and cholinergic denervation, depletion of other various neurotransmitters and genotypes is also known to contribute to cognitive dysfunction in PD24, 25. Therefore, future
studies are needed to understand how these factors affect the rate of cognitive decline in PD patients.
We also found decreased rsFC between the right anterior frontal area and bilateral SI seed and this was asso-ciated with a shorter duration of parkinsonism before MCI diagnosis, a possible sign of rapid cognitive decline, in PD patients. Previous longitudinal studies have shown that impairments of posterior cortical function are predictors for future dementia in PD16–18. However, there is still debate on the prognostic value of particular
cor-tical changes in PDD development, namely more rapid cognitive decline. According to another study, atrophy in the frontal area, caudate nucleus, and SI could serve as predictors of dementia in PD26. Moreover, our colleagues
recently reported a significant association between decreased fronto-striatal rsFC and a shorter duration of par-kinsonism before MCI diagnosis in PD patients. The authors also found microstructural changes in the frontal white matter in PD-MCI patients with shorter disease duration, suggesting that the frontal area plays a pivotal role in deciding the rate of cognitive decline27. Our results also show an association between decreased rsFC in the
frontal area and early cognitive decline in PD patients. However, future longitudinal studies with a larger study population with longer clinical follow-ups are required to confirm these findings.
Interestingly, the PD-MCI-SD group had decreased rsFC in the precuneus and bilateral angular gyri compared to the PD-MCI-LD group. These are key areas of the DMN, which has a pivotal role in cognitive function28. There
have been growing evidence suggesting an association between cholinergic neurotransmission and DMN, showing cholinergic neuromodulation affect the brain activity during rest and task as well29, 30. A recent study also suggested
that preserved cholinergic function in DMN as well as frontoparietal network might be a prerequisite for cogni-tive improvement after cholinergic treatment in PD patients31. In our study, compared to the PD-IC group, the
direction of rsFC change in the PD-MCI-LD and the PD-MCI-SD groups was diverged, causing significant differ-ences between the two groups. Possible different levels of burden in the cholinergic system between the PD-MCI groups might have caused this diverging change. Similar findings can be observed in Alzheimer’s disease: compen-satory hyperconnectivity within DMN in MCI with less pathologic burden, followed by hypoconnectivity found in Alzheimer’s disease with more burden32, 33. It is unclear, however, whether we can apply this concept to rsFC between
SI and precuneus and angular gyrus which normally have anti-correlation. Further study is required to unravel the association between the SI and DMN according to the degree of pathologic burden.
The present study has some limitations that need to be addressed. First, this is a cross-sectional study, so our results cannot be directly used to predict the rate of cognitive decline. Further prospective studies with regular follow-ups and comprehensive neuropsychological testing should be performed to validate our assumptions. Second, the onset timing of cognitive decline relies on subjective information; therefore, the temporal relation-ship between the onset of parkinsonism and cognitive decline is unavoidably subjective. More reliable and objec-tive assessment methods need to be developed through future research. Third, the major nuclear cell group found in the SI is the NBM, but the SI is a neurochemically diverse area with both cholinergic and non-cholinergic projection neurons34, 35. Our results may be inevitably influenced by this heterogeneity of SI. Therefore, caution is
needed when interpreting our results and future studies should be performed with more focus on the cholinergic neurons of SI. Fourth, because we performed seed-based rsFC analysis with only SI seed, we might have missed how other brain areas affect the rate of cognitive decline in PD patients. Therefore, a future study based on pat-terns of whole brain functional connectivity should be carried out to support our results and to determine which brain networks correlate with rapid cognitive decline in PD patients.
rel-decreased rsFC in the frontal areas might be associated with early-onset of MCI, suggesting that cholinergic deficits in the frontal areas might play an important role in the acceleration of cognitive decline and conversion to PD dementia.
Methods
Subjects.
Patients were selected from a prospectively collected single-institution movement disorders and dementia outpatient clinic database between August 2011 and December 2015. Consecutive patients with drug-naïve de novo PD who underwent both MRI and neuropsychological tests within a 2-month interval were recruited. PD was diagnosed according to the clinical diagnostic criteria of the United Kingdom Parkinson’s Disease Society Brain Bank36.Motor symptoms were assessed using the Unified Parkinson’s Disease Rating Scale Part III (UPDRS-III). Depressive symptoms were assessed using the self-rating Beck Depression Inventory37. We excluded patients with
focal brain lesions, diffuse white matter (WM) hyperintensities outside the normal range, or multiple lacunar infarcts in the basal ganglia on MRI or other medical comorbidities that might account for cognitive dysfunc-tion. All subjects completed MRI and [18F]-FP-CIT positron emission tomography (PET) imaging protocols. To ensure clinical diagnostic accuracy, only patients who exhibited decreased dopamine transporter uptake in the posterior putamen on a [18F]-FP-CIT-PET scan were included in this study.
Information about memory problems was gathered by interviews with the patients or caregivers. The cognitive status of PD patients was diagnosed by a group of two neurologists and one neuropsychologist in consensus, and diagnoses were based on a neuropsychological battery and physician-administered neurological examination.
The Seoul neuropsychological screening battery (SNSB), a detailed neuropsychological battery test standard-ized for the Korean population was used to evaluate cognitive performance38, 39. The SNSB is comprised of the
forward and backward digit span test, Korean version of the Boston Naming Test (K-BNT)40, Rey complex figure
test (RCFT, copying, immediate recall, 20-min delayed recall, and recognition), pentagon drawing test, Seoul Verbal Learning Test (SVLT, immediate recall, 20-min delayed recall, and recognition), phonemic and semantic Controlled Oral Word Association Test (COWAT), go-no-go test and contrasting program, and Stroop test (word and color reading of 112 items during a 2-min period). There were age-, sex-, and education-specific norms avail-able for each test based on 447 healthy subjects. Patients were classified as abnormal when the scores of these tests were below the 16th percentiles of the norms for the age-, sex-, and education-matched normal subjects. Except for the language domain, two neuropsychological tests were designated to represent each of the following four cognitive domains: 1. Attention (forward and backward digit span and Stroop color-word test); 2. Executive func-tion (phonemic and semantic COWAT and clock drawing test); 3. Memory (SVLT and RCFT); 4. Visuospatial function (RCFT copy and pentagon drawing test); and 5. Language domain (only K-BNT).
According to the diagnostic criteria recommended by the Movement Disorder Society Task Force41, PD-MCI
was diagnosed when at least two tests for each of the four domains other than the language domain were abnor-mal (level 2) or when at least two tests for each of the five domains were abnorabnor-mal (level 1). Depending on the temporal relationship between the onset of parkinsonian motor symptoms and that of cognitive impairment, patients were divided into two groups of PD-MCI: PD-MCI < 1 year of parkinsonism before MCI diagnosis (PD-MCI-SD) and PD-MCI ≥ 1 year of parkinsonism before MCI diagnosis (PD-MCI-LD). Twenty-nine age- and sex-matched, drug-naïve de novo PD-IC patients were included as the control group.
Standard protocol approvals, registrations, and patient consents.
The study protocol was approved by the Yonsei University Severance Hospital ethical standards committee on human experimentation and was exempt from providing informed consent by the IRB due to its retrospective design. All experiments were performed in accordance with relevant guidelines and regulations.Image Acquisition.
All participants underwent MR imaging with a 3-Tesla scanner (Intera Achieva, Philips Medical System, Best, the Netherlands) and a 32-channel head coil. Head motion was minimized with restraining foam pads offered by the manufacturer.Structural image acquisition.
We used the 3-dimensional T1-turbo field echo sequence con-figured with the following acquisition parameters: axial acquisition with field of view = 220 mm; voxel size = 0.98 × 0.98 × 1.2 mm3; TE = 4.6 ms; TR = 9.6 ms; flip angle = 8°; slice gap = 0 mm; and total acquisition time = 5 min 29.3 s.Resting-state fMRI acquisition.
The functional MR images were acquired by using a T2*-weighted single shot echo planar imaging sequence. For each subject, 165 axial volume scans were obtained with the following acquisition parameters: voxel size = 2.75 × 2.75 × 4.8 mm3; slice number = 31 (interleaved); matrix = 80 × 80; slice thickness = 4.8 mm; repetition time = 2000 ms; echo time = 30 ms; and field of view = 209 × 220 mm2. During functional MR imaging, subjects were instructed to remain awake with their eyes closed and to not move or focus on anything specific.Volumetric analysis of SI.
Individual structural T1 images were processed using the Freesurfer software package version 5.3.0 (Massachusetts General Hospital, Harvard Medical School; http://surfer.net). Each subject’s structural images and the International Consortium for Brain Mapping (ICBM) 152 template were registered to a common spherical coordinate system42, 43. The SI region was manually drawn based on the ICBM 152 template bya radiologist (N.Y.S.; Supplementary Figure 3) and this was aligned to each subject’s structural volume with a non-linear registration algorithm (Freesurfer’s mri cvs register and applyMorph). The delineation of the SI on MRI was based on a method reported previously by George and colleagues44. The volume was derived from three consecutive
gapless 1 mm-thick slices on T1-weighted coronal images reformatted to be perpendicular to the anterior commis-sure (AC)-posterior commiscommis-sure (PC) line. The three consecutive sections analyzed were at the level of the crossing of the AC, the level where the AC might be uncrossed, and the level of the emergence of the AC from the temporal lobe. The boundaries of the SI were as follows; the dorsal border was the ventral aspect of the globus pallidus, the ventral border was the base of the brain containing the anterior perforated space, the medial border was operation-ally defined by a vertical line extending from the ventrolateral border of the bed nucleus of the stria terminalis to the base of the brain, and the lateral border extended to the medial aspect of the putamen. The anatomical landmarks used to define the borders of the SI were applied to all three consecutive sections. For each subject, the structural volume was calculated and differences in SI volume between the three groups were analyzed. We also performed group comparisons between the collapsed PD-MCI group and the PD-IC group. Age, sex, years of education, and age at onset of parkinsonism were also included as covariates in ANCOVA.
Analysis of rsFC.
The rsfMRI data were analyzed using SPM8 (Wellcome Trust Centre for Neuroimaging, London, UK, www.fil.ion.ucl.ac.uk/spm/) implemented in MATLAB (The MathWorks, Inc. Natick, MA, USA). The preprocessing of rsfMRI Data was carried out using the Data Processing Assistant for Resting-State fMRI toolbox (http://www.restfmri.net) preprocessing pipeline. Preprocessing included slice timing, realignment (to the middle volume), coregistration, normalization (to the MNI space using T1 images), and smoothing (with a 4-mm full width at half maximum Gaussian kernel). Then, the preprocessed images were detrended and band-pass filtered (0.01~0.08 Hz). Nuisance covariates including head motion parameter, global mean signal, WM signal, and cerebrospinal fluid signal were regressed out. To perform a seed-based rsFC analysis, we first set the above-mentioned bilateral SI mask as a seed region (Supplementary Figure 3). Then, the correlation coefficient between the seed and remaining voxels in the whole brain was calculated. Individual r maps were normalized by Fisher’s r-to-z transformation, and the converted z maps were entered into group analysis. In the 2nd level anal-ysis, a pairwise two sample t-test was conducted to investigate differences in FC patterns between the collapsed PD-MCI group and the PD-IC group to see which brain regions were relevant to cognitive dysfunction in PD patients using the SPM8 toolbox. Afterwards, pairwise two sample t-tests were also performed to compare the PD-MCI-SD, PD-MCI-LD, and PD-IC groups with each other. Sex, years of education, age, age at onset of parkin-sonism, and UPDRS III score were regressed out in the statistical test. Unless stated otherwise, the threshold for statistical analysis was set to P < 0.017 (Bonferroni corrected for three comparisons), based on the Monte Carlo Simulations with custom software implemented in MATLAB45.Statistical Analysis.
The Kolmogorov–Smirnov test was used to determine normal distributions. Accordingly, quantitative data with normal distributions were presented as means ± standard deviations and were compared using ANOVA. Quantitative data without normal distributions were presented as medians with ranges and the Kruskal-Wallis test was used for analysis. The Chi-squared test or Fisher’s exact test was used to ana-lyze qualitative data when appropriate. A post-hoc analysis was also performed using the Bonferroni-corrected Students’ t-test, Mann-Whitney U test, Chi-squared test, or Fisher’s exact test when appropriate with correction for multiple comparisons.To test whether brain regions showing significant difference in the collapsed PD-MCI group compared to the PD-IC group were correlated with cognitive function, we performed a correlation analysis between those regions and neuropsychological test results. We first created ROI masks for the right frontal regions (40 voxels) showing decreased rsFC and the bilateral parietal regions (160 voxels) showing increased rsFC in the collapsed PD-MCI group, respectively. To assess which brain regions were associated with disease duration before MCI diagnosis, we created conjunction ROI masks by overlapping areas showing significantly different rsFC in PD-MCI-SD compared not only with PD-MCI-LD but also with PD-IC as there might be characteristic neural changes of PD-MCI-SD compared to PD-IC and PD-MCI-LD. Three frontal masks (right anterior frontal mask, 16 voxels; right superior frontal mask, 7 voxels; and left superior frontal mask, 15 voxels) were created for areas showing decreased rsFC in the PD-MCI-SD group compared with both the PD-MCI-LD and PD-IC groups, while the right parietal mask (3 voxels) was created for areas showing increased rsFC, which was excluded in the correlation analysis because the size of the area was too small. Then, mean z values extracted from the voxels within each ROI mask were correlated with neuropsychological test results or disease durations in all participants using Pearson’s or Spearman’s correlation coefficient, when appropriate.
Statistical analyses were performed using commercially available software (SPSS, version 21.0), and a two-tailed P value < 0.05 was considered significant.
References
1. Shulman, J. M., De Jager, P. L. & Feany, M. B. Parkinson’s disease: genetics and pathogenesis. Annual review of pathology 6, 193–222, doi:10.1146/annurev-pathol-011110-130242 (2011).
2. Emre, M. et al. Clinical diagnostic criteria for dementia associated with Parkinson’s disease. Mov Disord 22, 1689–1707, quiz 1837, doi:10.1002/mds.21507 (2007).
3. Litvan, I. et al. MDS Task Force on mild cognitive impairment in Parkinson’s disease: critical review of PD-MCI. Mov Disord 26, 1814–1824, doi:10.1002/mds.23823 (2011).
4. Perry, E. K. et al. Cholinergic correlates of cognitive impairment in Parkinson’s disease: comparisons with Alzheimer’s disease. J
Neurol Neurosurg Psychiatry 48, 413–421, doi:10.1136/jnnp.48.5.413 (1985).
5. Choi, S. H. et al. Volumetric analysis of the substantia innominata in patients with Parkinson’s disease according to cognitive status.
Neurobiology of aging 33, 1265–1272, doi:10.1016/j.neurobiolaging.2010.11.015 (2012).
6. Shimada, H. et al. Mapping of brain acetylcholinesterase alterations in Lewy body disease by PET. Neurology 73, 273–278, doi:10.1212/WNL.0b013e3181ab2b58 (2009).
8. Compta, Y. et al. Lewy- and Alzheimer-type pathologies in Parkinson’s disease dementia: which is more important? Brain 134, 1493–1505, doi:10.1093/brain/awr031 (2011).
9. Ballard, C. et al. Differences in neuropathologic characteristics across the Lewy body dementia spectrum. Neurology 67, 1931–1934, doi:10.1212/01.wnl.0000249130.63615.cc (2006).
10. Gonzalez-Redondo, R. et al. Grey matter hypometabolism and atrophy in Parkinson’s disease with cognitive impairment: a two-step process. Brain 137, 2356–2367, doi:10.1093/brain/awu159 (2014).
11. Huang, C. et al. Metabolic brain networks associated with cognitive function in Parkinson’s disease. Neuroimage 34, 714–723, doi:10.1016/j.neuroimage.2006.09.003 (2007).
12. Dubois, B. & Pillon, B. Cognitive deficits in Parkinson’s disease. J Neurol 244, 2–8, doi:10.1007/PL00007725 (1997).
13. Bohnen, N. I. et al. Cognitive correlates of cortical cholinergic denervation in Parkinson’s disease and parkinsonian dementia. J
Neurol 253, 242–247, doi:10.1007/s00415-005-0971-0 (2006).
14. Gratwicke, J., Jahanshahi, M. & Foltynie, T. Parkinson’s disease dementia: a neural networks perspective. Brain 138, 1454–1476, doi:10.1093/brain/awv104 (2015).
15. Ruberg, M., Rieger, F., Villageois, A., Bonnet, A. M. & Agid, Y. Acetylcholinesterase and butyrylcholinesterase in frontal cortex and cerebrospinal fluid of demented and non-demented patients with Parkinson’s disease. Brain Res 362, 83–91, doi: 10.1016/0006-8993(86)91401-0 (1986).
16. Williams-Gray, C. H., Foltynie, T., Brayne, C. E., Robbins, T. W. & Barker, R. A. Evolution of cognitive dysfunction in an incident Parkinson’s disease cohort. Brain 130, 1787–1798, doi:10.1093/brain/awm111 (2007).
17. Williams-Gray, C. H. et al. The distinct cognitive syndromes of Parkinson’s disease: 5 year follow-up of the CamPaIGN cohort. Brain
132, 2958–2969, doi:10.1093/brain/awp245 (2009).
18. Bohnen, N. I. et al. Cerebral glucose metabolic features of Parkinson disease and incident dementia: longitudinal study. J Nucl Med
52, 848–855, doi:10.2967/jnumed.111.089946 (2011).
19. Pereira, J. B. et al. Neuroanatomical substrate of visuospatial and visuoperceptual impairment in Parkinson’s disease. Mov Disord 24, 1193–1199, doi:10.1002/mds.22560 (2009).
20. Hilker, R. et al. Dementia in Parkinson disease functional imaging of cholinergic and dopaminergic pathways. Neurology 65, 1716–1722, doi:10.1212/01.wnl.0000191154.78131.f6 (2005).
21. Baggio, H. C. et al. Cognitive impairment and resting-state network connectivity in Parkinson’s disease. Human brain mapping 36, 199–212, doi:10.1002/hbm.22622 (2015).
22. Li, C. S. et al. Resting state functional connectivity of the basal nucleus of Meynert in humans: in comparison to the ventral striatum and the effects of age. Neuroimage 97, 321–332, doi:10.1016/j.neuroimage.2014.04.019 (2014).
23. Kehagia, A. A., Barker, R. A. & Robbins, T. W. Cognitive impairment in Parkinson’s disease: the dual syndrome hypothesis.
Neuro-degenerative diseases 11, 79–92, doi:10.1159/000341998 (2013).
24. Aarsland, D. et al. Cognitive decline in Parkinson disease. Nature reviews. Neurology 13, 217–231, doi:10.1038/nrneurol.2017.27
(2017).
25. Fallon, S. J. et al. Differential optimal dopamine levels for set-shifting and working memory in Parkinson’s disease. Neuropsychologia
77, 42–51, doi:10.1016/j.neuropsychologia.2015.07.031 (2015).
26. Lee, J. E. et al. Exploratory analysis of neuropsychological and neuroanatomical correlates of progressive mild cognitive impairment in Parkinson’s disease. J Neurol Neurosurg Psychiatry 85, 7–16, doi:10.1136/jnnp-2013-305062 (2014).
27. Shin, N. Y. et al. Different Functional and Microstructural Changes Depending on Duration of Mild Cognitive Impairment in Parkinson Disease. AJNR. American journal of neuroradiology 37, 897–903, doi:10.3174/ajnr.A4626 (2016).
28. Seeley, W. W., Crawford, R. K., Zhou, J., Miller, B. L. & Greicius, M. D. Neurodegenerative diseases target large-scale human brain networks. Neuron 62, 42–52, doi:10.1016/j.neuron.2009.03.024 (2009).
29. Shah, D. et al. Cholinergic and serotonergic modulations differentially affect large-scale functional networks in the mouse brain.
Brain structure & function 221, 3067–3079, doi:10.1007/s00429-015-1087-7 (2016).
30. Tanabe, J. et al. Nicotine effects on default mode network during resting state. Psychopharmacology 216, 287–295, doi:10.1007/ s00213-011-2221-8 (2011).
31. Colloby, S. J. et al. Cholinergic and perfusion brain networks in Parkinson disease dementia. Neurology 87, 178–185, doi:10.1212/ WNL.0000000000002839 (2016).
32. Brier, M. R. et al. Loss of intranetwork and internetwork resting state functional connections with Alzheimer’s disease progression.
The Journal of neuroscience: the official journal of the Society for Neuroscience 32, 8890–8899, doi:10.1523/JNEUROSCI.5698-11.2012
(2012).
33. Gardini, S. et al. Increased functional connectivity in the default mode network in mild cognitive impairment: a maladaptive compensatory mechanism associated with poor semantic memory performance. Journal of Alzheimer’s disease: JAD 45, 457–470, doi:10.3233/JAD-142547 (2015).
34. Mesulam, M. M. Cholinergic circuitry of the human nucleus basalis and its fate in Alzheimer’s disease. The Journal of comparative
neurology 521, 4124–4144, doi:10.1002/cne.23415 (2013).
35. Rye, D. B., Wainer, B. H., Mesulam, M. M., Mufson, E. J. & Saper, C. B. Cortical projections arising from the basal forebrain: a study of cholinergic and noncholinergic components employing combined retrograde tracing and immunohistochemical localization of choline acetyltransferase. Neuroscience 13, 627–643, doi:10.1016/0306-4522(84)90083-6 (1984).
36. Hughes, A. J., Daniel, S. E., Kilford, L. & Lees, A. J. Accuracy of clinical diagnosis of idiopathic Parkinson’s disease: a clinico-pathological study of 100 cases. J Neurol Neurosurg Psychiatry 55, 181–184, doi:10.1136/jnnp.55.3.181 (1992).
37. Beck, A. T., Ward, C. H., Mendelson, M., Mock, J. & Erbaugh, J. An inventory for measuring depression. Arch Gen Psychiatry 4, 561–571, doi:10.1001/archpsyc.1961.01710120031004 (1961).
38. Kang, Y. & Na, D. L. Seoul Neuropsychological Screening Battery (Human Brain Research & Consulting Co., 2003).
39. Song, S. K. et al. The pattern of cortical atrophy in patients with Parkinson’s disease according to cognitive status. Mov Disord 26, 289–296, doi:10.1002/mds.23477 (2011).
40. Kim, H. & Na, D. L. Normative data on the Korean version of the Boston Naming Test. J Clin Exp Neuropsychol 21, 127–133, doi:10.1076/jcen.21.1.127.942 (1999).
41. Litvan, I. et al. Diagnostic criteria for mild cognitive impairment in Parkinson’s disease: Movement Disorder Society Task Force guidelines. Mov Disord 27, 349–356, doi:10.1002/mds.24893 (2012).
42. Fischl, B., Sereno, M. I. & Dale, A. M. Cortical surface-based analysis. II: Inflation, flattening, and a surface-based coordinate system.
Neuroimage 9, 195–207, doi:10.1006/nimg.1998.0396 (1999).
43. Fischl, B., Sereno, M. I., Tootell, R. B. & Dale, A. M. High-resolution intersubject averaging and a coordinate system for the cortical surface. Human brain mapping 8, 272–284, doi:10.1002/(SICI)1097-0193(1999)8:4<272::AID-HBM10>3.0.CO;2-4.
44. George, S. et al. MRI-based volumetric measurement of the substantia innominata in amnestic MCI and mild AD. Neurobiology of
aging 32, 1756–1764, doi:10.1016/j.neurobiolaging.2009.11.006 (2011).
45. Slotnick, S. D., Moo, L. R., Segal, J. B. & Hart, J. Jr. Distinct prefrontal cortex activity associated with item memory and source memory for visual shapes. Brain research. Cognitive brain research 17, 75–82, doi:10.1016/S0926-6410(03)00082-X (2003).
Author Contributions
I.K. participated in the analysis of data and its interpretation and drafting the manuscript. N.S. participated in study design, data acquisition, analysis of data and its interpretation, and critical revision of the manuscript for important intellectual content. Y.B. participated in the analysis of data and interpretation of the results. P.L. participated in study concept and design, and critical revision of the manuscript for important intellectual content. S.L.(Seung-Koo Lee) participated in study concept and design, and critical revision of the manuscript for important intellectual content. S.L.(Soo Mee Lim) participated in study concept and design, and critical revision of the manuscript for important intellectual content. All authors reviewed the manuscript.
Additional Information
Supplementary information accompanies this paper at doi:10.1038/s41598-017-02420-w
Competing Interests: The authors declare that they have no competing interests.
Publisher's note: Springer Nature remains neutral with regard to jurisdictional claims in published maps and
institutional affiliations.
Open Access This article is licensed under a Creative Commons Attribution 4.0 International
License, which permits use, sharing, adaptation, distribution and reproduction in any medium or format, as long as you give appropriate credit to the original author(s) and the source, provide a link to the Cre-ative Commons license, and indicate if changes were made. The images or other third party material in this article are included in the article’s Creative Commons license, unless indicated otherwise in a credit line to the material. If material is not included in the article’s Creative Commons license and your intended use is not per-mitted by statutory regulation or exceeds the perper-mitted use, you will need to obtain permission directly from the copyright holder. To view a copy of this license, visit http://creativecommons.org/licenses/by/4.0/.