R E S E A R C H
Open Access
A systematic study of core size and coating
thickness on manganese-doped nanocrystals for
high T2 relaxivity as magnetic resonance contrast
agent
Joseph Park
1, Byunghoon Kang
1, Bongjune Kim
1, Jin-Suck Suh
2,3, Yong-Min Huh
2,3*and Seungjoo Haam
1*Abstract
We describe a systematic study of coating thickness and their effect on different core sizes for the optimized preparation of highly sensitive manganese-doped magnetic nanocrystals (MnMNCs) to be served as magnetic resonance (MR) contrast agent. From these efforts, MnMNCs with 12 nm core and DA-PEG2k coating demonstrated that T2 relaxivity (r2) was increased by 7.29-fold (r2 value: 452 mM−1s−1) compare to conventional iron oxide (CLIO) and remarkable colloidal stability in various physiological conditions. Furtherin vitro cellular MR imaging results showed that MnMNC-PEGs were biocompatible and well suited for medical applications. This study will provide a useful synthetic strategy for the development of highly effective MR contrast agents.
Keywords: Relaxivity; Coating thickness; Manganese-doped nanocrystal; Sensitivity; MRI 1 Background
Magnetic nanocrystals (MNCs) are emerging research areas for their potential applications in biomedical sciences such as magnetic resonance imaging, cancer treatment and micro-NMR sensors [1-3]. Researchers are aiming to make high sensitive magnetic materials by means of increasing size, engineering magnetism, and sur-face coating variations [4-6]. Manganese-doped magnetic nanocrystals (MnMNCs) are one of the most important material because of relatively simple preparation method and increased mass magnetization value compare to con-ventional iron oxides [7]. However MnMNCs are coated with hydrophobic ligands and eventually they need to be encapsulated in hydrophilic ligands to disperse them in water phase. Our group reported a method to make highly water dispersible MnMNCs, they are still in suboptimal potency of sensitivity because magnetic field surrounding a magnetic nanocrystals would be fallen as the distance go
far from the core material. And the coating molecules are important factor that would affect the nuclear relaxation of water protons by forming hydrogen bond. Therefore, it is necessary work to study the affect of coating materials even if their iron oxide core sizes are similar [8-11].
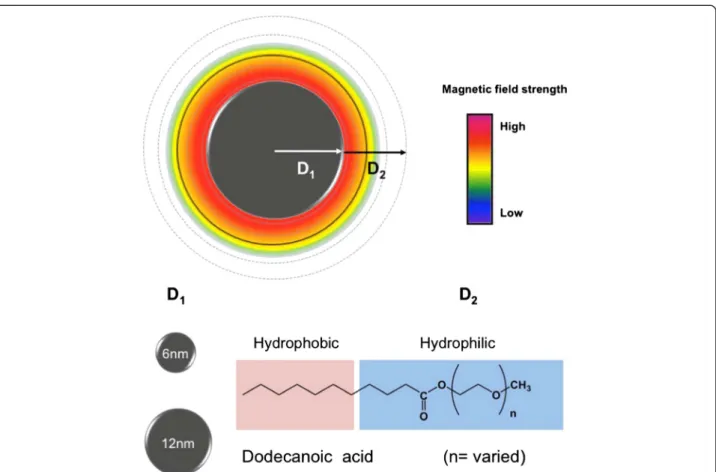
Herein, we report on an optimized design for manganese-doped magnetic nanocrystals (MnMNCs), capable of achieving maximal r2 and colloidal stability (Figure 1). These synthesized MnMNCs with different coating thickness can exhibit quite different r2 even if their MnMNC core sizes remain similar. These constructions could approach the maximum r2 coefficient for a given material. As a specific example in the present study, we synthesized MnMNCs for T2-weighted magnetic resonance (MR) imaging con-trast agent and encapsulated into a various PEG shell. The resultant MnMNCs with 12 nm core size encapsulated with dodecanoic acid-PEG2K Da (MnMNC12-PEG2K) exhibited most high r2 relaxivity (452 mM−1s−1[metal]), 7.29-fold higher compared to conventional iron oxide (CLIO), and showed excellent colloidal stability. The prepared MnMNC12-PEG2K was subsequently applied to an intra-cellular imaging system to demonstrate their use in identifying target cellsin vitro.
* Correspondence:[email protected];[email protected]
2
Department of Radiology & Department of Biochemistry and Molecular Biology, Yonsei University, Seoul 120-752, South Korea
1
Department of Chemical and Biomolecular Engineering, Yonsei University, Seoul 120-749, South Korea
Full list of author information is available at the end of the article
© 2015 Park et al.; licensee Springer. This is an Open Access article distributed under the terms of the Creative Commons Attribution License (http://creativecommons.org/licenses/by/4.0), which permits unrestricted use, distribution, and reproduction in any medium, provided the original work is properly crited.
2 Methods
2.1 Materials
Iron(III) acetylacetonate, manganese (II) acetylacetonate, 1,2-hexadecanediol, dodecanoic acid, dodecylamine, ben-zyl ether, anhydrous dichloromethane, monomethylpo-lyethylene glycol (mPEG; Mw 1 k, 2 k, 5 k, 10 k, 20 k Da) were purchased from Sigma-Aldrich. All other chemicals and reagents were of analytical grade.
2.2 Synthesis of 6 nm MnFe2O4Magnetic Nanocrystals MnFe2O4nanocrystals were synthesized by seed-mediated growth method [5]. Typically, 2 mmol iron (III) acetylace-tonate, 1 mmol manganese (II) acetylaceacetylace-tonate, 10 mmol 1,2-hexadecanediol, 6 mmol dodecanoic acid, 6 m moldo-decylamine, and 20 mL of benzyl ether were mixed under a nitrogen atmosphere. The mixture was preheated to 200°C for 120 min and then refluxed at 300°C for 60 min. After being cooled to room temperature, the products were purified with an excess of pure ethanol [12].
2.3 Synthesis of 12 nm MnFe2O4Magnetic Nanocrystals 2 mmol iron (III) acetylacetonate, 1 mmol manganese (II) acetylacetonate, 10 mmol 1,2-hexadecanediol, 2mmoldode-canoic acid, 2 mmol dodecylamine, and 20 mL of benzyl ether were mixed and magnetically stirred under a flow of N2. Eighty four milligram sample of pre-synthesized 6 nm MnFe2O4 nanoparticles dispersed in hexane (1 mL) was added into the mixture. The mixture was first heated to 110°C for 30 min to remove hexane, then further to 200°C for 1 h. Under a blanket of nitrogen, the mixture was fur-ther heated to reflux (300°C) for 30 min. The black-colored mixture was cooled to room temperature by removing the heat source. After being cooled to room temperature, the products were purified with an excess of pure ethanol [12].
2.4 Synthesis of DA-PEG Block Copolymers
DA-PEG block copolymer was synthesized as described previously [6,7].As reported, a solution of 30 mmol dodec-anoic acid (DA) and 10 mmol mPEG dissolved in 40 mL of anhydrous dichloromethane was activated by adding 30 mmol of N,N’-dicyclohexylcarbodiimide (DCC) and 4-dimethylaminopyridine (DMAP). The reaction was carried out for 48 h at room temperature under a nitrogen atmos-phere. The resulting product was filtered using a cellulose acetate syringe filter (pore size≈ 200 nm) and dialyzed for two weeks against 10 mM sodium phosphate buffer (pH 7.4) using dialysis tube.
2.5 Surface coating of MnFe2O4nanocrystals with DA-PEG 30 mg of MnFe2O4nanocrystals was dissolved in 4 mL of chloroform. This organic phase was added to 20 mL of sodium phosphate buffer containing 200 mg of DA-PEG with various sizes of mPEG (1 K, 2 K, 5 K, 10 K and 20 K molecular weight), respectively. After mutual
saturation of the organic and continuous phases, the mixture was emulsified for 15 min with an ultrasonicator (ULH700S, Ulssohitech, Korea) at 300 W. After solvent evaporation in 4 h, the product was purified 3 times with centriprep at 3,000 rpm for 30 min to remove excess DA-PEG molecules [9].
2.6 Colloidal Stability
The colloidal stability of the prepared MnMNC-PEGs was determined from their resistance to pH-induced nanoparticle aggregation. A 100μL nanoparticle suspension (20 mg/mL) was added to 2 mL (pH 2, 4, 74, 9) at room temperature and then size of the suspension was measured using laser scattering (ELS-Z, Otsuka electronics).
2.7 Cell viability assay by MTT
The biocompatibility of the prepared MNC6-PEG1K and MNC12-PEG2K for macrophage cells was quantified by a colorimetric assay based on the mitochondrial oxidation of 3-(4,5-dimethylthiazolyl-2)-2,5-diphenyltetrazolium brom-ide (MTT). RAW 264.7 cells were harvested at a density of 104 cells/200 μL in a 96-well plate and incubated at 37°C under 5% CO2atmosphere. The cells were incubated for 24 h with prepared MnMNCs, rinsed with 100μL PBS (pH 7.4, 1 mM), and then treated with freshly prepared MTT solution (10μL) and incubated for an additional 4 h before adding 100 μL dimethylsulfoxide. After 24 h, the plates were assayed using an enzyme-linked immunosorb-ent assay (Spectra Max 340, Molecular Devices, USA) and the results were measured at an absorbance wavelength of 575 nm and a reference wavelength of 650 nm [9].
2.8 MR imaging
We performed MR imaging experiments with a 1.5-T clin-ical MRI instrument with a micro-47 surface coil (Intera; Philips Medical Systems, Best, the Netherlands). R2 relax-ivities of MnMNC6-PEG(1 k ~20 k) and MnMNC12-PEG (1 k ~20 k) were measured using the Carr-Purcell-Meiboom-Gill sequence at room temperature: TR = 10 s, 32 echoes with 12 ms even echo space, number of acquisi-tion = 1, point resoluacquisi-tion of 156 × 156μm, section thick-ness of 0.6 mm. R2 was defined as 1/T2 with units of s−1. For T2-weighted MR imaging of cellsin vitro at 1.5 T, the following parameters were used: point resolution: 156 × 156μm, section thickness of 0.6 mm, TE = 60 ms, TR = 4000 ms, number of acquisitions = 1. For T2 map-ping of cells in vitro, the following parameters were used: point resolution of 156 × 156 μm, section thickness of 0.6 mm, TE = 20, 40, 60, 80, 100, 120, 140, 160 ms, TR = 4000 ms, number of acquisitions =2.
2.9 Prussian blue stain
RAW 264.7 cells (5.0 × 10⁵cells/well) were seeded onto six-well plates and incubated for 24 h at 37°C. Prepared
MnMNC6-PEG1K and MnMNC12-PEG2K (100 μg of MnFe/mL) were added to Dulbecco’s modified eagle medium (DMEM, Gibco®, Invitrogen, USA). After incuba-tion for 24 h at 37°C, the cells with MnMNC6-PEG1K and MnMNC12-PEG2K were detached, centrifuged and washed three times with PBS (pH 7.4, 1 mM). The de-tached cells were fixed and immersed in iron staining so-lution (20% hydrochloric acid: potassium ferrocyanate =1: 1) for 30 min at room temperature after being fixed in 95% alcohol for 5 min. Then, the samples were rinsed three times in deionized water to remove the residual staining solution. Subsequently, the samples were stained with the nuclear staining solution (Nuclear Fast Red) for 15 min, followed by three washes with deionized water, and were finally fixed in increasing concentrations of alcohol and xylene [13].
2.10 Characterization
The morphologies and the sizes of the prepared MnMNCs were analyzed using high resolution transmission electron microscopy (HR-TEM, JEM-2100 LAB6, JEOL Ltd., Japan) and laser scattering (ELS-Z, Otsuka electronics, Japan). X-ray diffraction measurement was performed by a Rigaku
D/max-RB (Tokyo, Japan) powder diffractometer and image-plate photography using graphite-monochromatized Cu Kα radiation (λ =1.542 Å) to determine the lattice of the MnFe2O4. Data were collected from 20° to 80° with a step size of 0.05° and step time of 5 s. The amounts of metal ions were quantified using inductively coupled plasma atomic emission spectrometry (ICP-AES, Thermo electron corporation, USA).
3 Results and discussion
Manganese-doped magnetic nanocrystal cores (MnFe2O4; MnMNCs) exhibiting high saturation of magnetization were selected as a core material and synthesized first as reported [12]. Briefly, the particles were prepared by ther-mally decomposing a mixture of Fe(acac)3and Mn(acac)2 in 1,2-hexadecanediol. The as-synthesized particles were then mixed and reacted with additional precursors to allow for particle growth. Using this procedure, we ob-tained highly monodisperse 6 nm MnMNCs (MnMNC6, size variation <5%) and 12 nm MnMNCs (MnMNC12, size variation <8.9%), respectively (Figure 2). The XRD patterns of the samples were very similar and showed characteristic reflection peaks due to the presence of a
Figure 1 Schematic illustration of optimal coating thickness on different sizes of MnFe2O4(6 nm and 12 nm). The color bar represents
the magnitude of the magnetic field strength of the MnMNC cores. Solid and dashed lines represent the boundaries of PEG coating layers, respectively. Starting from the center, the lines indicate PEG1k, PEG2k, PEG5k, PEG10k, and PEG20k.
nanocrystalline inverse spinel structure (Figure 3a). The peak intensities increased from MnMNC6 to MnMNC12, indicating a progressive increase in the average particle size, also in agreement with TEM observation. The aver-age particle sizes as determined by the Scherrer equation from line broadening of the (311) reflection (2θ =35.5) were of 5.5 and 11.6 nm for the sample of MnMNC6 and
MnMNC12, respectively. The magnetic hysteresis loops of the MnMNC6 and MnMNC12 were observed at 300 K (Figure 3b) and both exhibited superparamag-netic behavior without remnant magsuperparamag-netic hysteresis at zero field. In addition, their saturation of magnetization values were 87.7 and 48.3 emu/g, respectively, on the basis of dried weight at 1.0 T. Due to the presence of
Figure 3 Characterization of MnMNCs. (a) X-ray powder diffraction patterns and (b) mass magnetization (M) as a function of applied external field (H) measured at 300 K for MnMNC6 (blue) and MnMNC12 (red).
Figure 2 TEM images of MnFe2O4magnetic nanocrystals (MnMNCs) at the same magnification. The average diameters of the MnMNC,
organic components (DA-PEGs), the saturation of mag-netization of MnMNC-PEGs was relatively lower than that of previously reported MnFe2O4 nanocrystals as expected.
The as-synthesized MnMNC cores were enveloped by oleic acid/oleylamine and dispersed in chloroform. For water dispersible MnMNCs, amphiphilic block copolymer was synthesized using hydrophobic dodecanoic acid (DA) and various sizes of hydrophilic monomethylpolyethylene-glycol (mPEG, 1 K, 2 K, 5 K, 10 K and 20 K) [9]. Because of the hydrophobic interaction of MnMNCs with the DA component of amphiphilic block copolymer, the PEG-coated MnMNCs were successfully dispersed in aqueous phase. As we expected, the use of PEGs with higher mo-lecular masses resulted in larger hydrodynamic diameters. More specifically, we calculated the series of PEG layer thicknesses and compared with our experimental data. First, we hypothesize the thickness of the hydrophobic layers, formed by oleic acid/oleylamine with DA inter-action, are supposed to be the same as that of the cell membrane (3 nm), the statistical length of a PEG mono-mer (=0.39 nm) and the density of DA-PEG on a micelle (0.59 PEG/nm2) [14,15]. MnMNC6-PEG systems are quite well matched with calculated model systems approving the thickness of PEG variation ~ <2 nm. MnMNC12-PEG systems are slightly larger than ~ >6 nm as PEG molecular
weight increase. The difference of the hydrodynamic diameters might be caused by the presence of a tiny amount of small particle clusters (e.g., dimers or trimers). This may be attributed to the strong interactions between MnMNC12 hydrophobic surfaces. The calculated and measured MnMNC-PEG layer thicknesses are listed in Table 1.
To determine the optimized thickness of various PEG coated MnMNCs listed in Table 1 for MR contrast agents, we have experimentally measured their relaxivity coeffi-cient values of r2, defined as relaxation rates at unit concentration (1 mM metal ions, R2 = T2−1) which were obtained from the relaxation time versus [Fe + Mn] con-centration plots (Figure 4). The data clearly showed a dependency of proton relaxivity on their particle sizes (magnetic domain size). MnMNC12 exhibited consistently higher relaxation rate than the MnMNC6 for all 5-series PEG coatings. For instance, MnMNC12 with PEG2k coat-ing showed 2.16-fold higher r2 value than that of the MnMNC6 coated with identical PEG size. As previously mentioned, this size dependency is due to the effect of surface spin anisotropy which is more pronounced for smaller magnetic domain sizes due to larger surface area to volume ratio. An interesting feature is that at the same particle core size, the measured proton relax-ivity depends on the nature of PEG coating thickness,
Table 1 Calculated [14] and measured thickness of different core and PEG sizes
PEG 1 K (N = 22) PEG 2 K (N = 45) PEG 5 K (N = 113) PEG 10 K (N = 226) PEG 20 K (N = 454) MnMNC6 Total 10.8 ± 1.7 12.8 ± 1.4 18.8 ± 2.7 22.8 ± 2.1 26.8 ± 1.5 Layer. exp 1.8 nm 3.8 nm 9.8 nm 13.8 nm 17.8 nm Layer. cal 1.8 nm 3.53 nm 7.4 nm 14.2 nm 24.1 nm MnMNC12 Total 21.6 ± 2.8 23.6 ± 3.2 28.6 ± 2.7 34.6 ± 2.4 41.6 ± 2.6 Layer. exp 2.6 nm 4.9 nm 10.3 nm 15.2 nm 22.6 nm Layer. cal 1.9 nm 3.8 nm 8.3 nm 11.8 nm 20.9 nm
Figure 4 Dependency of relaxivity coefficient (r2, mM−1S−1) values on the core size and the PEG chain length of (a) MnMNC6, (b) MnMNC12. Comparison of r2 values of conventional iron oxide nanoparticles (dotted black line: Feridex, dotted gray line: CLIO).
leading to different values of relaxivity. The r2 coeffi-cient of the MnMNC12 increased by 1.54-fold as the PEG molecular weight decreased from 20 to 2 K; how-ever, it did not increase further as the PEG size further decreased to 2 and 1 K. MnMNC6 has a similar tendency; its r2 coefficient increased by 1.30-fold as the PEG molecular weight decreased from 20 to 1 K. Inter-estingly, both cores (6 and 12 nm) would have a critical PEG size, at which the r2 coefficient can be optimized through surface coating thickness. For instance, 12 nm MnMNCs core with DA-PEG2K exhibited the highest r2 coefficient of 452 ± 7.4 mM−1 s−1, which is 7.29- and 4.10-folds higher than those of CLIO and Feridex, re-spectively. Consequently, from the optimal combination
of the core size and coating thicknesses, r2 value maxi-mized MnMNC design could be determined and therefore, MnMNC12-PEG2K and MnMNC6-PEG1K as optimized MnMNC candidates were selected for further physiological condition tests for MR contrast agents.
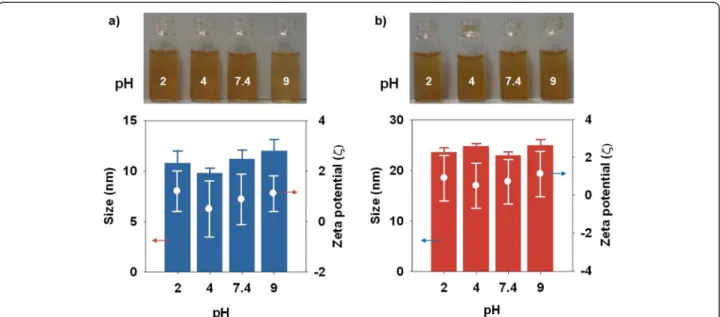
We next investigated colloidal stability of aqueous MnMNCs to be served as a MR contrast agents (Figure 5). The colloidal stabilities of MnMNCs in aqueous solution over a wide range of pH (2, 4, 7.4, and 9) are tested using laser scattering and their results were plotted against pH. We observed that their sizes were not changed indicating successful enveloping of PEG chains on the surface of MnMNCs preventing aggregation and their zeta potential values of the MnMNCs were also well maintained around at 0 ~ 2 mV (Figure 5). Although PEG coated MnMNCs exhibiting nearly neutral surface charge, excellent colloidal
Figure 5 Photographs of colloidal stability tests and hydrodynamic sizes and zeta-potential values of (a) MnMNC6-PEG1K, (b) MnMNC12-PEG2K on various pH conditions. (pH 2, 4, 7.4 and 9).
Figure 6 Time dependent (days) evaluation of transverse relaxation time (R2) of MnMNC6-PEG1K (blue) MnMNC12-PEG2K (red) in PBS ([Fe + Mn] concentration: 25μM/ 200 μL).
Figure 7 Cytotoxicity test of RAW 264.7 cells treated with MnMNC6-PEG1K (black) and MnMNC12-PEG2K (Gray), respectively.
stability was maintained even after repeated centrifuga-tions. This result indicates that PEG segment dispersed from the core surface into the aqueous exterior shielding overall surface charge. Further colloidal stability experi-ments were performed by measuring transverse relaxation time (T2) of PEG coated MnMNCs in certain period dis-persed in PBS. Figure 6 showed that their relaxation time values remained unchanged and showed excellent stability for 2 week observation.
To assess the biocompatibility of MnMNCs as a MR contrast agent, cytotoxicity of MnMNCs was investi-gated using the MTT assay and the results showed no
cytotoxicity toward RAW 264.7cells even at high con-centration (400μg/mL) (Figure 7).
Finally, we performed cellular imaging experiments with optimized MnMNC-PEG samples (MnMNC6-PEG1K and MnMNC12-PEG2K) against RAW 264.7 macrophage cells (Figure 8). Prussian blue and ferric ions of the MNCs rap-idly exchange electrons thereby producing dark blue colors in the intra-cellular region. The microscope image shows that stained MnMNC12-PEG2K with RAW 264.7 cells were observed as a dotted blue color compared to non-treated cells. Moreover, the relative MR signal inten-sity ratio (relaxivity difference between MnMNCs treated
Figure 8 Prussian blue staining images of RAW 264.7 cells treated with (a) MnMNC12-PEG2K, (b) non-treatment (Scale bars: 5μm), and (c) relative MR signal enhancement graph ofΔR2/R2non-treatmentvalue.
cells and non-treated cells =△R2/R2non-treatment, where R2 - R2non-treatment=△R2 and R2 = T2−1) showed a remark-ably high MR signal sensitivity with MnMNC12-PEG2K (157.2 ± 9.2%) and less but fairly high signal enhancement was also achieved with MnMNC6-PEG1K (87.04 ± 8.5%) compared to control cells (non-treated RAW 264.7). 4 Conclusion
In summary, we developed an efficient coating method on different core size MnFe2O4 magnetic nanocrystals (MnMNCs) using dodecanoic acid (DA)-PEG amphi-philic block copolymers by solvent evaporation method, and determined r2 value maximized MnMNCs based MR probes as MRI contrast agents compared to conven-tional iron oxide nanoparticles (Feridex and CLIO). In addition, DA-PEG coating of MnMNCs was stable and offered an optimal shell/core to achieve successful colloidal stability as well as low cytotoxicity. The study on the combination of optimal PEG layer thickness and magnetic core size for producing maximal r2 coefficient revealed that MnMNCs with 12 nm core coated with DA-PEG2K (MnMNC12-PEG2K) provided the highest r2 coefficient for MR imaging. Consequently, these ad-vantageous features of optimized PEG coated MnMNCs allowed us to obtain outstanding MR imaging results demonstrating the utility of this MR contrast agent design in future diagnostic MR imaging applications.
Competing interests
The authors declare that they have no competing interests.
Authors’ contributions
JP, JSS, YMH and SJH were involved in all stages of design of experiments and interpretation of the result. BHK and BJK carried out synthesis of MnMNCs. JP and BHK carried out data collection by subsequent ofin vitro cellular test with MRI. All authors read and approved the final manuscript.
Acknowledgements
This research was supported by the Bio & Medical Technology Development Program of the National Research Foundation (NRF) funded by the Korean government (MEST) (2012050077).
Author details
1Department of Chemical and Biomolecular Engineering, Yonsei University,
Seoul 120-749, South Korea.2Department of Radiology & Department of
Biochemistry and Molecular Biology, Yonsei University, Seoul 120-752, South Korea.3YUHS-KRIBB Medical Convergence Research Institute, Yonsei
University, Seoul 120-752, South Korea.
Received: 29 July 2014 Accepted: 20 September 2014
References
1. JW Bulte, DL Kraitchman, Iron oxide MR contrast agents for molecular and cellular imaging. NMR Biomed. 17(7), 484–499 (2004)
2. H Lee, E Sun, D Ham, R Weissleder, Chip-NMR biosensor for detection and molecular analysis of cells. Nat. Med. 14(8), 869–874 (2008)
3. J-H Lee, J-T Jang, J-S Choi, SH Moon, S-H Noh, J-W Kim, J-G Kim, I-S Kim, KI Park, J Cheon, Exchange-coupled magnetic nanoparticles for efficient heat induction. Nat. Nano. 7(6), 418–422 (2011)
4. Y-W Jun, Y-M Huh, J-S Choi, J-H Lee, H-T Song, S Kim, S Yoon, K-S Kim, J-S Shin, J-S Suh, J Cheon, Nanoscale Size Effect of Magnetic Nanocrystals and
Their Utilization for Cancer Diagnosis via Magnetic Resonance Imaging. J. Am. Chem. Soc. 127(16), 5732–5733 (2005)
5. WS Seo, JH Lee, X Sun, Y Suzuki, D Mann, Z Liu, M Terashima, PC Yang, MV McConnell, DG Nishimura, H Dai, FeCo/graphitic-shell nanocrystals as advanced magnetic-resonance-imaging and near-infrared agents. Nat. Mater. 5(12), 971–976 (2006)
6. UI Tromsdorf, NC Bigall, MG Kaul, OT Bruns, MS Nikolic, B Mollwitz, RA Sperling, R Reimer, H Hohenberg, WJ Parak, S Forster, U Beisiegel, G Adam, H Weller, Size and surface effects on the MRI relaxivity of manganese ferrite nanoparticle contrast agents. Nano Lett. 7(8), 2422–2427 (2007)
7. JH Lee, YM Huh, YW Jun, JW Seo, JT Jang, HT Song, S Kim, EJ Cho, HG Yoon, JS Suh, J Cheon, Artificially engineered magnetic nanoparticles for ultra-sensitive molecular imaging. Nat. Med. 13(1), 95–99 (2007) 8. S Tong, S Hou, Z Zheng, J Zhou, G Bao, Coating Optimization of
Superparamagnetic Iron Oxide Nanoparticles for High T2 Relaxivity. Nano Lett. 10(11), 4607–4613 (2010)
9. J Yang, T Lee, J Lee, EK Lim, W Hyung, CH Lee, YJ Song, JS Suh, HG Yoon, YM Huh, SJ Haam, Synthesis of Ultrasensitive Magnetic Resonance Contrast Agents for Cancer Imaging Using PEG-Fatty Acid. Chem. Mater. 19(16), 3870–3876 (2007) 10. M Liong, H Shao, JB Haun, H Lee, R Weissleder, Carboxymethylated
Polyvinyl Alcohol Stabilizes Doped Ferrofluids for Biological Applications. Adv. Mater. 22(45), 5168–5172 (2010)
11. T-J Yoon, KN Yu, E Kim, JS Kim, BG Kim, S-H Yun, B-H Sohn, M-H Cho, J-K Lee, SB Park, Specific Targeting, Cell Sorting, and Bioimaging with Smart Magnetic Silica Core–Shell Nanomaterials. Small 2(2), 209–215 (2006) 12. S Sun, H Zeng, DB Robinson, S Raoux, PM Rice, SX Wang, G Li,
Monodisperse MFe2O4 (M = Fe, Co, Mn) Nanoparticles. J. Am. Chem. Soc. 126(1), 273–279 (2003)
13. E-K Lim, J Yang, CPN Dinney, J-S Suh, Y-M Huh, S Haam, Self-assembled fluorescent magnetic nanoprobes for multimode-biomedical imaging. Biomaterials 31(35), 9310–9319 (2010)
14. M Johnsson, P Hansson, K Edwards, Spherical Micelles and Other Self-Assembled Structures in Dilute Aqueous Mixtures of Poly(Ethylene Glycol) Lipids. J. Phys. Chem. B 105(35), 8420–8430 (2001)
15. RA Sperling, T Liedl, S Duhr, S Kudera, M Zanella, CAJ Lin, WH Chang, D Braun, WJ Parak, Size Determination of (Bio)conjugated Water-Soluble Colloidal Nanoparticles: A Comparison of Different Techniques. J. Phys. Chem. C 111(31), 11552–11559 (2007)
Submit your manuscript to a
journal and benefi t from:
7 Convenient online submission 7 Rigorous peer review
7 Immediate publication on acceptance 7 Open access: articles freely available online 7 High visibility within the fi eld
7 Retaining the copyright to your article

![Table 1 Calculated [14] and measured thickness of different core and PEG sizes](https://thumb-ap.123doks.com/thumbv2/123dokinfo/5068905.71125/5.892.86.810.150.296/table-calculated-measured-thickness-different-core-peg-sizes.webp)