Design and evaluation of a new filter-based
fatigue index
Jungyoon Kim
The Graduate School
Yonsei University
Design and evaluation of a new filter-based
fatigue index
A Dissertation
Submitted to the Department of Biomedical Engineering
and the Graduate School of Yonsei University
in partial fulfillment of the
the requirements for the degree of
Doctor of Philosophy
Jungyoon Kim
-i-
Acknowledgments
At first, I would like to thank my supervisor, Professor Youngho Kim for giving me the opportunity of studying this theme and for all kinds of support that I achieved. I am also thankful to my dissertation committee members, Professor Kyoungjoung Lee, Professor Yongheum Lee, Professor Sungjae Song, and Professor Taesoo Bae for thoughtful suggestions and advices. In addition, I thank over other professors of the Department of Biomedical Engineering in Yonsei University for their sincere teaching.
I would like to thank all members of Biomechanics & Rehabilitation Lab. for all the supports and motivation. They are as important as my family in my life.
I thank my colleagues in Yonsei University for providing motivation during the research of biomedical engineering. I also thank all of my friends
Finally and most of all, I would like to thank my family for continuous love and generous support. Nothing I can say can adequately express my gratitude for the adoration, support and encouragement they provided throughout my life.
Thank you!
-ii-
Contents
Acknowledgements
i
Contents
ii
List of Figures
vi
List of tables
ix
Abstract
xi
1. Introduction
1
1.1 Muscle fatigue
1
1.2 Measurement of muscle fatigue
3
1.3 Previous EMG-based fatigue indices
4
1.4 Aim of the research
6
1.5 Outline of the dissertation
6
2. Design of filter-based fatigue index
7
2.1 Purpose
7
2.2 Experimental methods
8
-iii-
2.2.2 Experimental procedures
8
2.2.3 Data acquisition
9
2.2.4 Data analysis
9
2.2.5 Statistical analysis
12
2.3 Results
11
2.3.1 Changes in power output
11
2.3.2 Changes in EMG indices
12
2.3.3 Relationships between EMG indices and power output 13
2.4 Discussion
15
3. Bandwidth optimization of filter-based fatigue index
during isotonic exercise
19
3.1 Purpose
19
3.2 Experimental methods
20
3.2.1 Subjects
20
3.2.2 Experimental procedures
20
3.2.3 Data acquisition
21
3.2.4 Data analysis
21
-iv-
3.2.5 Statistical analysis
23
3.3 Results
24
3.3.1 Joint power output
24
3.3.2 EMG indices of rectus femoris (RF) muscle
26
3.3.3 EMG indices of vastus muscle (VM, VL)
27
3.3.4 Relationship between EMG indices and power output 30
3.4 Discussion
32
4. Validation of filter-based fatigue index
36
4.1 Purpose
36
4.2 Experimental methods
37
4.2.1 Subjects
37
4.2.2 Experimental procedures
38
4.2.3 Data acquisition
40
4.2.4 Data analysis
41
4.2.5 Statistical analysis
42
4.3 Results
44
-v-
4.3.2 Bandwidth optimization during different exercises
45
4.3.3 Bandwidth optimization at various inter-electrode distances
47
4.4 Discussion
49
5. Discussion and conclusion
53
5.1 Discussion
53
5.2 Conclusion
56
References
59
Appendices
70
-vi-
List of Figures
Fig. 2.1. Changes in peak power and sEMG parameters (mean ± standard deviation)
during the five sets of a maximum of ten repetitions. (a) Peak power and (b) root mean square (RMS) values of the rectus femoris; (c) median frequency (Fmed) of the rectus femoris; (d) 400 Hz cut-off new fatigue index (FIhlr400) of the rectus femoris; (e) 320 Hz cut-off new fatigue index (FIhlr400) of the rectus femoris; (f) 240 Hz cut-off new fatigue index (FIhlr400) of the rectus femoris (*significant differences at p < 0.05).
Fig. 2.2. Linear representations of changes in peak power (normalized by the first two
repetitions) versus changes in different sEMG parameters (normalized by the first two repetitions) for all subjects. (a) Changes in power output versus changes in RMS value. (b) Changes in power output versus changes in Fmed. (c) Changes in power output versus changes in FIhrl400. (d) Changes in power output versus changes in FIhlr380. (e) Changes in power output versus changes in FIhlr360. (f) Changes in power output versus changes in FIhlr340.
Fig. 3.1. Peak power and EMG indices of rectus femoris muscle (mean ±standard
deviation) during five sets of ten repetitions. (a) Peak power; (b) RMS values of sEMG signal; (c) median frequency (Fmed); (d) median frequency after continuous wavelet transform (CWT & Fmed); (e) the logarithm of Dimitrov’s index (FInsm5); (f) the logarithm of Gonzalez-Izal’s index (WIRE51); (g) bandwidth-optimized fatigue index (FIhlrOPT) (*significant differences at p < 0.05).
-vii-
Fig. 3.2. Peak power and EMG indices of average of vastus muscles (mean ±standard
deviation) during five sets of ten repetitions. (a) RMS values of sEMG signal; (b) median frequency (Fmed); (c) median frequency after continuous wavelet transform (CWT & Fmed); (d) the logarithm of Dimitrov’s index (FInsm5); (e) the logarithm of Gonzalez-Izal’s index (WIRE51); (f) bandwidth-optimized fatigue index (FIhlrOPT) (*significant differences at p < 0.05).
Fig. 3.3. Linear representations of peak power output (normalized by the first two
repetitions) versus various EMG indices (normalized by the first two repetitions) for all subjects. (a) Peak power output versus RMS values of sEMG signal; (b) peak power output versus Fmed; (c) peak power output versus CWT & Fmed; (d) peak power output versus the logarithm of FInsm5; (e) peak power output versus the logarithm of WIRE51; (f) peak power output versus FIhrlOPT.
Fig. 4.1. Photograph of various inter-electrode distances (2cm, 6cm and 10cm)
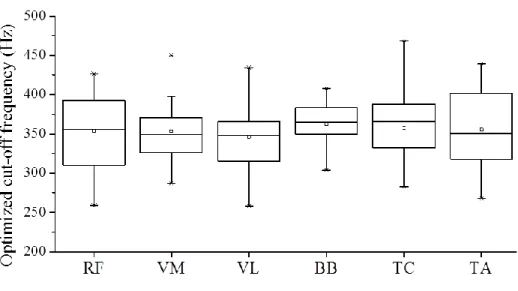
Fig. 4.2. Optimized cut-off frequencies for various muscles during isotonic exercises.
Optimized cut-off frequencies were 353.3 ± 49.5 Hz in RF muscle, 343.9 ±34.2 Hz in VM muscle, 353.7 ±36.1 Hz in VL muscle, 362.3 ±28.2 Hz in BB muscle, 357.5 ±46.0 Hz in TC muscle, and 348.1 ±38.2 Hz in TA muscle.
-viii-
Fig. 4.3. Optimized cut-off frequencies for different exercises in the rectus femoris
(RF) muscle. Optimized cut-off frequencies were 353.3 ± 49.5 Hz in isotonic exercise, 354.0 ±46.3 Hz in isokinetic exercise, and 357.4 ±45.4 Hz in isometric exercise.
-ix-
List of Tables
Table 2.1. Correlation coefficients between changes in the EMG parameters and the
corresponding changes in peak power output
Table 3.1. Optimized cut-off frequencies and correlation coefficients
Table 3.2. Correlation coefficients between EMG indices and peak power output
Table 4.1. Characteristic of six kinds of exercises
Table 4.2. Correlation coefficients between EMG parameters and peak power output
in various muscles
Table 4.3. Correlation coefficients between EMG parameters and peak power output
or joint torque for different exercises
Table 4.4. Optimized cut-off frequencies and correlation coefficients between FIhlrOPT and the peak power output or joint torque in various inter-electrode distances
-x-
Table 4.5. Correlation coefficients between FIhlrOPT and peak power output or joint torque at various inter-electrode distances
-xi-
Abstract
Design and evaluation of a new filter-based
fatigue index
Jungyoon Kim
Dept. of Biomedical Engineering
The Graduate School
Yonsei University
In this study, new filter-based fatigue index was designed to estimate muscle fatigue.
Muscle fatigue is a temporary loss of strength and energy resulting from hard physical work. It is a hindrance during exercise, as it causes dysfunction. Thus muscle fatigue plays an important role in prolonged contractile activity-induced skeletal muscle injury. Because of these reasons, the measurement of muscle fatigue is very important.
Filter-based fatigue index, which is the ratio of high-frequency to low-frequency components of EMG power, was designed to assessing muscle fatigue. To determine the frequency bandwidth of the designed fatigue index, cut-off frequencies of the high-pass-filter were optimized to maximize the
-xii-
correlation coefficient between the peak power or joint torque and the designed filter-based fatigue index. To evaluate the designed filter-based fatigue index, accuracy of muscle fatigue estimation was compared with other fatigue indices. The designed fatigue index was validated in various muscles, different exercises, and different inter-electrode distances.
Results, The filter-based fatigue index showed the best correlation with biomechanical fatigue over other fatigue indices in all conditions. This implies the filter-based fatigue index could assess muscle fatigue accurately than other fatigue indices. In addition, optimized cut-off frequencies in various muscles, under different exercises and various inter-electrode distances were consistent about 350 Hz. Consistency of the optimized cut-off frequencies in all conditions implied that 350Hz HPF could be a general solution for the filter-based fatigue index and the filter-based fatigue index reflects firing rate of motor units. Overall, these findings may be useful for muscle fatigue assessment.
One of the main finding of this study was that filter-based fatigue index reflects the firing rate of motor units. However, firing rates of motor units were not measured during fatigue. In further studies, MUAP decomposition methods or intramuscular EMG methods would be applied to measure the firing rate of motor units.
-xiii-
Key words: surface electromyography, digital filter, fatigue index, frequency band, cut-off frequency, optimization, validation, various muscles, different exercises, inter-electrode distance
-1-
Chapter 1
1. Introduction
1.1 Muscle fatigue
Muscle fatigue is a temporary loss of strength and energy resulting from hard physical work. Muscle fatigue has been defined as “a response that is less than the expected or anticipated contractile response, for a given stimulation” (MacIntosh and Rassier, 2002). Hard physical exercise or prolonged physical work involving 30% to 40% of maximal aerobic capacity induces muscle fatigue (Astrand and Rodahl, 1986). Muscle fatigue is a hindrance during exercise, as it causes dysfunction (Ishii and Nichida, 2013).
In industries and transportation, frequent and repetitive sub-maximal contraction and incorrect posture leads to many disorders of muscles, tendons and nerves (http://www.ccohs.ca/oshanswers/diseases/rmirsi.html). Repetition of same task and prolonged abnormal posture contributes to upper limbs and neck disorders (Walker-Bone and Cooper, 2005; Van et al, 2009). In sports, muscle fatigue plays an important role in prolonged contractile activity-induced skeletal muscle injury (Hägglund et al, 2013). In transportation industry, fatigue related accidents are major killers (Sung et al., 2005). 25% of
-2-
single vehicle accidents are direct result of driver’s fatigue. Because of these reasons, understanding of muscle fatigue is important.
With fatigue, muscular response declines because less calcium is released, limiting the number of attached actin-myosin bridge connections of actin-myosin (Sesboüé and Guincestre, 2006). On a metabolic level, reduced pH and increased intracellular lactate levels are the most frequent changes (Arabadzhiev et al., 2010).
In terms of electrical response, electromyography (EMG) signals reflect both central and peripheral fatigue. During maximal isometric contraction, EMG signal amplitudes decrease due to reductions in motor output from the central nervous system (Bigland-Ritchie et al., 1983a). Due to peripheral factors, EMG signal amplitudes may increase (Masuda et al., 1999). Thomas et al. (2006) explained the elevated peak-to-peak amplitudes and areas of motor unit action potentials (MUAPs) by invoking increased Na+–K+ pump activity.
-3-
1.2 Measurement of muscle fatigue
Various methods have been used to assess muscle fatigue. First, joint torque or power can reflect muscle fatigue (Fuglevand et al., 1999; Thomas et al., 1991). The speed of joint movement slows down naturally as fatigue increases during a classical training session (Gonzalez-Izal et al., 2010a), and joint torque decreases as fatigue increases during isokinetic exercise. This method can measure the decreased contractile response directly. However, joint torque may not decrease during sub-maximal exercise even if the muscles are fatigued. Furthermore, joint motion is limited during the measurement of joint torque or power because of the measuring devices. Second, blood lactate concentrations are generally used to assess muscle fatigue (Amann et al., 2010; Coco et al., 2010). Muscular contractions can cause lactate and hydrogen ion concentrations to increase to very high levels during physical exercise (Gladden, 2004). A larger number of fast twitch fibers is employed with increasing exercise intensity and these fibers are more suited to the production of lactate (Facey et al., 2013). This method needs a blood sample to analyze lactate concentrations. It cannot target the muscle, and cannot be measured during exercise. Thirdly, surface electromyography (sEMG) is a non-invasive fatigue assessment method. Muscle fiber conduction velocity (MFCV) decreases and the EMG power spectrum shifts to lower frequencies during peripheral fatigue (Cifrek et al., 2009; Farina et
-4-
al., 2004; Farina, 2006). This method can assess the fatigue of individual superficial muscles. This research focused on sEMG-based fatigue assessment.
1.3 Previous EMG-based fatigue indices
In isometric fatiguing conditions, the EMG power spectrum shifted to the lower frequencies, and muscle fiber conduction velocity (MFCV) decreased (Masuda et al., 1999; Cifrek et al., 2009). Mean and median frequencies (Fmean and Fmed) are generally used to detect these effects. However, MFCV did not decrease during submaximal dynamic exercises (Masuda et al., 1999), and thus Fmean and Fmed have a relatively low sensitivity under dynamic exercise conditions (Farina et al., 2004; Farina, 2006). Various methods have been attempted to overcome this problem (Karlsson et al., 2000; Dimitrov et al., 2006; Gonzalez-Izal et al., 2010b). Karlsson et al. (2000) compared various time-frequency analysis methods (i.e. the short-time Fourier transform, the Wigner-Ville distribution, the Choi-Williams distribution and the wavelet transform) during dynamic exercises, and found that the estimations provided by the continuous wavelet transform (CWT) showed the best accuracy. Dimitrov et al. (2006) proposed the high-sensitivity spectral index as the ratio between the EMG power spectral moment of order (-1), and the EMG power spectral moment of order 5. They showed that their index FInsm5 increased eightfold from the initial value and Fmed decreased only 32% from the initial value during cycling exercises. Gonzalez-Izal et al. (2010b)combined the
-5-
discrete wavelet transforms (DWT) and the ratios between different spectral moments. They confirmed that their index WIRE51 showed a good correlation with power output and the robustness against noise during leg press exercises. However, large amounts of computational load and time-frequency resolution were the drawbacks of those methods. Ratios of the EMG power content in high and low frequency ranges have been adopted as indices of peripheral muscle fatigue (Lee et al., 2009; Chaffin, 1973; Kogi and Hakamada, 1962; Sato, 1982; Moxham et al., 1982; Bellemare and Grassino, 1982). However, there have been difficulties in selecting bandwidth in boundary frequency, high-frequency, and low-frequency, and these difficulties are evident in the widely varying bandwidth choices across studies (30 Hz (Chaffin, 1973), 40 Hz (Kogi and Hakamada, 1962), or 64 Hz (Sato, 1982); 130–238 vs. 20–40 Hz (Moxham et al., 1982), 150–350 vs. 20–46.7 Hz (Bellemare and Grassino, 1982)). The difficulties arise from causes such as the EMG power spectrum shifting not only due to muscle fatigue, but also due to the distance between muscle fibers and electrode distances, and the use of inaccurate electrode attachment sites (Dimitrov and Dimitrova, 1998).
-6-
1.4 Aim of the study
The objective of this research is design of a new filter-based fatigue index which has the lower computational load and high time resolution. To improve the filter-based fatigue index, optimization method is used to determine the bandwidth of high-frequency components. Then, filter-based fatigue index is tested in various conditions for validation.
1.5 Outline of the dissertation
This dissertation is composed of 5 chapters, including the present one.
Chapter 2 presents the design of a new filter-based fatigue index, which is the ratio of high-frequency to low-frequency components of EMG power, for assessing muscle fatigue. In the Chapter 3, cut-off frequencies of the high-pass-filter were optimized to maximize the correlation coefficient between the peak power and the designed filter-based fatigue index. The frequency bandwidth is determined as optimized cut-off frequencies. Chapter 4 presents the validation of designed filter-based fatigue index in various muscles, different exercises, and different inter-electrode distances. The designed filter-based fatigue index was compared with other fatigue indices. Chapter 5 presents the discussions and the conclusions.
-7-
Chapter 2
2. Design of a filter-based fatigue index
2.1 Purpose
In contrast to isokinetic fatigue assessment (i.e. with constant velocity adjustments by the isokinetic device) during muscle daily function or in a classical training session (i.e. 3–5 sets of 10 repetition maximum) the speed of the repetitions slows down naturally as fatigue increases (i.e. with variable velocity adjustments). Indeed, hypothesis was that EMG fatigue quantification of peripheral impairments might provide useful information of the loss of power output during dynamic contractions.
In this study, new filter-based fatigue index, which is the ratio of high-frequency to low-high-frequency components of EMG power, was designed and evaluated to assess muscle fatigue. The designed fatigue index was compared with the conventional Fmed and EMG amplitude.
-8-
2.2 Experimental methods
2.2.1 Subjects
Twenty healthy males (age: 25.6 ± 3.1 yrs, height: 172.8 ± 6.1 cm, mass: 73.3 ± 10.1 kg) were recruited for this study. None of the subjects participated in any systemic physical training. Subjects were informed about the experimental procedure and the purpose of the study. All subjects provided written informed consent to participate in the experiment. To familiarize the subjects with the study procedures, three to four voluntary submaximal isometric and isotonic contraction practice sessions were completed before the actual experiments.
2.2.2 Experimental procedures
The subjects performed the knee extension/flexion exercises on the isokinetic dynamometer (Biodex System 3, Biodex Medical Systems, USA) to measure the maximum torque and the maximal voluntary contraction (MVC). Full extension of the knee joint was set to 0º, and the maximum knee flexion was 115º. EMG signals and the maximum torque during MVC were measured at a knee angle of 90º, and each subject performed the maximal knee extension ten times to determine the ten repetition maximum (10RM) torque. After a sufficient break (about ten minutes), the measured 10RM was 61.5 ± 4.6% of the maximum torque and this value was used for fatigue exercises. The experimental protocol was designed according to the acute
heavy--9-
resistance exercise protocol (AHREP) and consisted of five sets of ten knee extensions with two minutes of rest between sets. During the fatigue exercises, the subjects were asked to extend their knee as quickly as possible.
2.2.3 Data acquisition
An EMG signal was obtained from the right rectus femoris (RF) muscle using a Noraxon EMG System (MyoSystem 1200, Noraxon Inc., USA). The EMG signal and biomechanical signals (angle, angular velocity, and torque) acquired from the isokinetic dynamometer were recorded simultaneously at a sampling rate of 1 kHz. The EMG signal was recorded by a standard active bipolar surface electrode (14 mm in diameter, 18 mm inter-electrode distance; Noraxon, USA). After careful preparation of the skin (shaving, abrasion, and cleaning with alcohol), electrode pairs were placed longitudinally on the middle portion of the muscle, based on SENIAM (Surface ElectroMyoGraphy for the Non-Invasive Assessment of Muscles) recommendations.
2.2.4 Data analysis
Data analysis was performed off-line using MATLAB R2010a software (MathWorks Inc., Natick, Massachusetts, USA). MVC torque was calculated as the average torque over a 1-s period during the torque-plateau level of each MVC attempt. The peak power output was calculated for each exercise repetition as the product of joint torque and angular velocity. Ten segments
-10-
from the raw EMG signal for each set were extracted, with each segment corresponding to a knee extension repetition. The parameters analyzed in this study corresponded to each extracted segment.
The following EMG parameters were calculated:
(1) Mean RMS was calculated using a 50-ms moving root-mean-squared filter (Roy et al., 1986), as the integrated EMG divided by integration time.
(2) Fmed was calculated using the following equation:
2
med med 1 f F F fPS(f)
df
PS(f)
df
(2.1)where PS(f) is the spectral power for the current frequency f, and f1 (=10 Hz) and f2 (=500 Hz) are the determined bandwidths of the EMG signals.
(3) The proposed filter-based fatigue index was calculated as follows:
dt
(t
t
)
(t)
LE
(t)
LE
FI
t end start t 120HzLPF xHzHPF hlrx end start
(2.2)where tstart and tend are the start and end time of each exercise repetition, respectively. LE120HzLPF(t) is the second-order Butterworth 3 Hz linear-enveloped signal of the 120 Hz low-pass-filtered EMG signal, and LExHzHPF(t) is the second-order Butterworth 3 Hz linear-enveloped signal of the repeated high-pass-filtered EMG signal varied from 200 Hz to 400 Hz in
-11-
increments of 20 Hz. FIhlrx was calculated as the average knee extension time to compare with other fatigue indices.
2.2.5 Statistical analysis
All the variables (peak power output and EMG-based parameters) were normalized with the first two contractions of the first set of exercises. Pearson’s correlation analysis was used to analyze the relationship between the peak power and the different EMG parameters. One-way analysis of variance (ANOVA) was used to calculate significant differences in the parameters recorded for five consecutive repetitions. P < 0.05 was considered as the indicative of statistical significance.
2.3 Results
2.3.1 Changes in power output
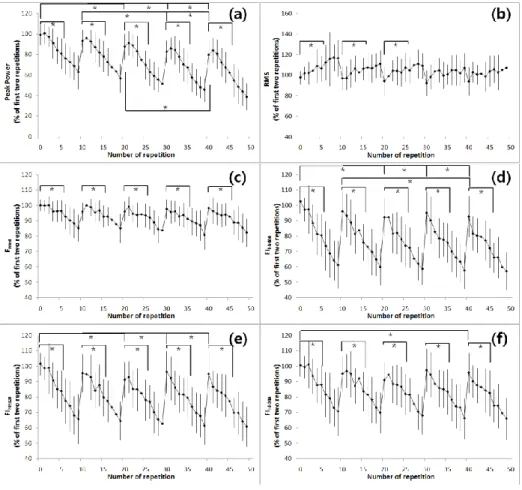
Fig. 2.1(a) shows joint power outputs during the experiment. For each subject, joint power outputs decreased significantly with the number of sets as well as of the repetitions in each set. Joint power outputs from the last five repetitions of the fifth set was 47% lower than those from the first set (p<0.05, Fig. 2.1(a)). Joint power outputs of the last five repetitions in each set were significantly smaller than those from the first five repetitions (p < 0.05). Joint power outputs from the first five repetitions of the third, fourth, and fifth sets
-12-
was significantly smaller than those from the first five repetitions of the first set (P < 0.05). In addition, joint power outputs from the first five repetitions of the fourth and fifth sets were significantly smaller than those from the first five repetitions of the second set (p < 0.05) and first five repetitions of the fifth set were significantly smaller (p < 0.01) than those from the first five repetitions of the third set.
2.3.2 Changes in EMG indices
Fig. 2.1(b) shows the RMS values of EMG signals in this study. From the first to third set, the last five repetitions had larger RMS values of EMG signals than the first five repetitions (p<0.05, Fig. 2.1(b)). In the fourth and fifth sets, the RMS values of the last five repetitions were larger, but the difference was not statistically significant.
Fmed was significantly smaller in the last five repetitions than in the first five repetitions for every set (p<0.01, Fig. 2.1(c)). There was no statistically significant difference between Fmed from the first five repetitions of the first set and the first five repetitions of other sets.
FIhlrx was significantly smaller for last five repetitions than first five repetitions in all cut-off frequencies for every set (p<0.05, Fig. 2.1(d-f)). For cut-off frequency of 240 Hz or above, FIhlrx from the first five repetitions of the first set and the first five repetitions of the last set showed a statistically significant difference (p<0.05). For cut-off frequency of 320 Hz or above,
-13-
FIhlrx form the first five repetitions of the first set and the first five repetitions of third, fourth, and fifth sets showed a statistically significant difference (p<0.05). In FIhlr400, the first five repetitions of the second set and the first five repetitions of the last set showed a statistically significant difference (p<0.05).
2.3.3 Relationships between EMG indices and power output
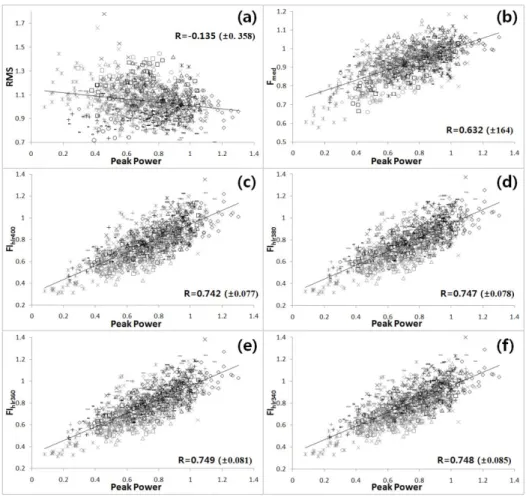
The EMG parameter with the strongest correlation with mechanical power was FIhlr360 (R=0.749 (±0.081); p<0.01, Fig. 2.2(c)). For a cut-off frequency of 320 Hz or above, the correlation coefficient was 0.74 (Fig. 2.2(c-f)) or greater, and the decrease in frequency was accompanied by decreases in the correlation coefficient. Fmed and RMS had correlation coefficients of 0.632 (±0.164) and -0.135 (±0.358), respectively (Table 2.1 and Fig. 2.2(a-b)).
-14-
Fig. 2.1. Changes in peak power and sEMG parameters (mean ± standard deviation) during the five sets of a maximum of ten repetitions. (a) Peak power and (b) root mean square (RMS) values of the rectus femoris; (c) median frequency (Fmed) of the rectus femoris; (d) 400 Hz cut-off new fatigue index (FIhlr400) of the rectus femoris; (e) 320 Hz cut-off new fatigue index (FIhlr400) of the rectus femoris; (f) 240 Hz cut-off new fatigue index (FIhlr400) of the rectus femoris (*significant differences at p < 0.05).
-15-
2.4 Discussion
In this study, ratios of EMG power content in the high and low frequency ranges were calculated using a FIR filter, not by a frequency analysis. This technique has the advantage of addressing time-frequency resolution issues and also reducing the computational load.
Results revealed that new fatigue indices, FIhlrx, showed better correlation with changes in joint power in multiple high-intensity dynamic exercises. RMS values of EMG signals have increasing tendency with the muscle fatigue, as the previous studies (Masuda et al., 1999; Potvin and Bent, 1997), which is originated from the additional recruitment of motor unit (moritani et al., 1982), rise in the motor unit firing frequency (Bigland-Ritchie et al., 1983b), and the lengthening of intracellular action potential typical for fatiguing contractions (Komi and Tesch, 1979).
Many studies reported that the reduction in joint power is accompanied by the reduction in median frequency (Masuda et al., 1999; Gonzalez-Izal et al., 2010a; Dimitrov et al., 2006), which is due to the lengthening effect of motor unit action potential (Bigland-Ritchie et al., 1981) and reduced activation of fast twitch muscle fibers (Komi and Tesch, 1979).
Joint power and median frequency had the correlation coefficient of 0.632, implying that the median frequency would reflect the muscle fatigue well. The present study also supported many previous studies, stating that the median frequency could be used to estimate the muscle fatigue in
high--16-
intensity dynamic exercises (Potvin and Bent, 1997; Ament et al., 1996; Gerdle et al., 2000). In FIhlrx values, FIhlr360 was found to have the highest correlation (0.749) with joint power, and the correlation coefficient was 0.74 or greater for 320 Hz or above. This implied that FIhlrx could evaluate the muscle fatigue at high-intensity exercises well.
As in the results of previous reports, there were no significant differences in Fmed for the first five repetitions of every set (Gonzalez-Izal et al., 2010a). However, FIhlrx differed significantly in the first five repetitions of each set, reflecting the reduction in joint power from the first five repetitions of every set. These findings also indicate that FIhlrx could serve as a means to assess muscle fatigue even under a low-fatigue state. FIhlr400 showed the best results for identifying differences in the first five repetitions of each set.
The proposed filter-based fatigue index, FIhlrx, was applied to the rectus femoris muscle alone and did not take into account electrode sizes, inter-electrode distance, or inter-electrode type. All of these parameters should be considered to determine the cut-off frequency of HPF.
-17-
Fig. 2.2. Linear representations of changes in peak power (normalized by the first two repetitions) versus changes in different sEMG parameters (normalized by the first two repetitions) for all subjects. (a) Changes in power output versus changes in RMS value. (b) Changes in power output versus changes in Fmed. (c) Changes in power output versus changes in FIhrl400. (d) Changes in power output versus changes in FIhlr380. (e) Changes in power output versus changes in FIhlr360. (f) Changes in power output versus changes in FIhlr340.
-18-
Table 2.1. Correlation coefficients between changes in the EMG parameters and the corresponding changes in peak power output
Fmed FIhlr400 FIhlr380 FIhlr360 FIhlr340 FIhlr320 FIhlr300 FIhlr280 FIhlr260 FIhlr240 FIhlr220 FIhlr200 Peak power RMS -0.350 ±0.235 -0.540 ±0.300 -0.538 ±0.300 -0.534 ±0.301 -0.528 ±0.301 -0.522 ±0.300 -0.517 ±0.298 -0.511 ±0.297 -0.505 ±0.295 -0.497 ±0.292 -0.489 ±0.288 -0.480 ±0.284 -0.135 ±0.358 Fmed - 0.745 ±0.096 0.761 ±0.092 0.773 ±0.090 0.783 ±0.086 0.793 ±0.082 0.800 ±0.080 0.807 ±0.079 0.813 ±0.078 0.820 ±0.077 0.827 ±0.075 0.834 ±0.074 0.632 ±0.164 FIhlr400 - 0.997 ±0.002 0.991 ±0.005 0.982 ±0.010 0.973 ±0.014 0.964 ±0.018 0.954 ±0.023 0.945 ±0.028 0.934 ±0.033 0.922 ±0.040 0.908 ±0.046 0.742 ±0.077 FIhlr380 - 0.998 ±0.001 0.992 ±0.004 0.985 ±0.008 0.977 ±0.011 0.969 ±0.017 0.960 ±0.022 0.950 ±0.028 0.938 ±0.034 0.925 ±0.041 0.747 ±0.078 FIhlr360 - 0.998 ±0.001 0.993 ±0.003 0.987 ±0.007 0.980 ±0.011 0.972 ±0.017 0.963 ±0.022 0.952 ±0.029 0.939 ±0.035 0.749 ±0.081 FIhlr340 - 0.998 ±0.001 0.994 ±0.003 0.989 ±0.007 0.982 ±0.012 0.973 ±0.017 0.964 ±0.024 0.952 ±0.030 0.748 ±0.085 FIhlr320 - 0.999 ±0.001 0.995 ±0.004 0.989 ±0.008 0.982 ±0.013 0.973 ±0.019 0.963 ±0.024 0.744 ±0.092 FIhlr300 - 0.999 ±0.001 0.995 ±0.004 0.989 ±0.008 0.982 ±0.013 0.972 ±0.018 0.738 ±0.101 FIhlr280 - 0.999 ±0.001 0.995 ±0.004 0.989 ±0.007 0.980 ±0.012 0.731 ±0.112 FIhlr260 - 0.999 ±0.001 0.994 ±0.003 0.988 ±0.007 0.723 ±0.121 FIhlr240 - 0.998 ±0.001 0.994 ±0.003 0.714 ±0.132 FIhlr220 - 0.998 ±0.001 0.703 ±0.143 FIhlr200 - 0.690 ±0.153
-19-
Chapter 3
3. Bandwidth optimization of the new filter-based
fatigue index during isotonic exercise
3.1 Purpose
In this study, cut-off frequencies of the high-pass-filter was optimized to maximize the correlation coefficient between the peak power and the proposed filter-based fatigue index then determined the frequency bandwidth of the new fatigue index. The new fatigue index was compared with the conventional median frequency, the median frequency after the CWT, the spectral parameter proposed by Dimitrov (2006) and the wavelet index proposed by Gonzalez-Izal (2010b).
-20-
3.2 Experimental methods
3.2.1 SubjectsThirty-two healthy males (age: 26.4 ± 4.4 years, height: 171.4 ± 6.3cm, weight: 76.5 ± 12.4kg) volunteered as subjects. Five subjects were excluded because of fatigue exercise failure. None of subjects had been involved in any regular strength training program. All subjects were informed of the purpose, the experimental procedure and the potential risk of this study. Before actual experiments, three or four voluntary isometric and isotonic contraction practices were performed to familiarize the subjects with the experimental procedures. All subjects provided written informed consent before participating in the study. Yonsei University research ethics committee reviewed and approved the proposed experimental design (1041849-201405-BM-022-02).
3.2.2 Experimental procedures
Subjects performed knee extension exercises on an isokinetic dynamometer (Biodex System 3, Biodex Medical Systems, USA) to measure the maximal voluntary contraction (MVC). Each subject’s body was stabilized on the chair in the seated position with a hip flexion angle of 80 º. The range of motion of the knee joint was from 115 º to full extension 0 º. The fatigue exercise protocol for this study was based on the previous study with one acute heavy-resistance exercise protocol (AHREP). The protocol consisted of
-21-
5 sets of 10 repetition maximum (62.3 ± 4.4% of the maximum torque in this study) knee extensions with 2 minutes of rest between sets. Before fatigue exercises, subjects performed 20 extensions with 40% of the maximum torque as a warm-up. Fatigue exercise started after a sufficient break (about 10 minutes).
3.2.3 Data acquisition
Surface electromyography (sEMG) signals during knee extension were recorded from right rectus femoris (RF), vastus medialis (VM), and vastus lateralis (VL) muscles, using Noraxon EMG system (MyoSystem 1200, Noraxon Inc., USA) and standard active bipolar surface electrodes (14mm in diameter, 18mm inter-electrode distance). EMG electrode pairs were placed on the muscle belly after shaving, abrasion and skin cleaning according to the Surface Electromyography for the Non-Invasive Assessment of Muscles (SENIAM) recommendations. Knee joint kinematics and joint torque were obtained by the isokinetic dynamometer at the sampling rate of 1 kHz.
3.2.4 Data analysis
Data analysis was performed using the MATLAB R2010a software (MathWorks Inc., USA). Corresponding to a knee extension repetition, 10 segments were extracted from raw signals for each set. EMG indices of VM and VL muscles were averaged (Gonzalez-Izal et al., 2010a).
-22-
The following EMG indices were calculated for each segment:
(1) Peak joint power output, mean root-mean-square (RMS) and Fmed were calculated based on the previous studies (Kim et al., 2012).
(2) Median frequency after the continuous wavelet transform (CWT & Fmed) was calculated by
2 m e d m e d 1 f F CWT F fPS
CWT(f)
df
PS
(f)
df
(3.1)where PSCWT(f) was the spectral power for the current frequency. f1 = 10Hz and f2 = 500Hz were the determined bandwidth of the sEMG signals.
(3) The spectral parameter proposed by Dimitrov et al. (2006) (FInsm5) was calculated by
2 1 2 1 f f 5 f f 1 n s m 5 df PS(f) f df PS(f) f FI (3.2)where PS(f) was the spectral power for the current frequency. f1 = 10Hz and f2 = 500Hz were the determined bandwidth of sEMG signals.
(4) The wavelet index proposed by Gonzalez-Izal et al. (2010b) (WIRE51) was calculated by
N 1 i 2 1 N 1 i 2 5 [ i ] D [ i ] D W I R E 5 1 (3.3)-23-
where D1[i] and D5[i]were the detailed DWT signals at scales five and one, respectively.
(5) The proposed filter-based fatigue index in this study was obtained by ) t (t dt (t) LE (t) LE FI end start t t 200HzLPF HzHPF OPT hlrOPT end start
(3.4)where OPT was the optimized cut-off frequency of the high-pass-filter. tstart and tend were the start and end time of each exercise repetition. LE200HzLPF(t) and LEOPTHzHPF(t) were linear-envelopes (the 2nd-order, Butterworth low-pass filter, 3Hz cut-off) of the 200Hz low-pass-filtered sEMG signal, and of the OPT pass-filtered sEMG signal, respectively. Cut-off frequency of the high-pass-filter was optimized using the interior-point algorithm (Wright, 2005) to maximize the correlation coefficient between peak power and FIhlrOPT. Cut-off frequency of the low-pass filter was determined to retain more than 95% of the power of raw EMG signals.
3.2.5 Statistical analysis
All variables (power output and EMG-based indices) were normalized by the first two contractions of the first set. In cases where the percentage changes did not follow the normal distribution (FInsm5 and WIRE), the
-24-
corresponding variables were log-transformed. Pearson’s correlation was used to analyze the relationship between the peak power and the different EMG indices. Differences between mean correlation coefficients for FIhrlOPT and mean correlation coefficients for other EMG indices were determined by the unpaired student's t test. Power output and EMG indices were compared in relative terms using the Friedman analysis of variance (ANOVA) by ranks. When a significant difference was shown, Tukey post hoc procedures were performed to determine the pairwise differences between the means.
3.3 Results
3.3.1 Joint power outputFig. 3.1(a) shows the peak joint power outputs during five sets of ten repetitions. Joint power output during the last five repetitions for every set was significantly smaller than the first five repetitions for every set (p < 0.05, Fig. 3.1(a)). The first five repetitions for each set differed significantly in joint power output (the first vs the third, the fourth and the fifth; the second vs the fourth and the fifth; the third vs the fifth; p < 0.05). Joint power output in the last repetition for the fifth set was 38% of those in the initial two repetitions of the first set.
-25-
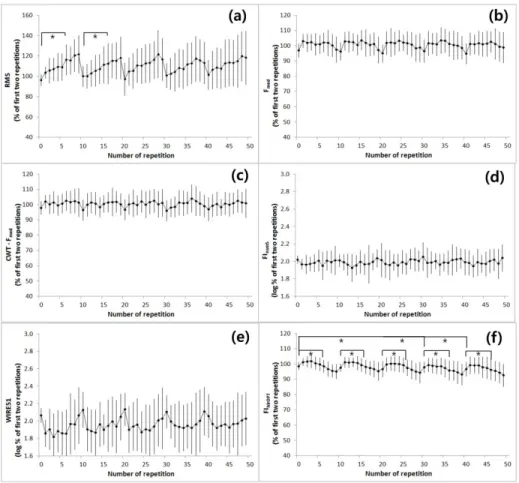
Fig. 3.1. Peak power and EMG indices of rectus femoris muscle (mean ±standard deviation) during five sets of ten repetitions. (a) Peak power; (b) RMS values of sEMG signal; (c) median frequency (Fmed); (d) median frequency after continuous wavelet transform (CWT & Fmed); (e) the logarithm of Dimitrov’s index (FInsm5); (f) the logarithm of Gonzalez-Izal’s index (WIRE51); (g) bandwidth-optimized fatigue index (FIhlrOPT) (*significant differences at p < 0.05).
-26-
3.3.2 EMG indices of rectus femoris (RF) muscle
Table 3.1 shows the optimized cut-off frequencies of RF muscle. The average cut-off frequency was 353.30 ±49.45Hz and the average correlation coefficient was 0.81 ±0.08.
Fig. 3.1(b) shows RMS values of sEMG signals for RF muscle. The last five repetitions had significantly greater RMS values of EMG signals than the first five repetitions for every set (p < 0.05, Fig. 3.1(b)).
Fig 3.1(c) shows Fmed of sEMG signals for RF muscle. Fmed of RF muscle significantly decreased during the last five repetitions for each set (p < 0.05, Fig. 3.1(c)). The first five repetitions for each set showed no significant differences in Fmed.
CWT & Fmed did not show the significant differences between the first five repetitions and the last five repetitions for all sets of data (Fig. 3.1(d)).
The logarithm of FInsm5 and the logarithm of WIRE51 for RF muscle significantly increased during the last five repetitions for each set (p < 0.05, Fig. 3.1(e-f)). In logarithms of FInsm5 and WIRE51, there were no statistically significant differences between the first five repetitions of the first set and the first five repetitions of other sets.
FIhlrOPT of RF muscle was significantly smaller for the last five repetitions than the first five repetitions for every set (p < 0.05, Fig. 3.1(g)). FIhlrOPT from the first five repetitions of the first set was significantly larger than those from the first five repetitions of the third, the fourth and the fifth
-27-
sets (p < 0.05). In the second set, FIhlrOPT from the first five repetitions was significantly larger than those from the first five repetitions of the fourth and the fifth sets (p < 0.05). In addition, the first five repetitions of the fifth set were significantly smaller (p < 0.05) than those of the third set.
3.3.3 EMG indices of vastus muscles (VM, VL)
Fig. 3.2(a) shows RMS values of sEMG signals for VM and VL muscles. The last five repetitions had larger RMS values of sEMG signals than the first five repetitions for the first and the second sets (p < 0.05, Fig. 3.2(a)). Table 3.1 shows the optimized cut-off frequencies for VM and VL muscles. The average cut-off frequency was 348.71 ±34.28Hz and the average correlation coefficient was 0.58 ±0.25. FIhlrOPT of VM and VL muscles were significantly smaller for the last five repetitions than for the first five repetitions for all sets (p < 0.05, Fig. 3.2(f)). FIhlrOPT from the first five repetitions of the first set was significantly different from those from the first five repetitions of the fourth and the fifth sets (p < 0.05). There were no statistically significant differences between other indices from the first five repetitions and the last five repetitions for all sets.
-28-
Fig. 3.2. Peak power and EMG indices of average of vastus muscles (mean ±standard deviation) during five sets of ten repetitions. (a) RMS values of sEMG signal; (b) median frequency (Fmed); (c) median frequency after continuous wavelet transform (CWT & Fmed); (d) the logarithm of Dimitrov’s index (FInsm5); (e) the logarithm of Gonzalez-Izal’s index (WIRE51); (f) bandwidth-optimized fatigue index (FIhlrOPT) (*significant differences at p < 0.05).
-29-
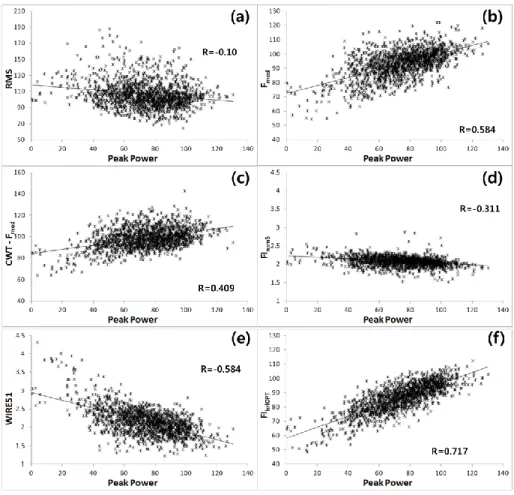
Fig. 3.3. Linear representations of peak power output (normalized by the first two repetitions) versus various EMG indices (normalized by the first two repetitions) for all subjects. (a) Peak power output versus RMS values of sEMG signal; (b) peak power output versus Fmed; (c) peak power output versus CWT & Fmed; (d) peak power output versus the logarithm of FInsm5; (e) peak power output versus the logarithm of WIRE51; (f) peak power output versus FIhrlOPT.
-30-
3.3.4 Relationships between EMG indices and power output
The EMG index of the strongest correlation with mechanical power was FIhlrOPT of RF muscle (r = 0.81 ± 0.08, p < 0.01, Fig. 3.3(f)). RMS, Fmed, CWT & Fmed, the logarithm of FInsm5 and the logarithm of WIRE51 of RF muscle had correlation coefficients of -0.10 ±0.34, 0.60 ±0.17, 0.34 ±0.23, -0.38 ±0.21 and -0.50 ±0.22, respectively (Table 3.2 and Fig. 3.3(a-e)). RMS, Fmed, CWT & Fmed, the logarithm of FInsm5, the logarithm of WIRE51, FIhlrOPT of VM and VL muscles had correlation coefficients of 0.25 ±0.25, 0.16 ±0.26, -0.03 ±0.24, -0.14 ±0.22, -0.06 ±0.24 and 0.58 ±0.25, respectively (Table 3.2).
-31-
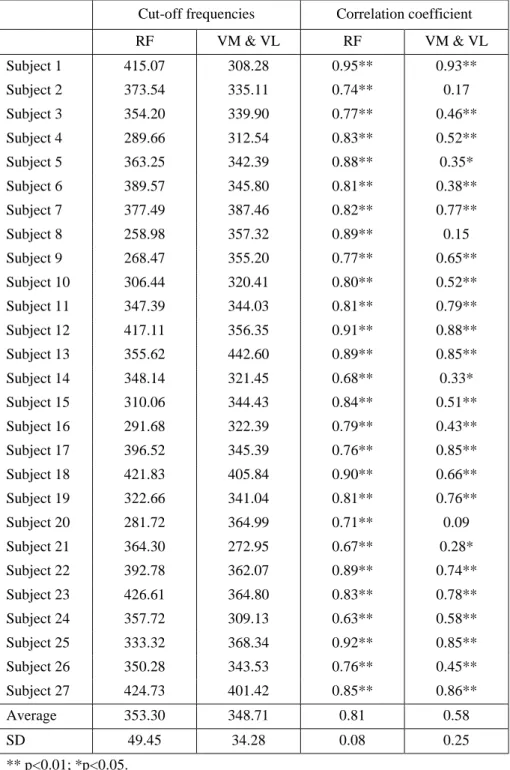
Table 3.1. Optimized cut-off frequencies and correlation coefficients
Cut-off frequencies Correlation coefficient RF VM & VL RF VM & VL Subject 1 415.07 308.28 0.95** 0.93** Subject 2 373.54 335.11 0.74** 0.17 Subject 3 354.20 339.90 0.77** 0.46** Subject 4 289.66 312.54 0.83** 0.52** Subject 5 363.25 342.39 0.88** 0.35* Subject 6 389.57 345.80 0.81** 0.38** Subject 7 377.49 387.46 0.82** 0.77** Subject 8 258.98 357.32 0.89** 0.15 Subject 9 268.47 355.20 0.77** 0.65** Subject 10 306.44 320.41 0.80** 0.52** Subject 11 347.39 344.03 0.81** 0.79** Subject 12 417.11 356.35 0.91** 0.88** Subject 13 355.62 442.60 0.89** 0.85** Subject 14 348.14 321.45 0.68** 0.33* Subject 15 310.06 344.43 0.84** 0.51** Subject 16 291.68 322.39 0.79** 0.43** Subject 17 396.52 345.39 0.76** 0.85** Subject 18 421.83 405.84 0.90** 0.66** Subject 19 322.66 341.04 0.81** 0.76** Subject 20 281.72 364.99 0.71** 0.09 Subject 21 364.30 272.95 0.67** 0.28* Subject 22 392.78 362.07 0.89** 0.74** Subject 23 426.61 364.80 0.83** 0.78** Subject 24 357.72 309.13 0.63** 0.58** Subject 25 333.32 368.34 0.92** 0.85** Subject 26 350.28 343.53 0.76** 0.45** Subject 27 424.73 401.42 0.85** 0.86** Average 353.30 348.71 0.81 0.58 SD 49.45 34.28 0.08 0.25 ** p<0.01; *p<0.05.
-32-
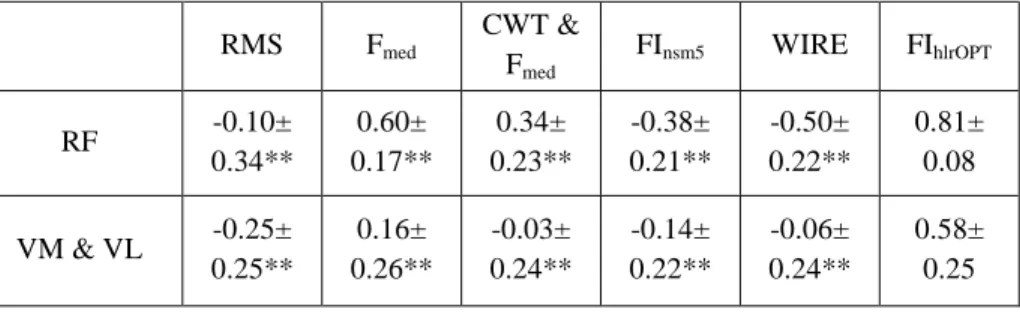
Table 3.2. Correlation coefficients between EMG indices and peak power output
RMS Fmed CWT & Fmed FInsm5 WIRE FIhlrOPT RF -0.10± 0.34** 0.60± 0.17** 0.34± 0.23** -0.38± 0.21** -0.50± 0.22** 0.81± 0.08 VM & VL -0.25± 0.25** 0.16± 0.26** -0.03± 0.24** -0.14± 0.22** -0.06± 0.24** 0.58± 0.25 ** p<0.01; *p<0.05. Differences from FIhlrOPT
3.4 Discussion
According to the previous study, CWT & Fmed showed the best fatigue estimation accuracy (Karlsson et al., 2000). In addition, FInsm5 (Dimitrov et al., 2006) showed the high-sensitivity and WIRE51 (Gonzalez-Izal et al., 2010b) showed the good correlation with power output and the robustness against noise. However, CWT & Fmed, FInsm5 and WIRE51 had the lower correlation with joint power than Fmed in this study. Some subjects showed the positive correlation with joint power but others the negative correlation. FIhlrOPT showed the best correlation (0.81 ±0.08 in RF, 0.58 ±0.25 in VM & VL) with joint power, as shown in the previous study (Kim et al., 2012). This suggested that FIhlrOPT had the best accuracy to estimate muscle fatigue during high-intensity exercises. Similar to the previous studies, Fmed did not show the significant differences between the first five repetitions for all sets. In this study, there were no significant differences in FInsm5 and WIRE51 for the first
-33-
five repetitions of every set. However, the first five repetitions of each set in FIhlrOPT differed significantly, which reflects the significant reduction of joint power. These findings also indicated that FIhlrOPT could assess muscle fatigue even in the less-fatigued state during multiple sets of dynamic fatigue exercises.
None of the EMG indices for VM and VL muscles, except for RMS and FIhlrOPT, were significantly different for every set. This indicates a relatively low-fatigue state. According to the previous study (Jacobs and van Ingen Schenau, 1992), mono-articular muscles rapidly lose their tension and decrease their activation in the quick movement of the limbs. In this study, subjects performed knee extensions as quickly as possible. Thus, VM and VL muscles, mono-articular muscles, would have been under submaximal exercises in this study.
The primary aim of this study was to determine the frequency bandwidth of new fatigue index (FIhlrOPT). The uniqueness of the present study was the optimization of cut-off frequency to overcome bandwidth selection problem in the previous studies. The shift in the power spectrum of EMG to lower frequencies was caused by the lengthening effect of MUAP (Bigland-Ritchie et al., 1981), decreased MFCV and the reduced activation of fast twitch muscle fibers (Komi and Tesch, 1979). The lengthening effect of MUAP was caused primarily by decreased MFCV (Dimitrova and Dimitrov, 2002). Masuda et al. (1999) reported that MFCV did not decrease during dynamic contractions. In addition, Mills (1982) showed that the compound muscle
-34-
action potential spectrum did not change beyond 200Hz during fatigue. Thus, the reduced activation of fast twitch muscle fibers was the main reason of decreased high-frequency components in fatigue state. The 200Hz low-pass filter cut-off frequency was selected to eliminate the effect of decreased high-frequency component by change of MUAPs shape. Low-pass-filtered EMG signals retained more than 95% of the power of raw EMG signals. High-pass-filtered EMG signals reflected the reduced activation of fast twitch muscle fibers because determined high-pass filter cut-off frequency was over 200Hz. In addition, 350 Hz high-pass filtered EMG signals retained less than 5% of the power of raw EMG singals.
The sEMG decomposition analysis can estimate the reduced activation of fast twitch muscle fiber in fatigue state. Some sEMG decomposition researches reported that the average motor unit firing rate was about 20 to 40Hz (26.4 ±7.6Hz (Roos et al., 1999), 32.1 ±10.7Hz (Bigland-Ritchie et al., 1992) and 41.9 ±8.2Hz (Connelly et al., 1999)). DeLuca and Hostage (2010) showed that the first dorsal interosseous, tibialis anterior and VL had about a 30Hz average firing rate and about 20 motor units in 100% MVC contraction. Stock et al. (2012) showed that VM and VL had about a 30Hz average firing rate and about 25 motor units. These results showed the similar firing rate and motor unit numbers in sEMG of different muscles. In a fatigued state, the average firing rate decreased from 30Hz to 25Hz (Stock et al., 2012), 30Hz to 22Hz (De Luca and Hostage, 2010) and 30Hz to 17Hz (DeLuca and Forrest, 1973). Based on these results, in the perfectly independent motor units, the
-35-
maximum feasible frequency of the MUAP train in a non-fatigued state is about 600Hz (30Hz × 20 motor units) and the maximum feasible frequency in a fatigued state is about 400Hz (20Hz × 20 motor units). Since there would be synchronized MUAP trains for each motor unit in the sEMG signal, the MUAP train has a lower frequency than the calculated. The maximum feasible frequency in a fatigued state was close to the optimized cut-off frequency calculated in this study (353.30Hz and 348.71Hz). The optimized cut-off frequencies of RF and vastus muscles were also similar to those from the previous study (353.30Hz, 348.71Hz, and 360Hz (Kim et al., 2012)). These results support the hypothesis that the optimized cut-off frequency appropriate for fatigue assessment.
A limitation of this study is that the proposed filter-based fatigue index, FIhlrOPT, was applied only to knee extensor muscles and did not take inter-electrode distance into account. The proposed filter-based fatigue index will be extended to various joint muscles and inter-electrode distances to determine general high-pass cut-off frequencies.
-36-
Chapter 4
4. Validation of the new filter-based fatigue index
4.1 Purpose
A filter-based fatigue index was proposed as ratios between high-frequency components and low-high-frequency components of EMG power (Kim et al., 2012). This technique has the same order of time resolution and required less computational load. However, there have been difficulties in selecting a bandwidth of the high- and low-frequency components of EMG power (Dimitrov and Dimitrova, 1998). To select a bandwidth, the cut-off frequencies of the high-pass-filter was optimized to maximize the correlation with peak power and proposed filter-based fatigue index (FIhlrOPT) during isotonic knee extension exercise. However, various types of muscles, different exercises, and different inter-electrode distances did not tested. It should be examined to determine the general bandwidth.
In this study, the filter-based fatigue index was validated through a comparison of the optimized cut-off frequencies in various muscles, using different inter-electrode distances and a variety of exercises. Hypothesis was that the optimized cut-off frequencies in various muscles and various
inter--37-
electrode distances during different exercises are consistent. The filter-based fatigue index was compared with the conventional median frequency, the spectral parameter proposed by Dimitrov (2006), and the wavelet index proposed by Gonzalez-Izal (2010b).
4.2 Experimental methods
4.2.1 Subjects
Sixty one healthy males with no history of upper or lower limb disorders participated in this study. They were categorized into three groups performing: (1) isotonic knee extension exercises (27 subjects, age: 26.4 ± 4.4 years, height: 171.4 ± 6.3 cm, weight: 76.5 ± 12.4 kg); (2) isokinetic knee extension and isotonic elbow flexion (14 subjects, age: 25.7 ± 3.2 years, height: 173.3 ± 5.3 cm, weight: 73.1 ±10.5 kg); and (3) isometric knee extension, isotonic elbow extension and isotonic ankle dorsiflexion (20 subjects, age: 22.3 ± 3.1 years, height: 171.9 ± 9.3 cm, weight: 84.3 ± 9.3 kg). Subjects were informed about the purpose of this study and the experimental procedure. Before the actual experiments, the subjects were required to practice three to four voluntary submaximal isometric and isotonic contractions to familiarize with the experiments. They provided written informed consent before participating in the study. The Yonsei University research ethics committee reviewed and approved the proposed experimental design (1041849-201405-BM-022-02).
-38-
4.2.2 Experimental ProceduresSubjects performed joint flexion/extension exercises within pre-determined range of motion (ROM) on an isokinetic dynamometer (Biodex System 3, Biodex Medical Systems, NY, USA). Six kinds of exercises were chosen to evaluate the filter-based fatigue index. In the isotonic exercises, each subject performed several maximal contractions to determine the 10 repetition maximum (10RM) load. The determined 10RM was used for the fatigue exercises. The experimental protocol consisted of five sets of 10 joint movements with 2-minute break. During fatigue exercises, the subjects were asked to perform joint movements with their own maximum efforts. Characteristic of the exercises were explained in Table 4.1.
-39-
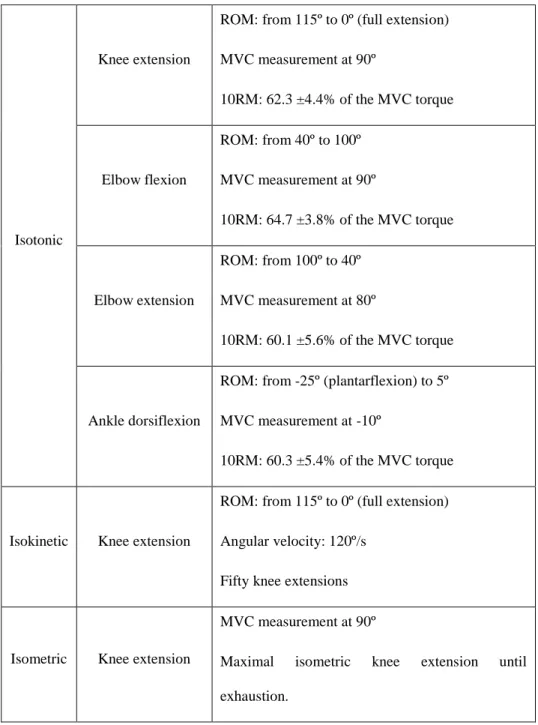
Table 4.1. Characteristic of six kinds of exercises
Isotonic
Knee extension
ROM: from 115º to 0º (full extension) MVC measurement at 90º 10RM: 62.3 ±4.4% of the MVC torque Elbow flexion ROM: from 40º to 100º MVC measurement at 90º 10RM: 64.7 ±3.8% of the MVC torque Elbow extension ROM: from 100º to 40º MVC measurement at 80º 10RM: 60.1 ±5.6% of the MVC torque Ankle dorsiflexion
ROM: from -25º (plantarflexion) to 5º MVC measurement at -10º
10RM: 60.3 ±5.4% of the MVC torque
Isokinetic Knee extension
ROM: from 115º to 0º (full extension) Angular velocity: 120º/s
Fifty knee extensions
Isometric Knee extension
MVC measurement at 90º
Maximal isometric knee extension until exhaustion.
-40-
4.2.3 Data AcquisitionA EMG measurement system (MyoSystem 1200, Noraxon Inc., AZ, USA) was used to measure EMG signals from the right rectus femoris (RF), vastus medialis (VM), vastus lateralis (VL), biceps brachii (BB), triceps brachii (TC) and tibialis anterior (TA) muscles during exercise. Joint angle, angular velocity and torque were acquired from the isokinetic dynamometer. These signals and EMG signals were simultaneously recorded at a sampling rate of 1 kHz.
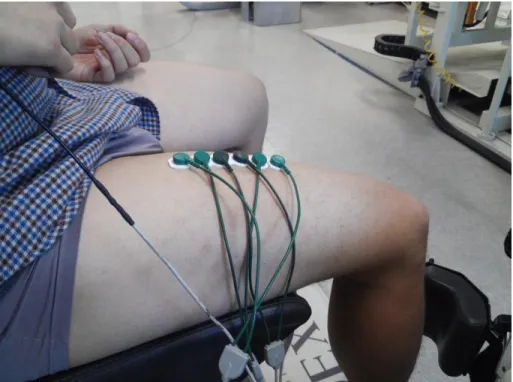
EMG signals were recorded by a standard bipolar surface electrode (14 mm in diameter, 18 mm inter-electrode distance; Noraxon, AZ, USA). The inter-electrode distance was set to 2cm, 6cm and 10 cm during isotonic elbow extension, isotonic ankle dorsiflexion and isometric knee extension (Fig. 4.1). After the careful skin preparation (shaving, abrasion and cleaning with alcohol), electrode pairs were placed longitudinally on the middle portion of the muscle, based on the Surface Electromyography for the Non-Invasive Assessment of Muscles (SENIAM) recommendations.
-41-
Fig. 4.1. Different inter-electrode distances (2cm, 6cm and 10cm)
2.4 Data analysis
Data analysis was performed using MATLAB R2010a (MathWorks Inc., Natick, MA, USA). In case of isotonic or isokinetic exercise, a segment was defined as one exercise repetition (i.e., one flexion and extension), and then all data were divided into 50 segments. The time-series data obtained during isometric exercise were equally divided into 50 segments. MVC torque was calculated as the mean value over a 1-s period with relatively torque-plateau levels of each MVC attempt. Peak power outputs of each segment were
-42-
calculated as the product of joint torque and angular velocity (isotonic and isokinetic exercises only).
Peak joint power output, mean root-mean-square (RMS), Fmed, FInsm5 and FIhlrOPT were calculated based on the chapter 3.
2.5 Statistical analysis
All variables (power output and EMG-based parameters) were normalized by the mean value of the first two segments. In cases where the percentage changes did not follow a normal distribution (FInsm5 and WIRE51), the corresponding variables were log-transformed. Pearson’s correlation was used to analyze the relationship between peak power (for isotonic and isokinetic exercises) or joint torque (for isometric exercises) and different EMG parameters. Differences between mean correlation coefficients for FIhrlOPT and other EMG indices were statistically determined by the unpaired t-test. One-way analysis of variance (ANOVA) was used to calculate any significant differences in the optimized cut-off frequencies in the optimized cut-off frequencies for the six different muscles, three different exercise methods and three different inter-electrode distances. Significant differences in the correlation coefficients for different inter-electrode distances were also calculated by ANOVA analysis. Tukey's studentized range test was performed to identify homogeneous subsets of means that are not different from each other.
-43-
4.3 Results
4.3.1 Bandwidth optimization in various muscles
Figure 4.2 shows the optimized cut-off frequencies for various muscles during isotonic exercises. The optimized cut-off frequencies for all muscles were identified as the same subset (p = .811). FIhlrOPT showed the significantly higher correlation with the mechanical power than the other fatigue indices in all muscles except FInsm5 for the TA (Table 4.2).
Fig. 4.2. Optimized cut-off frequencies for various muscles during isotonic exercises. Optimized cut-off frequencies were 353.3 ± 49.5 Hz in RF muscle, 343.9 ±34.2 Hz in VM muscle, 353.7 ±36.1 Hz in VL muscle, 362.3 ±28.2 Hz in BB muscle, 357.5 ±46.0 Hz in TC muscle, and 348.1 ±38.2 Hz in TA muscle.
-44-
Table 4.2. Correlation coefficients between EMG parameters and peak power
output in various muscles
RMS Fmed FInsm5 WIRE51 FIhlrOPT RF -0.10 ±0.34* 0.60 ±0.17* -0.38 ±0.21* -0.50 ±0.22* 0.81 ±0.08 VM -0.23 ±0.25* 0.08 ±0.23* -0.07 ±0.22* -0.02 ±0.25* 0.48 ±0.25 VL -0.22 ±0.22* 0.17 ±0.28* -0.20 ±0.25* -0.07 ±0.23* 0.52 ±0.24 BB -0.14 ±0.37* 0.48 ±0.12* -0.56 ±0.13* -0.36 ±0.19* 0.72 ±0.08 TC -0.06 ±0.54* 0.58 ±0.13* -0.52 ±0.25* -0.55 ±0.07* 0.71 ±0.12 TA -0.48 ±0.19* 0.43 ±0.21* -0.54 ±0.18 -0.29 ±0.24* 0.58 ±0.13 *p<0.05. Differences from FIhlrOPT
4.3.2 Bandwidth optimization during different exercises
Figure 4.3 shows the optimized cut-off frequencies for different exercises (isotonic, isokinetic and isometric) in the RF muscle. The optimized cut-off frequencies for all exercises were classified into the same group (p = .962). In all exercises, FIhlrOPT showed significantly higher correlation with biomechanical fatigue (peak power output or joint torque) than other fatigue indices (Table 4.3).
-45-
Fig. 4.3. Optimized cut-off frequencies for different exercises in the rectus femoris (RF) muscle. Optimized cut-off frequencies were 353.3 ± 49.5 Hz in isotonic exercise, 354.0 ±46.3 Hz in isokinetic exercise, and 357.4 ±45.4 Hz in isometric exercise.
Table 4.3. Correlation coefficients between EMG parameters and peak power
output or joint torque for isotonic, isokinetic and isometric exercises
RMS Fmed FInsm5 WIRE51 FIhlrOPT Isotonic -0.10 ±0.34* 0.60 ±0.17* -0.38 ±0.21* -0.50 ±0.22* 0.81 ±0.08 Isokinetic 0.08 ±0.51* 0.77 ±0.15* -0.64 ±0.26* -0.67 ±0.12* 0.88 ±0.08 Isometric 0.70 ±0.34* 0.79 ±0.10* -0.68 ±0.09* -0.75 ±0.09* 0.92 ±0.05 *p<0.05. Differences from FIhlrOPT
-46-
4.3.3 Bandwidth optimization at various inter-electrode distances Table 4.4 shows the optimized cut-off frequencies of various inter-electrode distances during isotonic ankle dorsiflexion, isotonic elbow extension, and isometric knee extension. The optimized cut-off frequencies for all muscles and all inter-electrodes were identified as the same group (p = .969). Table 4.5 shows the correlation coefficients between FIhlrOPT and biomechanical fatigue at different inter-electrode distances. Correlation coefficients for the same muscles were classified as the same subset (p = .823 for TC, p = .998 for TA and p = 1.00 for RF).
-47-
Table 4.4. Optimized cut-off frequencies and correlation coefficients between FIhlrOPT and the peak power output or joint torque in various inter-electrode distances Inter-electrode distance (cm) Optimized cut-off frequency (Hz) Correlation coefficient TC 2 357.5 ± 46.0 0.71 ± 0.12 6 351.4 ± 65.4 0.69 ± 0.14 10 357.6 ± 54.6 0.75 ± 0.08 TA 2 355.3 ± 51.3 0.58 ± 0.13 6 348.1 ± 38.2 0.58 ± 0.16 10 345.1 ± 44.7 0.60 ± 0.12 RF (isometric) 2 357.4 ± 45.4 0.92 ± 0.05 6 361.4 ± 61.2 0.92 ± 0.04 10 363.9 ± 61.7 0.92 ± 0.05
-48-
Table 4.5. Correlation coefficients between FIhlrOPT and peak power output or joint torque at various inter-electrode distances
Inter-electrode distance Correlation coefficient
TC 2cm 0.71 ±0.12 6cm 0.69 ±0.14 10cm 0.75 ±0.08 TA 2cm 0.58 ±0.13 6cm 0.58 ±0.16 10cm 0.60 ±0.12 RF (isometric) 2cm 0.92 ±0.05 6cm 0.92 ±0.04 10cm 0.92 ±0.05
4.4 Discussion
The hypothesis of this study was that the optimized cut-off frequencies would be the same for different muscles, different exercises or different inter-electrode distances. RF and BB are multi-articular muscles, while VM, VL, TC and TA are mono-articular muscles. In addition, the composition ratios of slow- to fast-twitch fibers were different. The average fiber type distribution is 52% type I and 48% type II in RF muscle (Scelsi, 2001), 59% type I and 41% type II in VM muscle (Travnik et al., 1995), 52% type I and 48% type II in VL muscle (Schantz et al., 1983), 42% type I and 58% type II in BB muscle (Kukulka and Clamann, 1981), 43% type I and 57% type II in TC muscle