저작자표시-비영리-변경금지 2.0 대한민국 이용자는 아래의 조건을 따르는 경우에 한하여 자유롭게 l 이 저작물을 복제, 배포, 전송, 전시, 공연 및 방송할 수 있습니다. 다음과 같은 조건을 따라야 합니다: l 귀하는, 이 저작물의 재이용이나 배포의 경우, 이 저작물에 적용된 이용허락조건 을 명확하게 나타내어야 합니다. l 저작권자로부터 별도의 허가를 받으면 이러한 조건들은 적용되지 않습니다. 저작권법에 따른 이용자의 권리는 위의 내용에 의하여 영향을 받지 않습니다. 이것은 이용허락규약(Legal Code)을 이해하기 쉽게 요약한 것입니다. Disclaimer 저작자표시. 귀하는 원저작자를 표시하여야 합니다. 비영리. 귀하는 이 저작물을 영리 목적으로 이용할 수 없습니다. 변경금지. 귀하는 이 저작물을 개작, 변형 또는 가공할 수 없습니다.
Doctoral Thesis in Healthy Aging
Association of vascular risk and
frailty with cognitive function in older
adults: Interaction effect of social
contact
Ajou University Graduate School
Medical Science of Heathy Aging Major
Association of vascular risk and
frailty with cognitive function in older
adults: Interaction effect of social
contact
Yunhwan Lee, Advisor
I submit this thesis as the Doctoral thesis in Healthy Aging
August 2019
Ajou University Graduate School
Medical Science of Healthy Aging Major
I
Abstract
Aging population is noticeable in countries around the globe and Korea is a country with especially rapid rate of population aging. Notably, various problems need careful attention in regards to aging, because a number of problems co-occur as an individual ages. Vascular risks, frailty and cognitive decline are a few of the major problems that is being researched in regards to the elderly population. All three health states are known to worsen as a person ages, and furthermore, a number of studies have found that they are related to one another. Additionally, previous studies have shown possibilities of preventing and ameliorating each of the three conditions, thus increasing the importance of studying these issues more carefully. One way that could possibly assist in this regard is the idea of contacting acquaintances more frequently. Because the benefits of social contact in terms of health have been shown through numerous studies, this study aimed to research its benefits as well. Our aims of the study were to study the associations between vascular risks, frailty and cognitive function, and further elucidate the possibility of interaction effect of an individual’s social relationships. Using the data from the Korean Frailty and Aging Cohort Study (KFACS), we analyzed associations between each of the variables of interest. Our results indicated a strong association between frailty and cognitive function, but vascular risks were not as strongly associated. Also, even though infrequent social contact was shown to relate to poor cognitive function, this was only true in some cases. Finally, we tried to study the interaction effects of social contact by including interaction terms in our
II
analyses, but only a few interaction terms remained statistically significant. Although not conclusive, this study does provide valuable insights for future studies, and implementing those findings in future studies could greatly improve the health of elderly population in Korea.
III
<List of Text>
I.
Introduction 1
A. Background 1
B. Purpose 4
C. Theoretical review 6
i. Framingham Cardiovascular Risk Score 6 ii. Frailty 7
1. CHS Frailty index 9 iii. Social Network 11
1. Main-effect model 13 2. Buffering model 14 iv. Cognitive Function 15
1. Perceptual speed 15 2. Memory 16 A. Episodic memory 16 B. Working memory 16 3. Frontal lobe 17 v. Summary 17 II.
Methods 19
A. Study sample & Design 19
B. Inclusion & Exclusion Criteria 19
C. Independent Variables 21
IV
ii. Frailty Status 22
iii. Social Contact Frequency 24
D. Dependent Variables 24
i. Episodic memory 25 ii. Perceptual speed 25 iii. Working memory 25 iv. Frontal lobe function 25
v. Global cognition 25
E. Control Variables 26
F. Statistical Analysis 27
G. Sensitivity Analysis 30
III. Results 32
A. Baseline Characteristics 32
i. FRS 34 ii. Frailty 35iii. Social Contact 39
1. Contact with friends 39 2. Contact with family 39 3. Contact with neighbors 40
B. Global Cognition 44
i. Unadjusted analysis 44 ii. Adjusted analysis 46
V
iv. Interaction effect 48
C. Cognitive Function 53
i. Unadjusted linear regression for each cognitive function 53 ii. Adjusted linear regression for each cognitive function 56 iii. Regression equation for episodic memory 58
iv. Regression equation for perceptual speed 59 v. Regression equation for working memory 60 vi. Regression equation for Frontal lobe function 61 vii. Interaction effect 62
IV. Discussion 69
V. References 78
VI. Korean Abstract 86
VII. Supplements 87
VI
<List of Figures>
Figure 1. Overall model of the study 5
Figure 2. Frailty cycle proposed by Linda Fried and colleagues 9 Figure 3. Diagram of participant inclusion/exclusion 20
Figure 4. Interaction between FRS and contact frequency 28 Figure 5. Interaction between frailty and contact frequency 29 Figure 6. Interaction between FRS and frailty 30
Figure 7. Regression lines depending on contact frequency with friends 52
Figure 8. Regression coefficients of the association between Frailty and each cognitive function 62
VII
<List of Tables>
Table 1. General distribution of all variables 33 Table 2. General characteristics in terms of FRS 37
Table 3. General characteristics in terms of Frailty status 38
Table 4. Baseline characteristics based on contact frequency with friends 41 Table 5. Baseline characteristics based on contact frequency with family members 42
Table 6. Baseline characteristics based on contact frequency with neighbors 43
Table 7. Unadjusted linear regression in terms of Global cognition 45 Table 7. cont. 46
Table 8. Adjusted linear regression in terms of Global cognition 47 Table 9. Adjusted linear regression including the interaction terms 50 Table 9. cont. 51
Table 10. Analysis of the interaction effect using GLM 52
Table 11. Differences in slope depending on contact frequency with friends 52 Table 12. Unadjusted linear regression as each cognitive function as outcome 54
Table 12. cont. 55
Table 13. Adjusted linear regression as each cognitive function as outcome 57 Table 14. Comparison of the regression coefficients of the association between Frailty and each cognitive function 62
Table 15. Adjusted analysis with interaction terms in regards to Episodic memory 64
Table 16. Adjusted analysis with interaction terms in regards to Perceptual speed 65
VIII
Table 18. Differences in slope depending on Frailty 66
Table 19. Adjusted analysis with interaction terms in regards to Working memory 67
Table 20. Adjusted analysis with interaction terms in regards to Frontal lobe function 68
1
I. Introduction
A. Background
Around the globe, there have been substantial increase in life expectancy in OECD countries, and among them, Korea has exhibited one of the fastest growth of 20 years from 1970 to 2015 (OECD, 2017). With the rapid aging and low birth rate, elderly population aged 65 years and older in Korea has reached 13.94% in 2017 (Korea, 2017) and naturally, the problems that co-occur with the growing elderly population is of much concern. Deteriorating health status is a common characteristic in the elderly population, and an emphasis on elderly health is spreading throughout numerous studies in Korea. Some of the major issues are vascular risks (Heidenreich et al., 2011; North and Sinclair, 2012), frailty (Tarazona-Santabalbina et al., 2016) and cognitive decline (Hultsch et al., 1993; Tabbarah et al., 2002). These health issues are important, because not only can they lead to adverse outcomes such as mortality, but they are also modifiable as well as reversible. Knowing the possibility of both spectrums, researchers try to understand the underlying mechanisms as well as the relationship between these conditions.
Vascular risks, which relate to factors such as an individual’s blood pressure, smoking habits, total cholesterol and HDL cholesterol, have shown associations with depression (Kivimäki et al., 2012), and mortality (Pflederer et al., 2016). Vascular risk is an important issue to consider in the elderly
2
population because it is known to worsen with increasing age (Heidenreich et al., 2011), and has shown to be modifiable through lifestyle changes in previous studies (Santos-Parker et al., 2014; Ngandu et al., 2015). The possibility of vascular risk modification is important, not only for the purpose of improving vascular health, but also for the sake of reducing the risk of other adverse outcomes, such as cognitive decline. For example, Villeneuve and colleagues (Villeneuve et al., 2009) found an association between vascular risks and executive impairment, and Kaffashian and colleagues (Kaffashian et al., 2011) found an association between vascular risk and cognitive decline, but only in men. Considering these similar, but discrepant findings, researching the relationship between vascular risks and cognition further seems plausible. Also, studying other health conditions related to cognition would bring forth valuable insights concerning the elderly population.
Frailty, which is often defined as a decline in physical reserve and increase in vulnerability to environmental stressors (Campbell and Buchner, 1997; Hamerman, 1999), is being increasingly researched in terms of elderly health (Fried et al., 2001) as well as in association with cognitive function (Aguilar-Navarro et al., 2016). Physical frailty and cognitive decline are often considered as a co-occurring phenomenon with a term “cognitive frailty” (Kelaiditi et al., 2013), but a directional relationship between the two conditions are being studied as well. For instance, compared to non-frail elders, frail elders were more likely to experience incident dementia (Rogers et al., 2017), and cognitive impairment (Fougère et al., 2017). Notably, cognitive functions affected by frailty are similar to those affected by
3
vascular risks (Langlois et al., 2012). This is an interesting implication, because even though vascular risks and frailty are measured differently, they could share similar physical pathways leading to the decline in same cognitive functions. Also, as vascular risks were shown to be modifiable, the possibility of frailty prevention and reversal was found in previous studies (Chan et al., 2012; Tarazona-Santabalbina et al., 2016). With the evidence to potentially ameliorate vascular risks and frailty, and considering previous findings linking vascular risks and frailty to cognitive function, additional research related to these three factors could significantly enhance the health of the elderly.
Between these three health states, a possible interacting factor exists, which is an individual’s social network. Social network is being increasingly researched in relation to people’s health, and was found to be associated with depression (Roh et al., 2015), mortality (Kim et al., 2016), vascular health (Cohen, 1988), frailty (Woo et al., 2005), and cognitive function (Fratiglioni et al., 2004). However, social network is easy to conceptualize, but difficult to contextualize, making it challenging to clearly classify an individual’s level of social network. In past studies, researchers have used social support (Woo et al., 2005), social engagement (Bassuk et al., 1999), or social integration (Fratiglioni et al., 2004), which can all be related to a person’s social network. Although it is difficult to agree upon a single social network index, social contact appears across various definitions, and this construct is easier to operationalize. In terms of social contact, two things could be considered: the people (e.g. relatives, friends, or neighbors) and the frequency. If a person’s social contact can indeed be used as an indicator of a person’s social
4
network, then good social contact will have beneficial effects in terms of people’s health. Considering previous studies, it is important to study the role of vascular risk and frailty in terms of cognitive function, as well as the possible interaction effect of social contact.
B. Purpose
The purpose of this study was to find the relationship between vascular risk, frailty and cognitive function. The moderating effect of social contact will also be assessed.
Hypothesis 1: Vascular risk will affect various cognitive functions differently
Hypothesis 2: Frailty will affect various cognitive functions differently
Hypothesis 3: Different social contact types will affect cognitive functions differently
Hypothesis 4: Social contact frequency will have an interaction effect with vascular risk in terms of cognitive function
Hypothesis 5: Social contact frequency will have an interaction effect with frailty in terms of cognitive function
Hypothesis 6: The relationship between vascular risk and cognitive function will differ between frail and non-frail elders
5
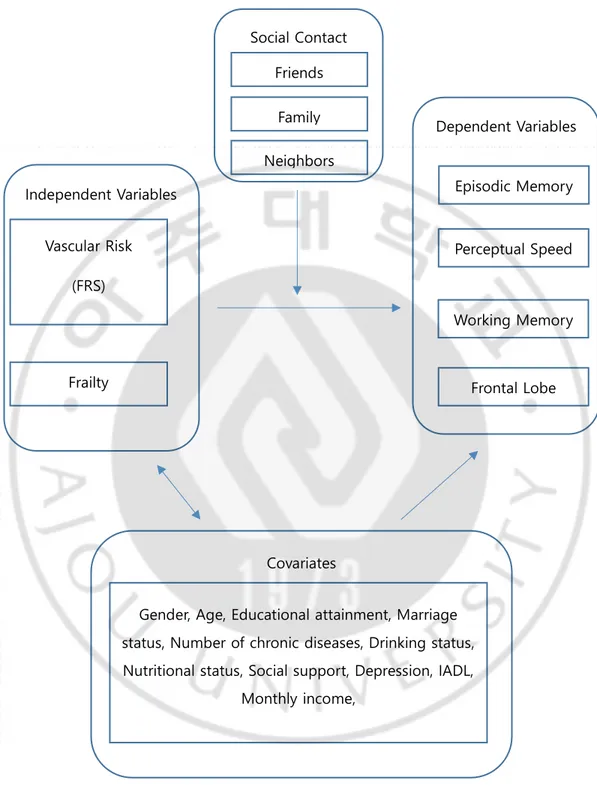
Figure 1. Overall model of the study
Vascular Risk (FRS) Frailty Episodic Memory Perceptual Speed Working Memory Frontal Lobe Dependent Variables Friends Family Neighbors Social Contact Independent Variables
Gender, Age, Educational attainment, Marriage status, Number of chronic diseases, Drinking status, Nutritional status, Social support, Depression, IADL,
Monthly income, Covariates
6
C. Theoretical Review
Framingham Cardiovascular Risk Score
Cardiovascular disease is one of the leading causes of deaths worldwide, and it is especially prevalent in the elderly population (Organization, 2015). Studies regarding the risk factors and preventive methods of cardiovascular disease has increased significantly in the past few decades, and the Framingham Heart Study is one of the predecessors in this line of research (Mahmood et al., 2014). This study began with the death of former United States’ President Roosevelt, who died due to poorly controlled blood pressure. At the time, the risk factors, symptoms, and the danger of the illness were poorly understood, so the doctors could not do much to alleviate the symptoms. However, learning the seriousness of this condition from President Roosevelt’s death, researchers began to design a cohort study. The study was conducted in Framingham, Massachusetts, hence the name Framingham Heart Study. Through decades, researchers have used the data from the study to develop an equation to calculate the cardiovascular risk, and the most recent version of the risk score is composed of age, LDL-cholesterol, HDL-LDL-cholesterol, blood pressure, diabetes, smoking status, and is the most widely used cardiovascular risk score worldwide (Wilson et al., 1998).
Despite its popularity, the original Framingham Heart Score should be used with caution, because the score was generated based on a
middle-7
class population in a specific area. This limits the generalizability of the score, and previous studies have shown overestimation in populations outside of the United States (Pinsky et al., 1985; Liu et al., 2004; Vergnaud et al., 2008; Empana et al., 2011). This overestimation was also apparent in Korea (Ahn et al., 2006), presenting a necessity to adjust the risk score to be used for the Korean population. In order to adjust the Framingham Heart Score for the Korean population, Jee and colleagues (Jee et al., 2014) used the data from the Korean Heart Study and the original Framingham Heart Score. In this study, several models were tested to determine the risk factors enabling acquisition of the most appropriate cardiovascular risk score. In the mid-20th
century, people were not able to save a person dying from a vascular problem, but being able to calculate an individual’s vascular risk score as precisely as possible informs us about the severity of the condition, and allows us to further act on the problem. Furthermore, as important as it is to control for vascular risks itself, other adverse outcomes, stemming from vascular risks, need to be considered.
Frailty
Frailty is an important public health issue in the aging society around the world, and this has been defined as increased vulnerability to stressors, which lead to higher risk of negative health outcomes (Morley et al., 2013). Frailty is a relatively new concept, and because it could be difficult to consider it as a distinct condition, it is important not to confuse frailty with
8
vulnerability or disability. In order to clarify frailty, Rodriguez-Mañas et al. (Rodríguez-Mañas et al., 2012) conducted a Delphi survey to gather expert consensus, and ascertained that frailty is a distinct syndrome differing from vulnerability or disability.
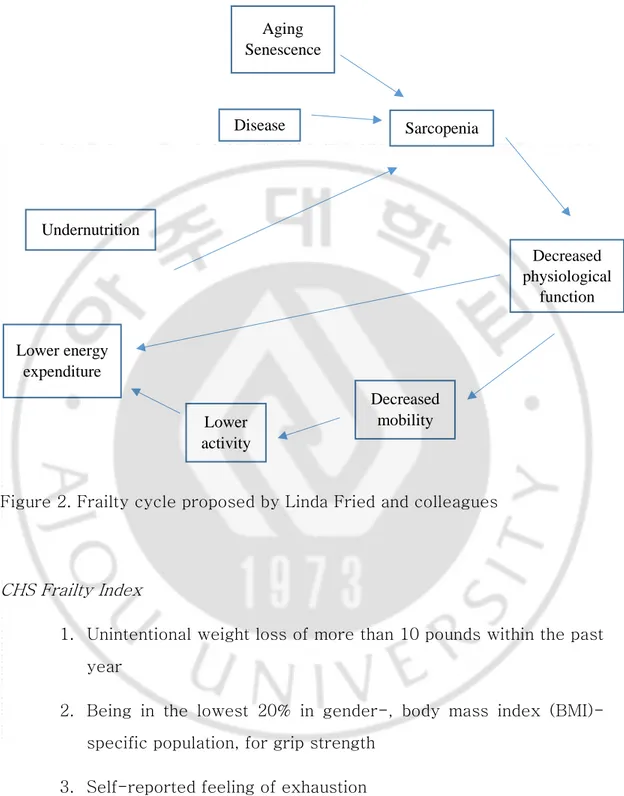
Currently, most widely used frailty index was proposed by Fried et al. from the Cardiovascular Health Study (CHS) and is composed of weight loss, weakness, exhaustion, slowness and low activity (Fried et al., 2001). In their study, they emphasized the importance of including diminished physiological system in the definition of frailty. Figure 2, proposed by Linda Fried and her colleagues (Fried et al., 2001), presents a physiological cycle involved in frailty. Considering the physiology involved in frailty, and previous studies emphasizing the importance of activity and nutrition (Campbell and Buchner, 1997; Paw et al., 1999), CHS frailty index was established.
9
Figure 2. Frailty cycle proposed by Linda Fried and colleagues
CHS Frailty Index
1. Unintentional weight loss of more than 10 pounds within the past year
2. Being in the lowest 20% in gender-, body mass index (BMI)-specific population, for grip strength
3. Self-reported feeling of exhaustion
Disease Sarcopenia Decreased physiological function Decreased mobility Lower activity Lower energy expenditure Aging Senescence Undernutrition
10
4. Being in the lowest 20% in gender-, height-specific population, for walking speed
5. Being in the lowest 20% in gender-specific population, for the amount of activity
Of these 5 criteria, scoring 0 meant robust, 1-2 meaning pre-frail, and 3 or more meaning frail.
Frailty was also shown to be associated with cognition via a systematic review (Panza et al., 2015b), and the findings from a number of studies suggested an association between frailty and vascular dementia (VaD) (Avila‐Funes et al., 2012; Gray et al., 2013; Solfrizzi et al., 2013), which could be an indication to the possibility that frailty influences specific cognitive functions more than others. For example, in a study by Langlois et al. (Langlois et al., 2012), frailty was associated with low executive functions and processing speed, but not with memory and verbal reasoning. Notably, these are the cognitive functions often associated with vascular risks, and in the past, studies have found associations between vascular risk and frailty (Afilalo et al., 2009), as well as dementia (O Akinyemi et al., 2013).
Social relationship is also important in terms of a person’s health, and in a study by Strawbridge et al. (Strawbridge et al., 1998), socially isolated individuals were more likely to be frail compared to individuals with better social ties. Overall, frailty is an important health status to consider in the elderly population, and it has been shown to be associated with vascular risk, cognitive function, as well as social relationship.
11
Social Network
Since the late 1900’s, studies regarding social network and health outcomes have been conducted (Cohen, 1988; Berkman, 1995). Social network is a psychological concept, and in the past, there were questions to whether or not it was adequate to be included in epidemiological studies. However, throughout the past few decades, it has shown strong associations with various health outcomes (Berkman and Syme, 1979), providing support to the importance of social network in regards to health. In a more psychological point of view, social network can be traced back to attachment, which is known to formulate in infants or toddlers, and a secure attachment could assist in achieving homeostasis (Bowlby, 2008). The attachment theory posits at a human nature, which require connectedness with others. What begins as an attachment to one’s guardian develops through life and changes as an individual ages. This change leads to the differences in social circles between different age cohorts, which usually tend to diminish in the elderly population due to factors such as poor health, inadequate resources, or death of the people around them (Arling, 1976). Furthermore, when considering social network in terms of a person’s health, it needs to be considered as a multi-level concept.
Social network, proposed by Berkman and colleagues (Berkman et al., 2000), can be divided into 4 levels (e.g., macro, mezzo, micro, pathways). This model is insightful for those researching social network, because it presents a detailed information about the factors, which could affect an individual’s social network, at different levels. At the macro level, there are
12
environmental factors (e.g., culture, socioeconomic factors, or politics) affecting a person’s social network (e.g., structure and characteristics), which is then perceived as support, influence or engagement, and finally influences the pathways (e.g., health behavioral, psychological, or physiological) leading to health outcomes. As important as it is to consider each level in order to understand the mechanisms involved in the relationship between social network and health, this paper will focus on the bottom three levels, because the factors at the macro level are not likely to change.
Factors at the mezzo and micro levels are often used interchangeably. For example, previous studies have used terms such as social engagement, which included people's social relationships as well as participation in social activities (Bassuk et al., 1999), social integration (Fratiglioni et al., 2004), and social support (Woo et al., 2005). Different terms were used, but they were all trying to capture the concept of an individual’s social network. Also, because the terms could be distinguished at different levels, it is important to clearly define the flow of mechanisms from the mezzo to the pathways level of social network. In this regard, the social network structure could be simplified into a person’s social network structure, support provided through this network structure, and how that support ultimately influences health outcomes.
A good way to measure a person’s social network at the mezzo level is to consider his/her contact frequency with others. Measuring a person’s social contact is much easier than operationalizing social network, and contact frequency has been shown to be beneficial in terms of health outcomes (Chon et al., 2018). In this study, the target as well as the
13
frequency of contact was important, and although the results of the study do not provide clear causal association between social contact and health, due to its cross-sectional nature, the possibility that support acquired from different targets of contact could be considered. Support received from contact with others can be considered in terms of two models (e.g., main-effect model, buffering model) (Cohen and Wills, 1985).
Main-effect model
According to the main-effect model, social support helps people to feel more secure, and gain a sense of belonging as well as social roles (Cohen and Wills, 1985). Furthermore, the beneficial effects of social support in terms of the main-effect model have been explained with changes in the immune system, which could be affected by emotional variability (Jemmott and Locke, 1984), as well as through positive behavioral change, which could be acquired through an individual’s peers (Krantz et al., 1985).
14 Buffering model
The buffering model proposes that social support mediates the relationship between stress and adverse health outcomes (Cohen and Wills, 1985). This is important, because stress perceived by an individual tends to exacerbate when he/she does not have the ability to properly cope with that stressor, and according to the buffering hypothesis, social support can help people to better cope with stressors (Cohen and Wills, 1985). Furthermore, previous studies have found that social contact was associated with strengthened resistance to stressors, resulting in positive health outcomes (Berkman and Syme, 1979).
Social support is thought to be an important part in this mechanism (Berkman et al., 2000). Likewise, although social contact itself has been found as a useful contextualization of an individual’s social network, how that relationship is perceived needs to be understood to better describe the association between social contact and health outcomes. Previous studies have found beneficial effects of social support through both the main-effect (Miyazaki et al., 2003) and the buffering models (Cohen and Wills, 1985). Therefore, in order to fully understand the relationship between social network and health outcomes, a clear operationalization of the most psychological aspect of an individual is necessary.
15
Cognitive Function
Cognitive function is known to worsen as people age. However, it is important to note that as some cognitive functions decline with age, some functions remain steady, or even improve with aging. An example of cognitive function that is known to remain steady or in some cases even improve include a person’s vocabulary, which tend to improve as a person ages and learns and stores more information. However, reasoning, memory, and processing speed are known to decline with age, and the decline in these abilities differs between persons (Wisdom et al., 2012). These cognitive functions can also be considered in terms of fluid intelligence or crystallized intelligence. Fluid intelligence refers to the ability to solve novel problems and similar to its name, it is an ability for a person to be flexible in different situations. Crystallized intelligence on the other hand relates to the information and ability acquired and embedded in a person’s cognitive system. (McGrew, 2009). In general, fluid intelligence is known to decline with aging, whereas crystallized intelligence remains intact. Furthermore, the cognitive functions associated with fluid intelligence are perceptual speed, attention, memory, and executive function (Harada et al., 2013).
Perceptual speed
16
simple tasks with the information gathered through visual stimulus (Ekstrom et al., 1976). This function is well-known to debilitate as a person ages, and in part it is due to the fact that older people find it more difficult to focus on a task with distractions (Salthouse et al., 1995).
Memory
a. Episodic memory:
This memory function refers specifically to a type of memory that relates to the context in which the information was acquired, and is known to be influenced by neuronal dysfunctions more than other types of memory (Tulving, 2002). Decline in function of this memory type is notable in Alzheimer’s disease (AD) (Karantzoulis et al., 2011).
b. Working memory:
This memory type refers to a temporary memory system, and a person’s ability to manipulate that information (Rossi-Arnaud et al., 2012). It is important to distinguish this type of memory from short term memory (STM)
17 Frontal Lobe
Cognitive functions associated with the frontal lobe region of the brain include attention and executive function (Chayer and Freedman, 2001). Frontal lobe has also shown to be related to an individual’s personality, and an interesting case study reported a person, whose personality changed dramatically after a brain injury in the frontal lobe, but no other cognitive impairments were present (Damasio et al., 1994).
These cognitive functions are part of the fluid intelligence, and it is susceptible to change. Aging is a well-known risk factor of cognitive decline, but there are other known risk factors as well, so it is important to research these risk factors further and find possible ameliorating factors. The notion of cognitive reserve has been proposed as a resilience in our brain to buffer against clinical expression of cognitive decline even in the presence of pathological damage (Stern, 2002).
Summary
Vascular risk, frailty and impaired cognitive function are all important health related concerns in the elderly population. Also, a number of previous studies have reported associations between these three factors, and it is important to study more detailed mechanisms involved within these
18
19
II. Methods
Study sample & design
Data were obtained from the Korean Frailty and Aging Cohort Study (KFACS), which gathered its baseline data in 2016 and 2017. Briefly, KFACS conducted a multi-center based sampling in 10 centers in rural and urban regions across Korea. More detailed description is provided in a previous study (Won et al., 2016). The sample consisted of people aged 70-84 years old, selected based on age- and gender-specific strata. An in-person interview and health examinations were performed. All participants provided informed consents. The study was approved by institutional review boards of the participating centers.
Inclusion & Exclusion Criteria
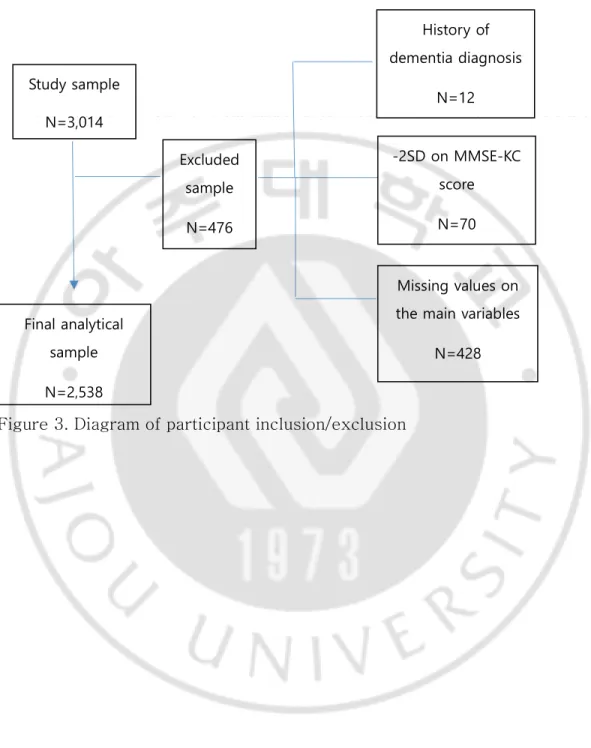
Participants of KFACS were included in the study. Of the 3,014 baseline cohort, those who reported “yes” to being diagnosed to dementia or scored 2 standard deviations below the mean MMSE-KC score, adjusted for age, education, and gender, were excluded from the study. These participants were excluded, because their cognitive functions could be too impaired, which could lead to biased results. Participants with missing values on the main variables of interest were also excluded from the study. In the final analysis, 2,538 participants remained (Figure 3).
20
Figure 3. Diagram of participant inclusion/exclusion
Study sample N=3,014 Excluded sample N=476 History of dementia diagnosis N=12 -2SD on MMSE-KC score N=70 Missing values on the main variables
N=428 Final analytical
sample N=2,538
21 Independent variables
The independent variables were the frailty status, Framingham Risk Score (FRS) and social contact frequency.
FRAMINGHAM RISK SCORE (FRS)
Korean version of the Framingham Risk Score, developed by Jee et al. (Jee et al., 2014), was used. The variables used in the equation were as follows: AGE=age, AGESQ=square of age, HTN2= 120≤sbp<140 or 80≤dbp<90, HTN3=140≤sbp<160 or 90≤dbp<100, HTN4=160≤sbp or 100≤dbp, TC2=160≤Total cholesterol (in mg/dl)<200, TC3=200≤Total cholesterol (in mg/dl)<240, TC4=240≤Total cholesterol (in mg/dl)<280, TC5=280≤Total cholesterol (in mg/dl), HDL2=35≤HDL-cholesterol (in mg/dl)<45, HDL3=45≤HDL-cholesterol (in mg/dl)<50, HDL4=50≤HDL-cholesterol (in mg/dl)<60, HDL5=60≤HDL-cholesterol (in mg/dl), EXSMOK=ex-smoker, CUSMOK=current smoker, DM=diabetes.
Male: FRS=0.13759*(AGE-45.7991)-0.0006964*(AGESQ- 2186.58)+0.24130*(HTN2-0.40678)+0.54176*(HTN3- 0.18005)+0.79091*(HTN4-0.06823)+0.30303*(TC2- 0.43540)+0.72508*(TC3-0.31439)+1.02770*(TC4- 0.08486)+1.51018*(TC5-0.01387)-0.41580*(HDL2-0.31063)- 0.59809*(HDL3-0.22692)-0.80256*(HDL4-0.27050)-1.13973*(HDL5-
0.11410)-0.00207*(EXSMOK-0.23029)+0.60138*(CUSMOK-22 0.53016)+0.49443*(DM-0.08389) Female: FRS=0.12962*(AGE-47.5808)-0.0003965*(AGESQ- 2363.65)+0.41491*(HTN2-0.32308)+0.66187*(HTN3- 0.14102)+1.10282*(HTN4-0.06657)+0.20005*(TC2- 0.41642)+0.44176*(TC3-0.29841)+0.52267*(TC4- 0.09640)+1.03573*(TC5-0.02196)-0.28121*(HDL2-0.18651)- 0.18543*(HDL3-0.16015)-0.47018*(HDL4-0.30597)-0.72046*(HDL5-0.31451)+0.23099*(EXSMOK-0.03970)+0.67653*(CUSMOK-0.05079) +0.58729*(DM-0.06026)
The calculated FRS was used as a continuous variable.
FRAILTY STATUS
The dependent variable of the study was frailty status categorized by Fried’s criteria (Fried et al., 2001). There are 5 categories in Fried’s CHS index: weight loss, weakness, exhaustion, slowness and low activity.
Weight loss: Based on the question “Have you experienced an unintentional weight loss of 4.5kg or more in the last year?”. A response of “yes” was scored as 1, and “no” was scored as 0.
23
Male: 0≤BMI≤22.0 and 0≤Grip strength≤25.0, 22.0<BMI≤24.0 and 0≤Grip strength≤27.0, 24.0<BMI≤26.0 and 0≤Grip strength≤27.8, or 26.0<BMI and 0≤Grip strength≤28.5 were scored as 1, otherwise 0.
Female: 0≤BMI≤23.0 and 0≤Grip strength≤16.8, 23.0<BMI≤25.0 and 0≤Grip strength≤17.7, 25.0<BMI≤27.0 and 0≤Grip strength≤17.8, or 27.0<BMI and 0≤Grip strength≤17.7 were scored as 1, otherwise 0.
Exhaustion: Based on the questions “Everything felt difficult for the last week”, and “I could not get myself to do anything for the last week”. If participants answered “3 to 4 days in the last week” or “5 or more days in the last week”, they scored 1, otherwise 0.
Slowness: Based on 4-meter walking test. Speed was measured in m/s, and adjusted for gender and height.
Male: Height≤165 and 0≤Walking speed≤.93, or 165<Height and 0≤Walking speed≤.98 were scored as 1, otherwise 0.
Female: Height≤152 and 0≤Walking speed≤.85, or 152<Height and 0≤Walking speed≤.93 were scored as 1, otherwise 0.
Low activity: The amount of low intensity, moderate intensity, and high intensity daily activities were measured in minutes through survey questions. Once the minutes were determined, the following equation was used to calculate the amount of activity of participants. ((Low intensity
24
activity (in minutes)/60*3)+(Moderate intensity activity (in minutes)/60*4.5)+(High intensity activity (in minutes)/60*6))*1.05*weight=Activity in kcal. If male activity amount ranged 0≤Activity<495.65 or female activity ranged 0≤Activity<283.50 then they scored 1, otherwise 0.
Presence of 0 component was considered Non-frail, 1-2 components Pre-frail, and 3 or more components Frail.
SOCIAL CONTACT FREQUENCY
There were three types of social contact (e.g., family, friend, or neighbors). Social contact frequency was based on the question “How often do you meet or have a chat with … ?” For each question, participants responded by one of the following: daily, 2-3 times a week, at least once weekly, at least once monthly, less than once monthly, or no contact person. These responses were grouped into 3 categories: Daily (everyday), Weekly (1-3 times a week), Monthly or less (once a month or less). This variable was used as a categorical variable.
Dependent variable
The dependent variables of the study was participants’ cognitive scores on 5 domains: Episodic memory, Perceptual speed, Working memory, Frontal lobe assessment, and Global cognition.
25
Episodic memory: Measured using the word list memory, recall, and recognition tests from the Korean Version of the Consortium to Establish a Registry for Alzheimer’s Disease Assessment Packet (CERAD-K) (Lee et al., 2002; Lee et al., 2004). The scores of all the trials were added and was turned into a Z-score.
Perceptual speed: Measured using the trail making test (TMT-A) from CERAD-K. The time spent completing the task was used as a perceptual speed score. Unlike other tests, in which higher score indicates better cognitive function, more time spent completing TMT-A indicated worse cognitive function. In order to maintain consistent direction in results, the time outcome was inverted, and was turned into a Z-score.
Working memory: Measured using the digit span test from Seoul Neuropsychological Screening Battery (SNSB) (Ahn et al., 2010). There were forward and backward trials. The scores from both trials were added and was turned into a Z-score.
Frontal lobe function: Measured based on the Frontal Assessment Battery (FAB) developed by Dubois and colleagues (Dubois et al., 2000). The battery consists of conceptualization, mental flexibility, motor programming, sensitivity to interference, inhibitory control, and environmental autonomy. A Korean version of this battery proposed by Kim et al. (Kim et al., 2010) was used, and the total score of this battery was turned into a Z-score.
26
averaged to create a global cognition score. This variable was used as a continuous variable.
Control variables
Based on previous studies (Bennett et al., 2006; Liu et al., 2018; Han et al., 2019) covariates were collected: gender (male or female), age, education level (< elementary, elementary graduate, middle school graduate, high school graduate, ≥college), monthly household income (< 1 million, 1-2 million, > 2 million in Korean Won), marriage status (yes or no), number of chronic diseases (0, 1, 2 or ≥ 3), drinking status (never, <1 monthly, 1-4 monthly, or ≥ 2 weekly), and Nutritional status (Mini Nutritional Assessment score was used as a continuous variable), depression (yes or no), and IADL (yes or no).
SOCIAL SUPPORT
Although contact frequency is a relatively objective measure of an individual’s social network, its representation could seem shallow. To account for this limitation, the ENRICHD Social Support Instrument (ESSI) was included as a control variable (Vaglio et al., 2004). Except for the question regarding marriage, which was already included as a control variable, there were 6 questions in this instrument: “Is there someone you could talk to or rely on in times of need?”, “Is there someone to give you advice in difficult situations?”, “Is there someone who treats you with concern and affection?”, “Is there someone to help you with small favors
27
such as house chores when necessary?”, “Is there someone who helps you whole heartedly in times of need?”, “Is there someone who you trust and could call whenever necessary?”. For each of the 6 questions, the participants answered by one of the following: 1. No, 2. Scarcely, 3. Sometimes, 4. Often, 5. Always, 9. Do not know. 9 was treated as a null value, and the other responses were summed and used as a continuous variable.
Statistical analysis
The general characteristics of the study participants were described with mean±SD, or n and (%) depending on the type of variable. Then the study characteristics based on each of the independent variables were analyzed by t-test, ANOVA, χ2, or correlation. Simple linear regression was used to analyze the unadjusted association between each variable included in the study and each cognitive function. In the adjusted model, multiple linear regression analysis was conducted in two separate models. The linear regression was performed using PROC REG function in the SAS software.
Model 1:
Y = 𝛽𝑜+ 𝛽1(𝐹𝑅𝑆) + 𝛽2(𝐹𝑟𝑎𝑖𝑙𝑡𝑦) + ∑ 𝛽𝑖(𝐶𝑜𝑣𝑎𝑟𝑖𝑎𝑡𝑒𝑠)𝑘 𝑘
𝑖=1
The regression values between independent variables for each cognitive function were compared using the equation below:
t = β1− β2 √𝑆. 𝐸.12+ 𝑆. 𝐸.22
28
Model 2:
Y = 𝛽𝑜+ 𝛽1(𝐹𝑅𝑆) + 𝛽2(𝐹𝑟𝑎𝑖𝑙𝑡𝑦) + 𝛽𝑗(𝐼𝑛𝑡𝑒𝑟𝑎𝑐𝑡𝑖𝑜𝑛) + ∑ 𝛽𝑖(𝐶𝑜𝑣𝑎𝑟𝑖𝑎𝑡𝑒𝑠)𝑘 𝑘
𝑖=1
When model 2 was used, three different interaction terms were included in separate analyses. The interaction terms that were statistically significant in the linear regression analysis were analyzed further, using the PROC GLM, and PROC PLM functions in the SAS software, to calculate the differences in slopes.
First, there was the social contact and FRS interaction (Figure 4):
Figure 4. Interaction between FRS and contact frequency
Vascular risks have shown association with cognitive decline in previous studies (Villeneuve et al., 2009; Kaffashian et al., 2011), and our first hypothesis was to find which cognitive functions are influenced by vascular risks the most. Also, according to our third hypothesis, we included an interaction term between FRS and the frequency of contact with others to see if the social contact variable had an interaction effect with FRS in terms
FRS Cognitive
function
29
of cognitive function.
Second, there was the social contact and frailty interaction (Figure 5):
Figure 5. Interaction between frailty and contact frequency
Frailty has shown association with cognitive decline in the past (Chen et al., 2018), and accordingly, our third hypothesis was to find which cognitive functions are most significantly associated with frailty status. Also, in order to analyze the interaction effect of social contact in the relationship between frailty and cognitive function, an interaction term of social contact and frailty status was included in our analysis.
Third, an interaction between frailty status and FRS was included (Figure 6):
Frailty Cognitive
function
30
Figure 6. Interaction between FRS and frailty
The interaction between frailty and FRS was added into the analysis, because in the past, studies showing associations between frailty and FRS has proposed vascular risks as possible mechanisms linking frailty and cognitive function (Robertson et al., 2013; Panza et al., 2015a). Accordingly, we hypothesized that the association between FRS and cognitive function would differ depending on the frailty status.
Sensitivity analysis
To account for the differences between people who were excluded from the study and the people who remained in the final analysis, additional sensitivity analysis was conducted. Not accounting for the people who were excluded due to poor cognitive function or presence of dementia, the general characteristics between those who were excluded and those remaining were analyzed. Also, to elucidate the possible differences in results, with or without the excluded participants, a multiple imputation using PROC MI was used.
For all analyses, the criterion for statistical significance was p < 0.05, two-tailed. All analyses were conducted using the SAS statistical software
FRS Cognitive
function Frailty
31
32
III. Results
Baseline characteristics
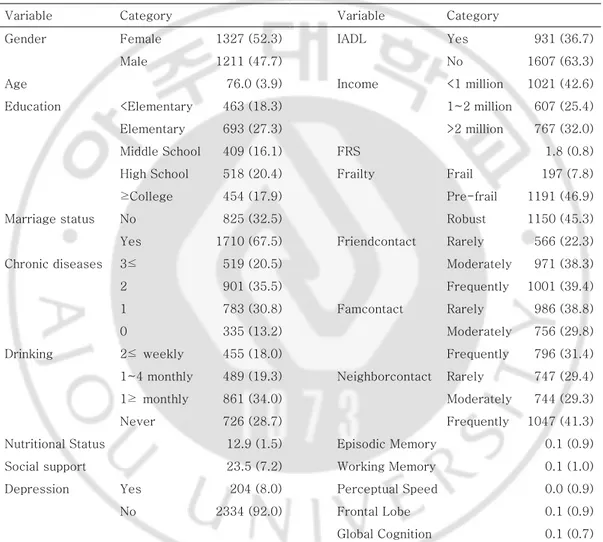
The baseline distribution and average values of all variables included in the final analysis are shown in Table 1. There were more females (52.3%) compared to males (47.7%) and the average age was 76.0 (SD: 3.9) years old. In terms of education, 18.3% were in the <Elementary group, 27.3% in the Elementary group, 16.1% in the Middle School group, 20.4% in the High School group, and 17.9% in the ≥College group. 67.5% of the participants reported being married and there were 20.5% with 3≤ chronic diseases, 35.5% with 2, 30.8% with 1, and 13.2% with 0. 18.0% reported drinking 2≤weekly, 19.3% 1~4 monthly, 34.0% 1≥monthly, and 28.7% never. The average MNA score was 12.9 (SD: 1.5) and the average ESSI score 23.5 (SD: 7.2). Only 8.0% of the participants reported yes to depression, and 36.7% of the participants had difficulties with at least one IADL. 32.0% of the participants had a monthly income of >2 million won, 25.4% 1~2 million won, and 42.6% <1 million won. The average FRS of our population was 1.8 (SD: 0.8), and 7.8% were frail, 46.9% pre-frail, and 45.3% robust. In terms of contact frequency, the proportion was the highest in the Frequently group when the target of contact was either friend (39.4%) or neighbor (41.3%). However, the proportion was the highest in the Rarely group (38.8%) when the target of contact was family. Finally, as for the scores of each cognitive function: Episodic memory (Mean: 0.1, SD: 0.9), Working memory (Mean: 0.1, SD: 1.0),
33
Perceptual speed (Mean: 0.0, SD: 0.9), Frontal lobe (Mean: 0.1, SD: 0.9), and global cognition (Mean: 0.1, SD: 0.7) were shown.
Table 1. General distribution of all variables
Variable Category Variable Category
Gender Female 1327 (52.3) IADL Yes 931 (36.7)
Male 1211 (47.7) No 1607 (63.3)
Age 76.0 (3.9) Income <1 million 1021 (42.6) Education <Elementary 463 (18.3) 1~2 million 607 (25.4) Elementary 693 (27.3) >2 million 767 (32.0) Middle School 409 (16.1) FRS 1.8 (0.8) High School 518 (20.4) Frailty Frail 197 (7.8) ≥College 454 (17.9) Pre-frail 1191 (46.9) Marriage status No 825 (32.5) Robust 1150 (45.3) Yes 1710 (67.5) Friendcontact Rarely 566 (22.3) Chronic diseases 3≤ 519 (20.5) Moderately 971 (38.3) 2 901 (35.5) Frequently 1001 (39.4) 1 783 (30.8) Famcontact Rarely 986 (38.8) 0 335 (13.2) Moderately 756 (29.8) Drinking 2≤ weekly 455 (18.0) Frequently 796 (31.4) 1~4 monthly 489 (19.3) Neighborcontact Rarely 747 (29.4) 1≥ monthly 861 (34.0) Moderately 744 (29.3) Never 726 (28.7) Frequently 1047 (41.3) Nutritional Status 12.9 (1.5) Episodic Memory 0.1 (0.9) Social support 23.5 (7.2) Working Memory 0.1 (1.0) Depression Yes 204 (8.0) Perceptual Speed 0.0 (0.9) No 2334 (92.0) Frontal Lobe 0.1 (0.9)
Global Cognition 0.1 (0.7)
* Characteristics of the categorical variables described as N (%),and characteristics of continuous variables described as Mean (SD)
34
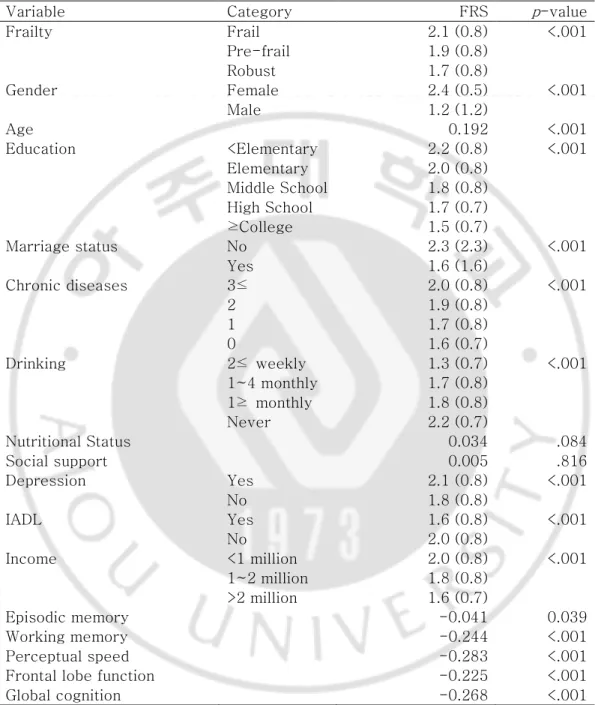
FRS
Higher FRS was apparent in worse frailty status: Frail (Mean: 2.1, SD: 0.8), Pre-frail (Mean: 1.9, SD: 0.8), and Robust (Mean: 1.7, SD: 0.8) (p-value: <.001). FRS was also higher for females (Mean: 2.4, SD: 0.5) compared to males (Mean: 1.2, SD: 1.2) (p-value: <.001). In terms of education, FRS was the highest in the <Elementary group (Mean: 2.2, SD: 0.8), and declined with higher educational attainments (p-value: <.001). FRS was also higher for people who were not married (Mean: 2.3, SD: 2.3, p-value: <.001), reported depression (Mean: 2.1, SD: 0.8, p-value: <.001), but was lower in those with problems in at least one IADL (Mean: 1.6, SD: 0.8, p-value: <.001). FRS was also the highest in those with most chronic diseases (Mean: 2.0, SD: 0.8, p -value: <.001), had the lowest income (Mean: 2.0, SD: 0.8, p-value: <.001), but was the lowest in those that drank most frequently (Mean: 1.3, SD: 0.7, p-value: <.001). FRS was positively correlated with age (r: 0.192, p-value: <.001), but negatively correlated with all cognitive scores. Nutritional status and ESSI were also positively correlated with FRS, but were not statistically significant (Table 2).
35
FRAILTY
Baseline characteristics of the participants based on Frailty status are displayed in Table 3. In terms of Frailty, female participants tended to be more Frail (8.0%) and Pre-frail (50.0%) compared to male (7.5%; 43.5%) (p -value: .002). Also, people who were in the Frail group tended to be older (Mean: 78.6, SD: 3.7) compared with those in the Pre-frail group (Mean: 76.3, SD: 4.0) and Robust group (Mean: 75.1, SD: 3.6) (p-value: <.001). In terms of education, the proportion of Frailty was the highest in the lowest educational attainment group, and tended to decrease as the educational attainment improved (16.2%, 8.6%, 5.4%, 4.8%, and 3.3%) (p-value: <.001). Proportion of the people in the Frail group was higher for the unmarried participants (9.8%) compared to the married participants (6.8%) (p-value: <.001). Also, as the number of chronic diseases increased, the proportion of Frail participants increased (p-value: <.001). However, people who drank the most frequently (7.9%) had a lower proportion of Frail participants compared to those who were in the Never group (8.4%) and 1 ≥ monthly group (8.7%) (p-value: .004). People in the Frail group had the lowest nutritional status (Mean: 12.0, SD: 2.1) compared to those in the Pre-frail group (Mean: 12.8, SD: 1.6) and the Robust group (Mean: 13.2, SD: 1.2) (p-value: <.001). Subjective social support was the lowest in the Frail group (Mean: 22.8, SD: 7.7) compared to the Pre-frail group (Mean:23.5, SD: 7.1), and the Robust group (Mean: 23.6, SD: 7.1), but the differences were not statistically significant (p-value: .365). Higher proportion of people who reported a presence of depression (31.4%) and IADL (11.0%) were in the Frail group
36
compared to those who did not report a presence of depression (5.7%) or IADL (5.9%) (p-value’s: <.001). There was a higher proportion of people in the Frail group (12.3) for the <1 million Won/month group compared to the <2 million Won/month group (5.3%) (p-value: <.001). Lastly, people in the Frail group had the highest FRS (Mean: 2.1, SD: 0.8) (p-value: <.001), worst Episodic memory score (Mean: -0.597, SD: 0.990) (p-value: <.001), Working memory score (Mean: -0.5, SD: 1.0) (p-value: <.001), Perceptual speed score (Mean: -0.6, SD: 1.2), (p-value: <.001), and Frontal lobe function score (Mean: -0.6, SD: 1.0) (p-value: <.001) compared with the Pre-frail and the Robust group.
37
Table 2. General characteristics in terms of FRS
Variable Category FRS p-value
Frailty Frail 2.1 (0.8) <.001 Pre-frail 1.9 (0.8) Robust 1.7 (0.8) Gender Female 2.4 (0.5) <.001 Male 1.2 (1.2) Age 0.192 <.001 Education <Elementary 2.2 (0.8) <.001 Elementary 2.0 (0.8) Middle School 1.8 (0.8) High School 1.7 (0.7) ≥College 1.5 (0.7) Marriage status No 2.3 (2.3) <.001 Yes 1.6 (1.6) Chronic diseases 3≤ 2.0 (0.8) <.001 2 1.9 (0.8) 1 1.7 (0.8) 0 1.6 (0.7) Drinking 2≤ weekly 1.3 (0.7) <.001 1~4 monthly 1.7 (0.8) 1≥ monthly 1.8 (0.8) Never 2.2 (0.7) Nutritional Status 0.034 .084 Social support 0.005 .816 Depression Yes 2.1 (0.8) <.001 No 1.8 (0.8) IADL Yes 1.6 (0.8) <.001 No 2.0 (0.8) Income <1 million 2.0 (0.8) <.001 1~2 million 1.8 (0.8) >2 million 1.6 (0.7) Episodic memory -0.041 0.039 Working memory -0.244 <.001 Perceptual speed -0.283 <.001
Frontal lobe function -0.225 <.001
Global cognition -0.268 <.001
* Characteristics of the categorical variables described as N (%), χ2 and characteristics of continuous variables described
38
Table 3. General characteristics in terms of Frailty status
Frailty
Variable Category Robust Pre-frail Frail Total p-value Gender Female 557 (42.0) 664 (50.0) 106 (8.0) 1327 (100.0) .002 Male 593 (49.0) 527 (43.5) 91 (7.5) 1211 (100.0) Age 75.1 (3.6) 76.3 (4.0) 78.6 (3.7) <.001 Education <Elementary 128 (27.6) 260 (56.2) 75 (16.2) 463 (100.0) <.001 Elementary 279 (40.3) 354 (51.1) 60 (8.6) 693 (100.0) Middle School 204 (49.9) 183 (44.7) 22 (5.4) 409 (100.0) High School 268 (51.7) 225 (43.5) 25 (4.8) 518 (100.0) ≥College 270 (59.5) 169 (37.2) 15 (3.3) 454 (100.0) Marriage status No 320 (38.8) 424 (52.4) 81 (9.8) 825 (100.0) <.001 Yes 828 (48.4) 766 (44.8) 116 (6.8) 1710 (100.0) Chronic diseases 3≤ 179 (34.5) 280 (53.9) 60 (11.6) 519 (100.0) <.001 2 371 (41.2) 452 (50.2) 78 (8.6) 901 (100.0) 1 399 (50.9) 334 (42.7) 50 (6.4) 783 (100.0) 0 201 (60.0) 125 (37.3) 9 (2.7) 335 (100.0) Drinking 2≤ weekly 230 (50.6) 189 (41.5) 36 (7.9) 455 (100.0) .004 1~4 monthly 243 (49.7) 221 (45.2) 25 (5.1) 489 (100.0) 1≥ monthly 475 (43.6) 411 (47.7) 75 (8.7) 861 (100.0) Never 299 (41.2) 366 (50.4) 61 (8.4) 726 (100.0) Nutritional Status 13.2 (1.2) 12.8 (1.6) 12.0 (2.1) <.001 Social support 23.6 (7.1) 23.5 (7.1) 22.8 (7.7) .365 Depression Yes 30 (14.7) 110 (53.9) 64 (31.4) 204 (100.0) <.001 No 1120 (48.0) 1081 (46.3) 133 (5.7) 2334 (100.0) IADL Yes 393 (42.2) 436 (46.8) 102 (11.0) 931 (100.0) <.001 No 757 (47.1) 755 (47.0) 95 (5.9) 1607 (100.0) Income <1 million 375 (36.7) 521 (51.0) 125 (12.3) 1021 (100.0) <.001 1~2 million 273 (45.0) 302 (49.7) 32 (5.3) 607 (100.0) >2 million 441 (57.5) 300 (39.1) 26 (3.4) 767 (100.0) FRS 1.7 (0.8) 1.9 (0.8) 2.1 (0.8) <.001 Episodic memory 0.3 (0.8) -0.2 (0.9) -0.5 (1.0) <.001 Working memory 0.3 (0.9) -0.0 (1.0) -0.4 (0.9) <.001 Perceptual speed 0.3 (0.7) -0.1 (1.0) -0.6 (1.2) <.001 Frontal lobe 0.3 (0.8) -0.0 (0.9) -0.6 (1.0) <.001 Global cognition 0.3 (0.6) -0.1 (0.7) -0.5 (0.7) <.001
* Characteristics of the categorical variables described as N (%), χ2 and characteristics of continuous variables described
39
SOCIAL CONTACT
Contact with Friends
Baseline characteristics based on contact with friends are shown in Table 4. In contrast to the original hypothesis, people in the Frequently contact group had the worst FRS (Mean: 1.9, SD: 0.8) compared to those in the Moderately group (Mean: 1.8, SD: 0.8), and the Rarely group (Mean: 1.8, SD: 0.8) (p-value: <.001). Notably, people who were in the Frail group had the highest proportion of participants in the Rarely contact group (38.1%) compared to Pre-frail (24.9%) and Robust group (16.9%) (p-value: <.001). Similar trends were noticeable in terms of the cognitive scores. In terms of cognitive scores, the Rarely group showed worst scores on each cognitive function and they were statistically significant.
Contact with Family
The baseline characteristics depending on contact frequency with family did not differ as statistically significantly as in the case with friends (Table 5). The cognitive scores in terms of Perceptual speed (Mean: 0.0, SD: 1.0, p-value: .027), Frontal lobe (Mean: 0.0, SD: 0.9, p-value: .005), and Global cognition (Mean: 0.0, SD: 0.7, p-value: .040) were the lowest in the group of people contacting their family rarely.
40 Contact with neighbors
Lastly, contact frequency with neighbors was almost as statistically significant with the variables of the study as contacting friends, but the trend was the opposite (Table 6). Participants in the Frequently group had the worst FRS (Mean: 2.0, SD: 0.8, p-value: <.001), highest proportion of those who are Frail (51.8%), and all cognitive scores were the lowest (p-value’s: <.001).
41
Table 4. Baseline characteristics based on contact frequency with friends
Friendcontact
Variable Category Frequently Moderately Rarely Total p-value
Gender Female 591 (44.5) 490 (36.9) 246 (18.6) 1327 (100.0) <.001 Male 410 (33.9) 481 (39.7) 320 (26.4) 1211 (100.0) Age 76.2 (3.9) 75.8 (3.9) 76.0 (3.9) .074 Education <Elementary 201 (43.4) 135 (29.2) 127 (27.4) 463 (100.0) <.001 Elementary 305 (44.0) 232 (33.5) 156 (22.5) 693 (100.0) Middle School 179 (43.8) 143 (34.9) 87 (21.3) 409 (100.0) High School 183 (35.3) 223 (43.1) 112 (21.6) 518 (100.0) ≥College 133 (29.3) 237 (52.2) 84 (18.5) 454 (100.0) Marriage status No 385 (46.7) 302 (36.6) 138 (16.7) 825 (100.0) <.001 Yes 614 (35.9) 668 (39.1) 428 (25.0) 1710 (100.0) Chronic diseases 3≤ 200 (38.5) 197 (38.0) 122 (23.5) 519 (100.0) .004 2 350 (38.8) 315 (35.0) 236 (26.2) 901 (100.0) 1 312 (39.9) 325 (41.5) 146 (18.6) 783 (100.0) 0 139 (41.5) 134 (40.0) 62 (18.5) 335 (100.0) Drinking 2≤ weekly 175 (38.5) 171 (37.6) 109 (23.9) 455 (100.0) .893 1~4 monthly 192 (39.3) 186 (38.0) 111 (22.7) 489 (100.0) 1≥ monthly 337 (39.1) 327 (38.0) 197 (22.9) 861 (100.0) Never 295 (40.6) 282 (38.9) 149 (20.5) 726 (100.0) Nutritional Status 12.9 (1.5) 13.0 (1.4) 12.7 (1.6) .011 Social support 24.6 (6.4) 22.9 (7.1) 22.5 (8.1) <.001 Depression Yes 69 (33.8) 75 (36.8) 60 (29.4) 204 (100.0) .031 No 932 (39.9) 896 (38.4) 506 (21.7) 2334 (100.0) IADL Yes 324 (34.8) 333 (35.8) 274 (29.4) 931 (100.0) <.001 No 677 (42.1) 638 (39.7) 292 (18.2) 1607 (100.0) Income <1 million 446 (43.7) 340 (33.3) 235 (23.0) 1021 (100.0) <.001 1~2 million 211 (34.8) 243 (40.0) 153 (25.2) 607 (100.0) >2 million 273 (35.6) 341 (44.5) 153 (19.9) 767 (100.0) FRS 1.9 (0.8) 1.8 (0.8) 1.8 (0.8) <.001 Frailty Frail 69 (35.0) 53 (26.9) 75 (38.1) 197 (100.0) <.001 Pre-frail 442 (37.1) 452 (38.0) 297 (24.9) 1191 (100.0) Robust 490 (42.6) 466 (40.5) 194 (16.9) 1150 (100.0) Episodic memory 0.1 (0.9) 0.2 (0.9) 0.0 (1.0) .002 Working memory 0.1 (0.9) 0.2 (0.9) -0.1 (1.0) <.001 Perceptual speed 0.0 (0.9) 0.2 (0.8) -0.1 (1.1) <.001 Frontal lobe 0.1 (0.9) 0.2 (0.9) -0.1 (1.0) <.001 Global cognition 0.0 (0.7) 0.2 (0.6) -0.1 (0.8) <.001
* Characteristics of the categorical variables described as N (%), χ2 and characteristics of continuous variables described
42
Table 5. Baseline characteristics based on contact frequency with family members
Famcontact
Variable Category Frequently Moderately Rarely Total p-value
Gender Female 443 (33.4) 382 (38.8) 502 (37.8) 1327 (100.0) .071 Male 353 (29.1) 374 (30.9) 484 (40.0) 1211 (100.0) Age 75.9 (3.9) 76.0 (4.0) 76.0 (3.8) .756 Education <Elementary 150 (32.4) 123 (26.6) 190 (41.0) 463 (100.0) .354 Elementary 229 (33.0) 200 (28.9) 264 (38.1) 693 (100.0) Middle School 133 (32.5) 126 (30.8) 150 (36.7) 409 (100.0) High School 141 (27.2) 164 (31.7) 213 (41.1) 518 (100.0) ≥College 143 (31.5) 142 (31.3) 169 (37.2) 454 (100.0) Marriage status No 294 (35.6) 222 (26.9) 309 (37.5) 825 (100.0) .003 Yes 500 (29.3) 534 (31.2) 676 (39.5) 1710 (100.0) Chronic diseases 3≤ 165 (31.8) 147 (28.3) 207 (39.9) 519 (100.0) .767 2 280 (31.1) 261 (29.0) 360 (39.9) 901 (100.0) 1 243 (31.0) 239 (30.5) 301 (38.5) 783 (100.0) 0 108 (32.2) 109 (32.6) 118 (35.2) 335 (100.0) Drinking 2≤ weekly 130 (28.6) 130 (28.6) 195 (42.8) 455 (100.0) .120 1~4 monthly 153 (31.3) 166 (33.9) 170 (34.8) 489 (100.0) 1≥ monthly 269 (31.2) 253 (29.4) 339 (39.4) 861 (100.0) Never 242 (33.3) 202 (27.8) 282 (38.9) 726 (100.0) Nutritional Status 12.9 (1.5) 13.0 (1.4) 12.8 (1.5) .026 Social support 24.4 (6.7) 24.1 (6.8) 22.4 (7.6) <.001 Depression Yes 57 (27.9) 52 (25.5) 95 (46.6) 204 (100.0) .061 No 739 (31.7) 704 (30.1) 891 (38.2) 2334 (100.0) IADL Yes 330 (35.4) 256 (27.5) 345 (37.1) 931 (100.0) .003 No 466 (29.0) 500 (31.1) 641 (39.9) 1607 (100.0) Income <1 million 313 (30.7) 268 (26.2) 440 (43.1) 1021 (100.0) .002 1~2 million 182 (30.0) 198 (32.6) 227 (37.4) 607 (100.0) >2 million 218 (28.4) 264 (34.4) 285 (37.2) 767 (100.0) FRS 1.9 (0.8) 1.8 (0.8) 1.8 (0.8) .066 Frailty Frail 60 (30.5) 51 (25.9) 86 (43.6) 197 (100.0) .092 Pre-frail 375 (31.5) 335 (28.1) 481 (40.4) 1191 (100.0) Robust 361 (31.4) 370 (32.2) 419 (36.4) 1150 (100.0) Episodic memory 0.1 (1.0) 0.1 (0.9) 0.1 (0.9) .767 Working memory 0.1 (1.0) 0.1 (0.9) 0.1 (1.0) .570 Perceptual speed 0.0 (1.0) 0.1 (0.8) 0.0 (1.0) .027 Frontal lobe 0.1 (0.9) 0.2 (0.9) 0.0 (0.9) .005 Global cognition 0.1 (0.7) 0.1 (0.7) 0.0 (0.7) .040
* Characteristics of the categorical variables described as N (%), χ2 and characteristics of continuous variables described
43
Table 6. Baseline characteristics based on contact frequency with neighbors
Neicontact
Variable Category Frequently Moderately Rarely Total p-value
Gender Female 614 (46.3) 384 (28.9) 329 (24.8) 1327 (100.0) <.001 Male 433 (35.8) 360 (29.7) 418 (34.5) 1211 (100.0) Age 76.1 (4.0) 75.5 (3.9) 76.3 (3.8) <.001 Education <Elementary 263 (56.8) 101 (21.8) 99 (21.4) 463 (100.0) <.001 Elementary 339 (48.9) 190 (27.4) 164 (23.7) 693 (100.0) Middle School 171 (41.8) 115 (28.1) 123 (30.1) 409 (100.0) High School 166 (32.1) 184 (35.5) 168 (32.4) 518 (100.0) ≥College 108 (23.8) 154 (33.9) 192 (42.3) 454 (100.0) Marriage status No 387 (46.9) 219 (26.6) 219 (26.5) 825 (100.0) <.001 Yes 658 (38.5) 524 (30.6) 528 (30.9) 1710 (100.0) Chronic diseases 3≤ 217 (41.8) 126 (24.3) 176 (33.9) 519 (100.0) .013 2 388 (43.1) 258 (28.6) 255 (28.3) 901 (100.0) 1 299 (38.2) 261 (33.3) 223 (28.5) 783 (100.0) 0 143 (42.7) 99 (29.5) 93 (27.8) 335 (100.0) Drinking 2≤ weekly 177 (38.9) 137 (30.1) 141 (31.0) 455 (100.0) .662 1~4 monthly 202 (41.3) 140 (28.6) 147 (30.1) 489 (100.0) 1≥ monthly 348 (40.4) 251 (29.2) 262 (30.4) 861 (100.0) Never 318 (43.8) 211 (29.1) 197 (27.1) 726 (100.0) Nutritional Status 12.9 (1.5) 12.9 (1.5) 12.9 (1.5) .897 Social support 25.4 (6.2) 23.1 (7.2) 21.2 (7.7) <.001 Depression Yes 81 (39.7) 51 (25.0) 72 (35.3) 204 (100.0) .127 No 966 (41.4) 693 (29.7) 675 (28.9) 2334 (100.0) IADL Yes 380 (40.8) 268 (28.8) 283 (30.4) 931 (100.0) .714 No 667 (41.5) 476 (29.6) 464 (28.9) 1607 (100.0) Income <1 million 514 (50.3) 253 (24.8) 254 (24.9) 1021 (100.0) <.001 1~2 million 232 (38.2) 186 (30.6) 189 (31.2) 607 (100.0) >2 million 240 (31.3) 256 (33.4) 271 (35.3) 767 (100.0) FRS 2.0 (0.8) 1.8 (0.8) 1.7 (0.8) <.001 Frailty Frail 102 (51.8) 41 (20.8) 54 (27.4) 197 (100.0) .008 Pre-frail 500 (42.0) 348 (29.2) 343 (28.8) 1191 (100.0) Robust 445 (38.7) 355 (30.9) 350 (30.4) 1150 (100.0) Episodic memory -0.0 (0.9) 0.2 (0.9) 0.1 (0.9) <.001 Working memory -0.1 (0.9) 0.2 (1.0) 0.2 (1.0) <.001 Perceptual speed -0.2 (1.0) 0.2 (0.8) 0.2 (0.8) <.001 Frontal lobe -0.1 (0.9) 0.2 (0.9) 0.2 (0.9) <.001 Global cognition -0.1 (0.2) 0.2 (0.7) 0.2 (0.6) <.001
* Characteristics of the categorical variables described as N (%), χ2 and characteristics of continuous variables described
44 Global cognition
UNADJUSTED ANALYSIS
In the unadjusted linear regression, as Global cognition as the outcome variable, all variables were significantly associated with Global cognition (Table 7), except for the 1≥ monthly group (p-value: .344) in terms of the drinking variable, Social support (p-value: .477), and in terms of contact frequency with family: Rarely group (p-value: .692) and Moderately group (p-value: .052).
45
Table 7. Unadjusted linear regression in terms of Global cognition
Global cognition
Variables Categories B (S.E.) p-value
Gender Female -0.248 (0.027) <.001 Male Age -0.053 (0.003) <.001 Education <Elementary -1.195 (0.037) <.001 Elementary -0.645 (0.034) <.001 Middle School -0.403 (0.038) <.001 High School -0.166 (0.036) <.001 ≥College Marriage status No -0.376 (0.283) <.001 Yes Chronic diseases 3≤ -0.167 (0.048) <.001 2 -0.180 (0.044) <.001 1 -0.100 (0.045) .026 0 Drinking 2≤ weekly 0.164 (0.041) <.001 1~4 monthly 0.151 (0.040) <.001 1≥ monthly 0.033 (0.035) .344 Never Nutritional Status 0.071 (0.009) <.001 Social support -0.001 (0.002) .477 Depression Yes -0.530 (0.049) <.001 No
46
Table 7. cont.
Global cognition
Variables Categories B (S.E.) p-value
IADL Yes -0.090 (0.028) .002 No Income <1 million -0.525 (0.030) <.001 1~2 million -0.200 (0.034) <.001 >2 million FRS -0.226 (0.017) <.001 Frailty Frail -0.822 (0.050) <.001 Pre-frail -0.360 (0.027) <.001 Robust Friend Rarely -0.134 (0.036) <.001 Moderately 0.151 (0.031) <.001 Frequently Family Rarely -0.013 (0.033) .692 Moderately 0.068 (0.035) .052 Frequently Neighbor Rarely 0.262 (0.032) <.001 Moderately 0.266 (0.033) <.001 Frequently ADJUSTED ANALYSIS
The adjusted analysis with the main variables of interest is shown in Table 8. Low Global cognition was associated with high FRS (B: -0.053, S.E.: 0.021, p-value: <.001). Also Global cognition score was worse for Frail (B: -0.302, S.E.: 0.044, p-value: .012) and Pre-frail (B: -0.156, S.E.: 0.022, p -value: <.001) with Robust as reference. In terms of contact frequency, Rarely contact group (B: -0.131, S.E.: 0.028, p-value: <.001) in terms of contacting friends was negatively associated with Global cognition with Frequently as reference. Lastly, both Rarely (B: 0.082, S.E.: 0.027, p-value: .003) and Moderately (B: 0.068, S.E.: 0.027, p-value: .014) were positively associated
47
with Global cognition, implying a better cognition score for those contacting their neighbors less frequently, with Frequently as reference in terms of contact frequency with neighbors.
Table 8. Adjusted linear regression in terms of Global cognition
Global cognition
Variables Categories B (S.E.) p-value
FRS -0.053 (0.021) .012 Frailty Frail -0.302 (0.044) .012 Pre-frail -0.156 (0.022) <.001 Robust Friendcontact Rarely -0.131 (0.028) <.001 Moderately -0.014 (0.026) .584 Frequently Famcontact Rarely -0.019 (0.025) .449 Moderately 0.006 (0.026) .807 Frequently Neighborcontact Rarely 0.082 (0.027) .003 Moderately 0.068 (0.027) .014 Frequently Adjusted R2 0.450 F-value(df) (p-value) 75.20(28) (<.001)
* Adjusted for gender, age, education, marriage status, number of chronic diseases, drinking status, nutritional status, depression, IADL, Monthly income, and social support