Environmental Science Vol. 37, No. 1, pp. 44-51, March, 2021
https://doi.org/10.7747/JFES.2021.37.1.44
Land Use/Land Cover (LULC) Change in Suburb
of Central Himalayas: A Study from Chandragiri,
Kathmandu
Suraj Joshi1, Nitant Rai2,*, Rijan Sharma2 and Nishan Baral3
1University of Salzburg, Kapitelgasse 4-65020, Salzburg, Austria
2Kathmandu Forestry College, Tribhuvan University, Kathmandu 44600, Nepal 3Institute of Forestry, Tribhuvan University, Hetauda 44107, Nepal
Abstract
Rapid urbanization and population growth have caused substantial land use land cover (LULC) change in the Kathmandu valley. The lack of temporal and geographical data regarding LULC in the middle mountain region like Kathmandu has been challenging to assess the changes that have occurred. The purpose of this study is to investigate the changes in LULC in Chandragiri Municipality between 1996 and 2017 using geographical information system (GIS) and remote sensing. Using Landsat imageries of 1996 and 2017, this study analyzed the LULC change over 21 years. The images were classified using the Maximum Likelihood classification method and post classified using the change detection technique in GIS. The result shows that severe land cover changes have occurred in the Forest (11.63%), Built-up areas (3.68%), Agriculture (-11.26%), Shrubland (-0.15%), and Bareland (-3.91%) in the region from 1996 to 2017. This paper highlights the use of GIS and remote sensing in understanding the changes in LULC in the south-west part of Kathmandu valley.
Key Words: GIS, image classification, Landsat, land use land cover, remote sensing
Received: July 3, 2020. Revised: December 3, 2020. Accepted: December 4, 2020. Corresponding author: Nitant Rai
Kathmandu Forestry College, Tribhuvan University, Kathmandu 44600, Nepal Tel: +977-9849377819, Fax: +977-014416842, E-mail: [email protected]
Introduction
Land use land cover (LULC) change is the change in the biophysical cover and use of land for a different purpose. LULC changes over time in response to evolving economic, social, and biophysical conditions (Lebow et al. 2012). Such changes in the use of land are occurring at var-ious spatial and temporal levels (Agarwal et al. 2002). They are beneficial at times but can have a detrimental effect (Briassoulis 2000), the latter being the chief cause of con-cern as it affects human well-being and welfare (Turner II et al. 2007; Gonzales Inca 2009). LULC change has an
im-pact on a wide range of environmental and landscape attrib-utes including the quality of water, land and air resources, ecosystem services and function, and the climate system it-self through greenhouse gas fluxes and surface albedo ef-fects (Lambin et al. 2000). Human action is altering the terrestrial environment at an unprecedented rate, magni-tude, and spatial scale. Land cover change stemming from human land uses represents a major source and a major ele-ment of global environele-mental change (Turner et al. 1994). Urbanization is one of the leading cause of LULC change, especially in developing countries like Nepal (Ishtique et al. 2017). Nepal is among the top ten rapidly
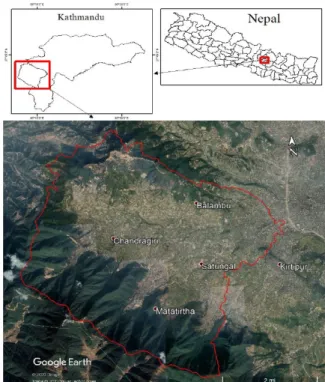
Fig. 1. Map of study area.
urbanizing countries according to a report by the United Nations Department of Economic and Social Affairs (United Nations 2015). While all major cities in Nepal are urbanizing at unprecedented rates, but the growth of pop-ulation and the rapid expansion of the built-up area in re-cent decades has caused a substantial LULC change partic-ularly in Kathmandu valley (Thapa and Murayama 2009; Ishtiaque et al. 2017). With a 14.7% urban growth rate be-tween 1989 and 2016, the Kathmandu Valley is going through a significant transformation. Many problems like traffic congestion, air pollution, declining water table, and loss of open space are prevalent in recent years. Thus, it is important to understand the dynamics of the LULC change process, including its interactions with the local and regional environmental change to cope with these un-desirable changes and reduce their effects (Ishtiaque et al. 2017). The LULC changes between each period represent one of two main types of landscape change: land cover con-version and land cover modification.
There are many techniques developed in the literature for LULC change detection. However, due to techno-logical advances in the field of GIS and remote sensing sci-ence, they provide a cost-effective, less time consuming, and efficient way to study LULC changes. Many of these changes in environment and climate can be quantified from satellite measurements, aerial photographs, and ground observations. Many researchers have used GIS and remote sensing to analyze LULC change patterns and trends be-cause of its accuracy, completeness, and suitability in quan-tifying deforestation, degradation, and biodiversity loss in any particular area.
There are a limited number of studies conducted on LULC change in Nepal. It is an under-developed nation finally developing a post-civil war period amidst unstable political changes. In such a scenario, it is undergoing rapid urbanization and developmental phases resulting in a high rate of conversion of land. This conversion has brought up a demand for research on LULC change to know the trend and follow-up with a proper course of action on urban plan-ning as well as forest conservation. This demand led to this study to investigate the changes in LULC over 21 years in Chandragiri, Kathmandu using remote sensing and GIS technique by using pixel-based supervised image classi-fication method using maximum likelihood algorithm for
classifying the images.
Materials and Methods
Study area
The study was conducted in Chandragiri municipality located between Latitude 27°38'43''N-27°43'37''N and Longitude: 85°11'30''E-85°16'51''E. The area is situated in Kathmandu district, Bagmati Province of Nepal. Its alti-tude ranges from 1300m - 2500m within subtropical to temperate climatic zone. The temperature of the area rang-es from 12°C-22°C. Areas in lower altitudrang-es are mostly densely populated whereas areas in the upper altitude are sparsely populated and mostly covered by forest. Within the municipality, 3800 households with a total population of 85,198 (Central Bureau of Statistics 2011) are managing 23 Community Forests covering an area of 1134.78 ha. The map of the study area is shown in Fig. 1.
Data sources
Two Landsat images, Landsat TM (1996) and Landsat OLI_TIRS (2017) (WRS Path/Row 141/41) were used
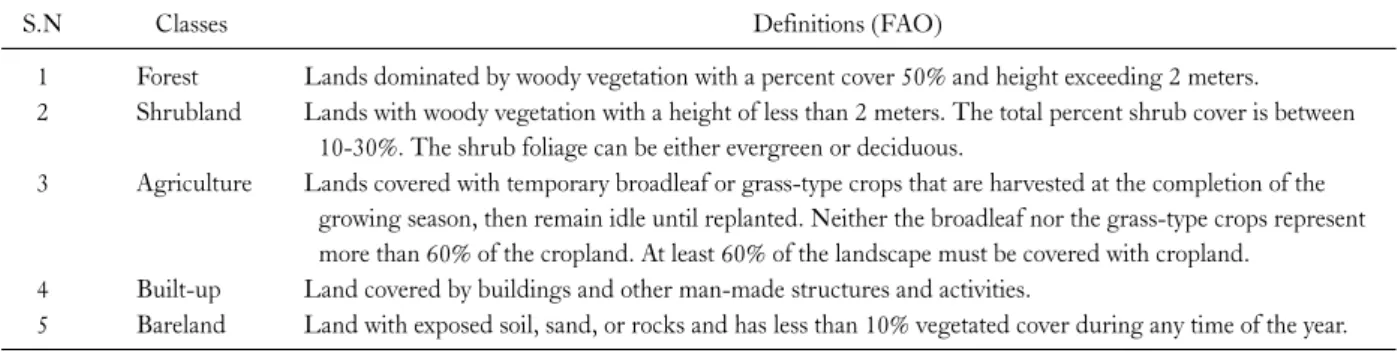
Table 1. Land cover classification
S.N Classes Definitions (FAO)
1 Forest Lands dominated by woody vegetation with a percent cover 50% and height exceeding 2 meters.
2 Shrubland Lands with woody vegetation with a height of less than 2 meters. The total percent shrub cover is between 10-30%. The shrub foliage can be either evergreen or deciduous.
3 Agriculture Lands covered with temporary broadleaf or grass-type crops that are harvested at the completion of the growing season, then remain idle until replanted. Neither the broadleaf nor the grass-type crops represent more than 60% of the cropland. At least 60% of the landscape must be covered with cropland.
4 Built-up Land covered by buildings and other man-made structures and activities.
5 Bareland Land with exposed soil, sand, or rocks and has less than 10% vegetated cover during any time of the year.
for LULC classification which was obtained from USGS Earth Explorer (https://earthexplorer.usgs.gov). Both im-ages were acquired in November to minimize variation in vegetation phenology and climatic conditions. Sufficient numbers of GPS coordinates using the spatial reference system of WGS 84/UTM Zone 45 were collected in the field to train the maximum likelihood algorithm for su-pervised classification of the 2017 Landsat image. Some of the collected GPS coordinates were also used for the ground trothing during the accuracy assessment.
Other materials include two topographic maps from 1996 of 1:25000 scale of the study area produced by the Survey Department of Nepal. These maps were used to collect training samples for image classification of the 1996 Landsat image and carryout accuracy assessment.
We also took key informant interviews to know about the observed changes in land use/land cover through the years with rangers from the Sub Division Forest Office and older members of the society selected as key informants.
A total of 71 field samples were collected during February and March. The canopy cover of the field sam-ples were determined using densiometer. Due to mountain-ous terrain, inaccessible areas, and availability of high-reso-lution images of Google Earth for 2018, non-probabilistic convenient and purposive sampling were done during the collection of field samples, also the same sampling strategy was used for collecting training samples. 20% (14 samples) of the collected samples were used in accuracy assessment and the remaining (57 samples) for training the classifier.
Image preprocessing
The study area was extracted from the two Landsat im-ages using the administrative boundary of the Chandragiri
Municipality. Initially, both the Landsat TM and Landsat OLI_TIRS images had a resolution of 30m. Landsat OLI_TIRS was initially pansharpned to 15 m×15 m to utilize the better spatial resolution of the panchromatic band, but before the post-classification comparison, it was resampled to 30 m×30 m to match its resolution with Landsat TM image.
False-color composites of the images were obtained us-ing bands 5, 4, 3 (for Landsat OLI_TIRS image), and bands 4, 3, 2 (for Landsat TM image). Also, the Normalized Difference Vegetation Index (NDVI) and Normalized Difference Built-up Index (NDBI) of both Landsat images were produced using the raster calculator in ArcMap 10.2 to assist in the image classification process and accuracy assessment. The topographic maps were also digitized and georeferenced.
Image classification and accuracy assessment
Signature files were created from the training samples for all the classes and supervised classifications were per-formed using the maximum likelihood classifier in ERDAS IMAGINE 15.1. The description of Land cover classes is presented in Table 1.
Overall accuracy, producer’s and user’s accuracies, and the Kappa statistic were calculated in ERDAS IMAGINE for assessing the accuracy of the classified images.
For accuracy assessment, simple random sampling was done to generate 88 and 72 sampling points for the images of 1996 and 2017 respectively. Then they were verified us-ing Google Earth historical imagery, field samples, and topographic maps (for 1996 only). Besides that, true color composites, and indices were also used during the accuracy assessment and collection of training samples to increase
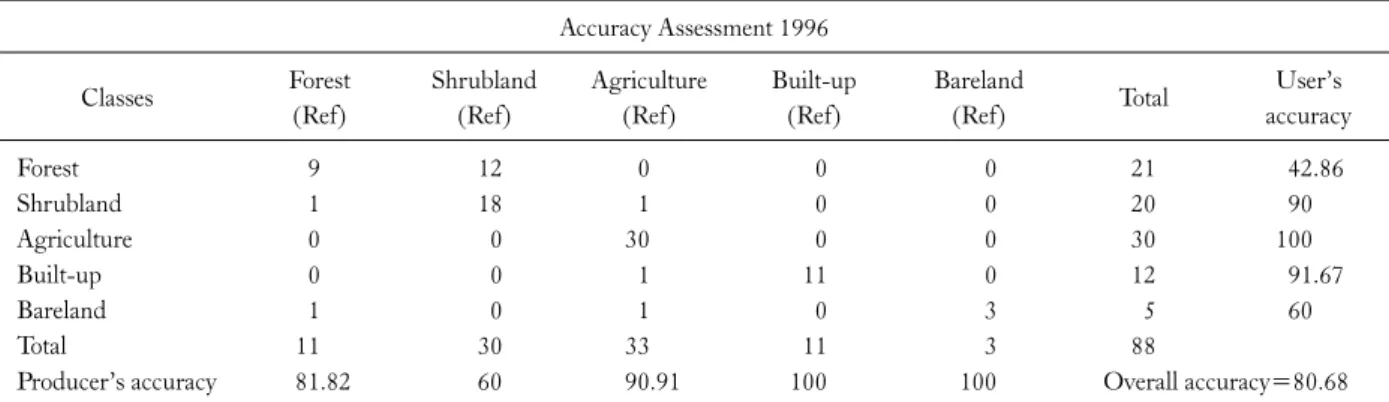
Table 2. Accuracy assessment for supervised classification of Landsat TM (1996) and Landsat OLI_TIRs (2017) Accuracy Assessment 1996 Classes Forest (Ref) Shrubland (Ref) Agriculture (Ref) Built-up (Ref) Bareland (Ref) Total User’s accuracy Forest 9 12 0 0 0 21 42.86 Shrubland 1 18 1 0 0 20 90 Agriculture 0 0 30 0 0 30 100 Built-up 0 0 1 11 0 12 91.67 Bareland 1 0 1 0 3 5 60 Total 11 30 33 11 3 88
Producer’s accuracy 81.82 60 90.91 100 100 Overall accuracy=80.68
Kappa Coefficient=0.7469. Accuracy Assessment 2017 Forest 29 0 0 0 0 29 100 Shrubland 3 7 2 0 0 12 58.3 Agriculture 1 0 11 1 0 13 84.6 Built-up 0 0 0 13 0 13 100 Bareland 0 0 2 0 3 5 60 Total 33 7 15 14 3 72
Producer’s accuracy 87.9 100 73.3 92.9 100 Overall accuracy=87.5
Kappa Coefficient=0.8324.
Table 3. LULC change statistics for 1996 and 2017
LULC classes LULC status in 1996 LULC status in 2017 Change
Area (ha) Area (%) Area (ha) Area (%) Area (ha) Area (%)
Forest 931 21.21 1,442 32.84 511 11.63 Shrubland 823 18.75 817 18.60 -6 -0.15 Agriculture 1,527 34.77 1,032 23.51 -495 -11.26 Built-up 657 14.96 819 18.64 162 3.68 Bareland 453 10.31 281 6.41 -172 -3.91 Grand total 4,391 100 4,391 100
the degree of certainty in identifying the LULC classes.
Change analysis
The area of each LULC class of the classified images was computed using the “Zonal statistics as Table” tool in Spatial Analyst Extension of ArcMap. Also, the LULC conversion table was computed using the “Tabulate Area” tool in Spatial Analyst Extension. Similarly, LULC change map was created using “Raster Calculator” employing the following expression:
(LULC map of 1996*10)+LULC map of 2017.
The following formula was used to compute the rate of change of land cover and land use in the study area:
Rate of change (%) =
× (UNDP, RFDTh, and FAO, as cited by Neupane, 2016)
Where, a1 = base year data (ha) (1996)
a2 = end-year data (ha) (2017)
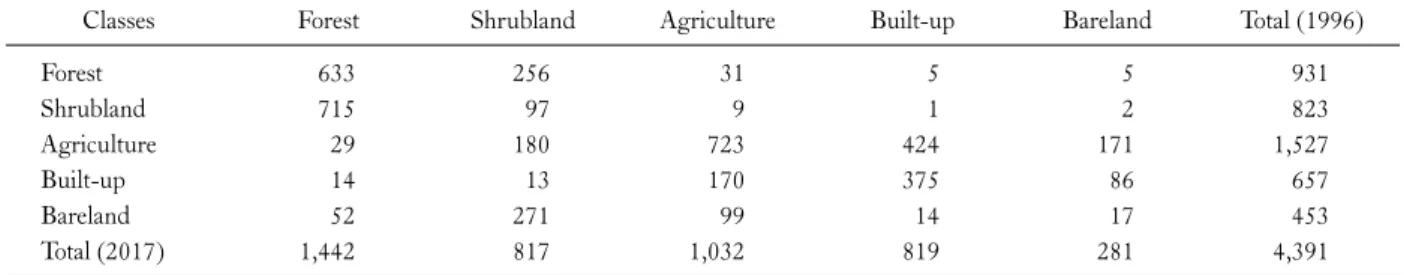
Table 4. LULC conversion matrix
Classes Forest Shrubland Agriculture Built-up Bareland Total (1996)
Forest 633 256 31 5 5 931 Shrubland 715 97 9 1 2 823 Agriculture 29 180 723 424 171 1,527 Built-up 14 13 170 375 86 657 Bareland 52 271 99 14 17 453 Total (2017) 1,442 817 1,032 819 281 4,391
Fig. 3. LULC map of 2017. Fig. 2. LULC map of 1996.
Results
The overall accuracy of the classified image of 1996 was 80.68%, and 2017 was 87.5%. The Kappa coefficient for classified images of 1996 and 2017 was 74.69% and 83.24% respectively as shown in Table 2.
The image classification of 1996 revealed that forest (21.21%) was the major land cover type and agriculture (34.77%) was the major land use. Similarly, the image clas-sification of 2017 showed that forest remains the major land cover type (32.84%) and agriculture is still the major land use (23.51%). Between 1996 and 2017 forest area and built-up area increased by 11.63% and 3.68% respectively, while shrubland, agriculture, and bareland decreased by 0.15%, 11.26%, and 3.91% respectively. The LULC status
of the area in 1996 and 2017, as well as the LULC changes and conversions in the area between 1996 and 2017, is giv-en in Table 3.
The classified images are given in Fig. 2, 3, and the sta-tus of different LULC classes are given in Table 4.
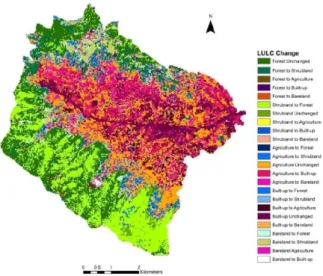
From Table 4 it is evident that a total of 810 ha including 715 ha of shrubland, 29 ha of Agriculture, 14 ha of Built-up, and 52 ha of bareland have been converted into forest area by 2017. Likewise, 297 ha of forest has been converted into 256 ha of shrubland, 31 ha of Agriculture, 5 ha of built-up, and 5 ha of bareland. Also, a large amount of agricultural land, 424 ha (27.8%) has been converted to built-up, and also a large portion, 271 ha (59.8%) of bare-land has been converted to shrubbare-land. Details about LULC conversions are shown in Fig. 4 and the rate of
con-Fig. 4. LULC conversion map.
Table 5. Rate of increment in LULC classes
S.N. LULC classes Rate of increment (%) per year Rate of decrement (%) per year
1 Forest 2.11 2 Shrubland 0.03 3 Agriculture 1.85 4 Built-up 1.06 5 Bareland 2.25 version in Table 5.
From Table 5 it seems that forest cover and built-up areas are increasing at the rate of 2.11% and 1.06% re-spectively, meanwhile, the shrubland, agriculture, and bare-land are decreasing at the rate of 0.03%, 1.85%, and 2.25% respectively.
Discussion
Classification and analysis of multi-date Landsat images of 1996 and 2017 show that Chandragiri has been experi-encing rapid LULC change. The forest area has sig-nificantly increased by 11.6% over 21 years. The result shows that almost 87% of shrubland has been converted in-to forest from 1996 in-to 2017, thus the increment in the forest is mainly due to the conversion of shrubland into forests. Community Forest User Groups (CFUGs) in the area were formed during the early 90s to conserve and restore the forest land, and to regulate the utilization of forest products. This program also included tree plantation activ-ities, the key informants also verified the extensive con-version of shrublands and bare land into forests through plantation activities. A similar trend of conversion can also be seen in other LULC change studies conducted in Nepal by various researchers like Gautam et al. (2002), Awasthi et al. (2002), and Neupane et al. (2017). Our study shows a considerable amount of conversion of forest into other
LULC classes namely: shrubland, agriculture, built-up, bareland. In recent years, climate change has become a global concern. The role of forests in climate change is con-sidered to be of utmost importance due to its role in carbon dioxide absorption, a major greenhouse gas, and also due to its effect on local climate variables like temperature and hy-drology (Bonan 1997).
A major change in land use of the area is the decrease in agricultural land by 495 ha (11.26%). The reason behind this is the conversion of agricultural land into built-up areas to accommodate increasing population and rapid urban-ization as 27.8% of agricultural land is found to be con-verted into built-up. According to the National Population and Housing Census published by Central Bureau of Statistics (CBS) in 2011, the population of Chandragiri municipality has increased from 55,032 in 2001 to 85,198 in 2011. According to Ishtiaque et al. (2017) urban area has expanded by 4.1 times in the last three decades and most of this expansion occurred with the conversions of 31% of ag-ricultural land. According to Thapa and Murayama (2009), a large share of agricultural space was transformed into urban/built-up areas in different periods, and this mainly occurred in the valley floors and neighboring villages. Most of the agricultural lands in the valley floor and near existing built-up areas (along roads in the concen-tric pattern) were transformed into urban/built-up lands (Thapa and Murayama 2009; Ishtiaque et al. 2017). According to the key informants, the increasing population and urbanization are caused due to the continuous urban sprawl originating from Kathmandu city, increasing em-ployment and business prospects, and moderate type cli-mate of the area. With the continuously increasing built-up areas (Thapa and Murayama 2009; Ishtiaque et al. 2017) it would not be wrong to predict that the urban areas will soon
replace the much-needed and essential agricultural lands in near future. Although the result shows that almost 87% of the shrubland has been converted to forest, shrubland has only decreased by 0.2%. Research by Pidwirny (2006) shows that fast-growing and invasive species of grass and bushes often cover the bare lands over some time. Our re-sult also shows that almost 60% of bareland has been con-verted into shrubland over 21 years.
Conclusion
The quantitative evidence from this study reveals a rapid LULC change in the study area. The significant change observed in Chandragiri from 1996 to 2017 was that the forest cover and built-up has increased by 11.63% and 3.68%, whereas shrubland, agriculture, and bareland has decreased by 0.15%, 11.26%, and 3.91% respectively. The most important reason for the increase in forest cover is due to the community forest program which has been in oper-ation since the early 90s in the study area. It has helped to replace the shrubland with forests and also played a major role in restoring the forests in the area. The bareland was found to be replaced by the shrubland, and agricultural land by the built-up area due to rapid urbanization and con-tinuously increasing population. The classified maps and conversion map reveals that the extent of built-up areas is mostly increasing on the valley floor in a much-dispersed manner, creating a heterogeneous and fragmented land-scape with small portions of agricultural lands in between the dispersed settlements. The most important reason for this is the migration from rural areas to urban areas of the capital city by converting agricultural land for settlements. These LULC changes can be associated with both the eco-logical as well as socioeconomic problems in the study area. Hence, to limit the undesirable effects of LULC change, a more detailed study needs to be carried out to understand the drivers of LULC.
References
Agarwal C, Green GM, Grove JM, Evans TP, Schweik CM. 2002. A review and assessment of land-use change models: dy-namics of space, time, and human choice. USDA Forest Service, Northeastern Research Station. General Technical
Report NE-297. pp 61.
Awasthi K, Sitaula B, Singh B, Bajacharaya R. 2002. Land‐use change in two Nepalese watersheds: GIS and geomorphometric analysis. Land Degrad Dev 13: 495-513.
Bonan GB. 1997. Effects of land use on the climate of the United States. Clim Change 37: 449-486.
Briassoulis H. 2000. Analysis of Land Use Change: Theoretical and Modeling Approaches. Regional Research Institute, West Virginia University, number 17, December.
Central Bureau of Statistics (CBS). 2011. National Population and Housing Census 2011 (Caste, ethnicity and mother tongue). https://cbs.gov.np/national-populationandhousing-census-2011/. Accessed 15 Oct 2020.
FAO, Global Terrestrial Observing System. 2011. Land Cover Categories.
Gautam A, Webb E, Eiumnoh A. 2002. GIS Assessment of Land Use/Land Cover Changes Associated with Community Forestry Implementation in the Middle Hills of Nepal. Mt Res Dev 22: 63-69.
Gonzales Inca CA. 2009. Assessing the land cover and land use change and its impact on watershed services in a Tropical Andean Watershed of Peru. MS thesis. University of Jyväskylä, Jyväskylän, Finland. (in English)
Ishtiaque A, Shrestha M, Chhetri N. 2017. Rapid Urban Growth in the Kathmandu Valley, Nepal: Monitoring Land Use Land Cover Dynamics of a Himalayan City with Landsat Imageries. Environments 4: 72.
Lambin EF, Rounsevell MDA, Geist HJ. 2000. Are agricultural land-use models able to predict changes in land-use intensity? Agric Ecosyst Environ 82: 321-331.
Lebow B, Patel-Weynand T, Loveland T, Cantral R. 2012. Land Use and Land Cover National Stakeholder Workshop Technical Report. Report prepared for 2013 National Climate Assessment. National Climate Assessment, Washington, DC, 73 pp. Neupane K. 2016. An assessment of land use land cover change in
Barandabhar Forest Corridor, Chitwan District, Nepal. Bachelors in Forestry Science. Tribhuvan University, Kathmandu, Nepal. (in English)
Neupane K, Gautam A, Regmi A. 2017. Trends of land cover change in a key biological corridor in Central Nepal. Asian J For 1: 64-69.
Pidwirny M. 2006. Fundamentals of Physical Geography, 2nd Edition. (The Greenhouse Effect). http://www.physicalgeography. net/fundamentals/7h.html. Assessed: 16-Dec-2020.
Thapa R, Murayama Y. 2009. Examining Spatiotemporal Urbanization Patterns in Kathmandu Valley, Nepal: Remote Sensing and Spatial Metrics Approaches. Remote Sens 1: 534-556.
Turner BL, Meyer WB, Skole DL. 1994. Global Land-Use/ Land-Cover Change: Towards an Integrated Study. Ambio 23: 91-95.
Turner II BL, Skole D, Sanderson S, Fischer G, Fresco L, Leemans R. 1995. Land-Use and Land-Cover Change, Science/Research
Plan. International Institute for Applied Systems Analysis. Stockholm, Sweden, and Geneva, Switzerland. IGBP Report No. 35/HDP Report No. 7.
Turner BL 2nd, Lambin EF, Reenberg A. 2007. The emergence of land change science for global environmental change and
sustainability. Proc Natl Acad Sci U S A 104: 20666-20671. United Nations. Department of Economic and Social Affairs.
2015. World Urbanization Prospects: The 2014 Revision. United Nations, New York, NY, 493 pp.