Food Sci. Biotechnol. Vol. 18, No. 6, pp. 1487 ~ 1494 (2009)
1487
ⓒ The Korean Society of Food Science and Technology
Effect of Maltodextrin Concentration and Drying Temperature on
Quality Properties of Purple Sweet Potato Flour
Maruf Ahmed, Mst. Sorifa Akter, Koo-Bok Chin1, and Jong-Bang Eun*
Department of Food Science and Technology and Institute of Biotechnology, Chonnam National University, Gwangju 500-757, Korea
1Department of Animal Science, Chonnam National University, Gwangju 500-757, Korea
Abstract The effects of drying temperature (55, 60, and 65oC) and addition levels of maltodextrin (MD) (10, 20, and 30%)
on the physicochemical properties and nutritional quality of purple sweet potato flour were investigated. MD-added flours had higher L* values, water soluble index, total phenolic, and anthocyanin contents than untreated flour. However, a*, b* values, water absorption index, and swelling capacity were dependent on the drying temperature and MD concentration. On the other hand, untreated flour had a higher ascorbic acid content compared to the MD-treated flour. Ascorbic acid contents decreased, whereas anthocyanin content was not significantly different, with increasing drying temperatures. MD was positively correlated with phenolic content, anthocyanin, hue angle, and water soluble index. However, there was no correlation between quality parameters and glass transition temperature. The best quality product was obtained when samples were pretreated with MD before drying, regardless of drying temperature.
Keywords: sweet potato, maltodextrin, drying, quality attribute, glass transition temperature Introduction
Purple-fleshed sweet potatoes have an intense purple color in their storage roots due to the accumulation of anthocyanins (1). The anthocyanins in purple sweet potato are mono- or-di-acylated forms of cyanidin and peonidin (2). Purple sweet potato flour anthocyanins are biologically beneficial, by virtue of their free radical scavenging and antimutagenic, anticarcinogenic, and antihypertensive effects (3). Sweet potatoes can be processed into flour, which is less bulky and more stable than the highly perishable fresh root. The flour can be used as a thickener in soup, gravy, fabricated snacks, and bakery products (4). It can also be used to enhance food products through color, flavor, natural sweetness, and supplemented nutrients. Sweet potato flour can substitute for wheat and other cereal flours, especially for individuals diagnosed with celiac disease (5).
Preservation of food by drying is an ancient technique that has been technologically refined in the last century. Dehydrated sweet potato is commonly been obtained by hot air drying, which allows rapid and massive processing, although the processing markedly influences the sensory and nutritional characteristics of the end product. To reduce the drying time and retain the quality of fruits and vegetables, various pretreatment methods (chemical, thermal, and physical) have been investigated (6,7). Among different drying process, freeze- and spray-drying produce the highest product quality. But, the relatively high production cost is a major drawback.
Carbohydrates have been used as wall material to microencapsulate food ingredients. The food industry is
currently emphasizing the use of natural rather than synthetic ingredients. Maltodextrins (MDs) are polysaccharides consisted of α (1-4) linked D-glucose produced by acid or
enzymatic hydrolysis of corn starch (8). MDs are water-soluble materials that can protect encapsulated ingredients from oxidation (9), and which have been used in different drying regimens including spray-, drum-, and freeze-drying (10). MD also facilitates retention of some food properties such as nutrients, color, anthocyanin, and flavor during drying and storage (10-12). Some studies have explored the use of carrier agents such as MD and gum arabic to protect sensitive compounds like vitamin C in fruit juice and to increase product stability in powder (10-12). But, there are no reports on hot air-drying using MD to produce flour from purple sweet potato. Therefore, the objective of the present study was to investigate the effects of drying temperatures and exposure to different MD concentrations on the physicochemical properties and nutritional qualities of purple sweet potato flour.
Materials and Methods
Raw material Sweet potato (Ipomoea batatas L. Lam cv. Sinjami) was purchased from a local farm and stored at 14oC until used. The samples were washed with tap water
to remove dirt and soil and peeled with a 27 stainless hand peeler (Han Sung, Gwangju, Korea). Peeled samples were kept in tap water to prevent enzymatic darkening. The samples were then cut into 1 mm thick slices using a slicing machine (Model HFS 350G; Fujee, Suwon, Korea). Sample preparation and treatment Sweet potatoes slices were treated by dipping in 10, 20, and 30%(w/v) maltodextrin (DE 20; Samyang Genex, Seoul, Korea) in water at room temperature for 2 min. Controls were dipped in distilled water at the same temperature and time conditions.
*Corresponding author: Tel: +82-62-530-0255; Fax: +82-62-530-2149 E-mail:[email protected]
Received August 7, 2009; Revised September 8, 2009; Accepted September 9, 2009
1488 M. Ahmed et al. Preparation of sweet potato flour The slices were dried
with a drying oven (Dasol Scientific, Seoul, Korea) 55, 60, and 65oC for 7-8 hr. The flour (moisture content 6%) was
obtained by milling the dried slices using a FM-681C blender (Hanil, Gwangju, Korea) and sieveing through an 80 mesh screen (Chung-gye-sang-gongsa, Seoul, Korea) to obtain sweet potato flour.
Proximate compositions of sweet potato flour Moisture, crude protein, ash, and fat contents of flours were determined by AOAC method (13).
Hunter color values The color attributes (Hunter L*, a*, and b* values) were measured with a CM-3500d spectrophotometer (Minolta, Tokyo, Japan). Total color difference was calculated as ∆E=[(∆L*)2+(∆a*)2+(∆b*)2]1/2 (14). The total color difference was calculated for the maltodextrin treated samples as compared to the control sample.
Water solubility index (WSI) and water absorption index (WAI) WSI and WAI were determined according to the method described by Grabowski et al. (14). Sweet potato flour (2.5 g) and 30 mL water were vigorously mixed in a 50-mL centrifuge tube; the mixture was incubated in a water bath at 30oC for 30 min, and centrifuged at
2,090×g for 15 min. The supernatant was collected in a pre-weighed petri dish and the residue was weighed after oven-drying overnight at 105oC. The amount of solids in
the dried supernatant as a percentage of the total dry solids in the original 2.5 g sample was an indicator of WSI. WAI was calculated as the weight of the solid pellet remaining after centrifugation divided by the amount of dry sample. Swelling capacity (SWC) SWC was determined according to Lai and Cheng (15) using the equation
SWC=weight of sediment (ws)/[dry weight of sample×
SWC=(1−ws%/100)]
Viscosity The viscosity was measured by Brookfield viscometer (DV-II+ pro; Brook-field Engineering Laboratories, Middleboro, MA, USA) using spindle No. 4 at 60 rpm. Viscosity was performed using 50 mL sample at room temperature (25±2oC) and value expressed as centipoise
(cp).
Total phenolics Total phenolics in the sweet potato flours were determined with Folin-Ciocalteu reagent according to a slightly modified method described by Huang et al. (16). The sample (0.1 g) was extracted 3 times with 20 mL of 75% methanol and filtered through Whatman No. 2 filter paper. Extracts were combined and concentrated in a rotary vacuum evaporator (Model Heidolph, DE/VV-2011; Rikakikai, Tokyo, Japan) at 40oC; the volume was adjusted
to 20 mL with 75% methanol. One mL of extract, 5 mL of distilled water and 2 mL of 10% Folin-Ciocalteau reagent were added to a Falcon tube. After 3min at room temperature, 2 mL of 7.5% Na2CO3 solution was added and the sample
was diluted to 20 mL with distilled water. Each sample was allowed to stand for 1 hr at room temperature and absorbance was measured at 760 nm using a model UV-1201 spectrometer (Shimadzu, Tokyo, Japan). Total phenolics
were calculated on the basis of the calibration curves of gallic acid, and expressed as mg gallic acid/100 g. Anthocyanin content Content of anthocyanins was determined by following the procedures of Giusti and Wrolstad (25) and Huang et al. (16).The sweet potato flour (1 g) was treated with 15 mL HCl-methanol (0.15% HCl: methanol=15:85) for 4 hr. The extract was filtered and its absorbance was determined at 530 nm. Anthocynin content (mg/100 g d.w.) was calculated on the basis of the following equation:
Anthocynin content=(A×Mw×DF×100)/(ε×W) where A=absorbance, Mw=molecular weight of cyaniding-3 glucoside chloride (C21H21ClO11, 484.84 Da), DF=dilution
factor, ε=molar absorptivity (34,300), W=sample weight (g)
Ascorbic acid Ascorbic acid content was determined according to the method of Egoville et al. (17). Sweet potato flour (1 g) was treated with 20 mL of 0.4% oxalic acid at room temperature for 5 min and filtered through Whatman No. 4 filter paper. The filtrate (1 mL) was mixed with 9 mL of 2,6-dichlorophenolindophenol and the absorbance was read within 15 min at 520 nm against a blank. Ascorbic acid content was calculated on the basis of the calibration curves of ascorbic acid, and was expressed as mg/100 g of ascorbic acid.
Glass transition temperature (Tg) A differential
scanning calorimeter (DSC, S-650; Scinco, Seoul, Korea) equipped with a thermal analysis station was calibrated using mercury. Approximately 5-10mg of sample was prepared in aluminum pans. The heating program increased the sample temperature from −70 to 120oC at a rate of 10oC/min followed by cooling to 30oC at the same rate.
Heating and cooling were performed in an atmosphere of nitrogen gas. An empty pan was used as a reference. Glass transition was analyzed using a DSC equipped with Pyris thermal analysis with Infinity PRO software version 4.2.64 (Scinco). Glass transition was taken at the midpoint of the glass transition range. Thermograms were examined for onset temperature (Tgi) and end point temperature (Tge) of
the glass transition region. The glass transition midpoint (Tgm) value was calculated as the average of the onset and
end points values and reported as the glass transition temperature (18).
Scanning electron microscopy (SEM) Flour granule morphology was examined using SEM. Sample was mounted on an aluminium specimen holder by double-sided tape. The specimen holder was loaded in an Emitech K550 sputter coater (Emitech, East Grinstead, UK). The sample was coated with gold palladium, with a thickness of about 15 nm and viewed using an S-2400 instrument (Hitachi, Tokyo, Japan) operated at an accelerating voltage of 10 KV.
Statistical analyses All measurements were performed in triplicate for each sample. Data were analyzed using SPSS for Windows Version 14.0 (SPSS, Chicago, IL, USA). One-way analysis of variance (ANOVA) was
Maltodextrin-treated Sweet Potato Flour 1489 carried out to determine the overall effect of treated
untreated and drying temperatures on each of the assays. Significant differences between the means were estimated using Duncan’s multiple range tests. Differences were considered to be significant at p<0.05.
Results and Discussion
Physicochemical properties Proximate compositions of sweet potato flour prepared with different MD concentrations and drying temperatures are shown in Table 1. Moisture, ash, and fat contents of sweet potato flour ranged from 5.16-6.81, 2.49-3.32, and 0.77-1.8%, respectively, which were similar to those reported previously (19). Moisture and ash contents of flours from untreated and MD-treated sweet potatoes were similar to each other. During drying, ash content increased with increasing drying temperature. The increased ash content could also be due increased overall sweet potato solid. There were no significant differences in fat and protein of treated and untreated flours among different MD concentration and drying temperatures. The protein content in sweet potato flour is generally low, ranging from 1.0-8.5% (19). Consistent with this, presently protein content ranged from 2.16-3.22%.
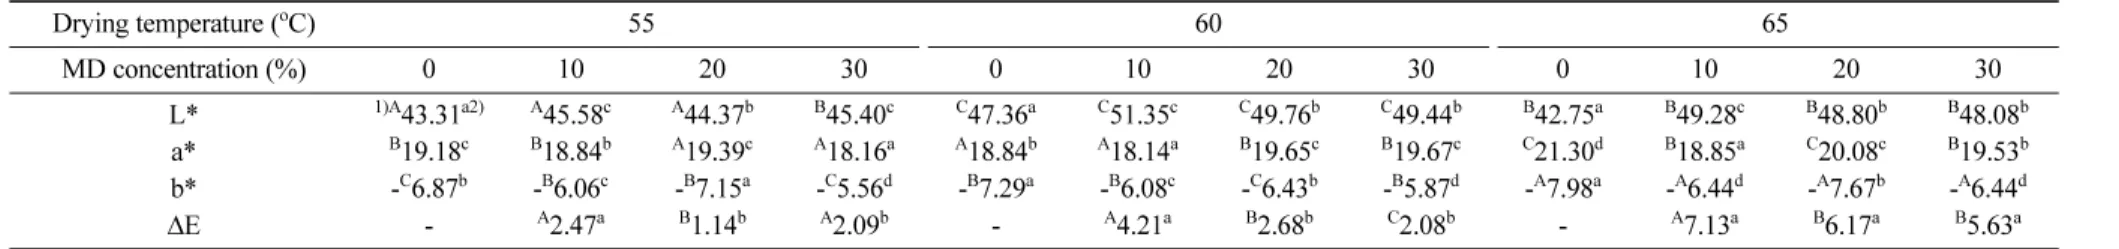
Hunter color values Hunter color parameters, L*, a*, b*, and ∆E have been widely used to describe color change during dehydration of fruit and vegetables products. These values of sweet potato flours were measured with different MD concentrations and drying temperatures (Table 2). MD-treated flours had higher L* values than did the untreated flours. This observation was similar to that obtained previously (14). L* values slightly decreased with increasing MD concentration. In terms of drying temperatures, all flours had higher L* values at 60oC; with increased
drying temperature L* decreased. This variation may be due to the changes of total phenolic content. Rocha and Morais (20) found levels of phenols to be associated with the color change, particularly lightness. L* values were positively correlated with MD and phenolic content. Hunter a* and b* values were dependent on drying temperature and MD concentrations. The changes of a* and b* values may be attributable to formation of polymeric anthocyanin (2). Presently, all flours showed color values similar to those reported by Yang and Gadi (2). The color values for MD-treated flours could be best described by the change in total color difference (∆E) values. The lower total ∆E values may be due to loss of phenolic and anthocyanin content. The ∆E values were highly correlated with phenolic and anthocyanin contents.
WAI, WSI, SWC, and viscosity WAI, WSI, SWC, and viscosity of sweet potato flours are shown in Table 3. MD-treated flours had lower WAI than unMD-treated flours. WAI of untreated flours decreased with increasing drying temperatures. On the other hand, MD-treated flours had lower WAI at 60oC compared to that at 55oC except for 30% MD-treated
flour; WAI was lower at 55oC, with WAI subsequently
increasing with increasing drying temperature. The variation in WAI could be due to differences in the degree of engagement of hydroxyl groups to form hydrogen and covalent bonds between starch chains. The increase in WAI
is associated with the loss of starch crystalline structure (21). MD-treated flours had higher WSI than that untreated flours. This variation may be attributed to the fact that MD has superior solubility (22). WSI of MD-treated flours increased with increasing MD concentration and drying temperatures for all flours. However, untreated flours had lower WSI at 60oC than at 55oC, with WSI subsequently
increasing with increasing drying temperature. According to Eliasson and Gudmundsson (23), the low solubility at low temperature can be attributed to the semi-crystalline structure of the starch granules and the hydrogen bonds formed between hydrogen groups in the starch molecules. As the temperature increases, the solubility increases due to the disruption of starch granules and exposure of hydrophilic groups. Presently, WAI and WSI were negatively and positively correlated with MD, respectively. SWC depends on MD concentration and drying temperature. All samples had lower SWC at 60oC, except for 30%
MD-treated flour; SWC was lower at 55oC and increased with
increasing drying temperature. Low SWC is caused by the presence of a large number of crystallites, which increase granular stability, thereby reducing the extent of granular swelling. When starch is gelatinized at a certain temperature, the molecular organization is disrupted within the granules and the starch-water interactions increase, resulting in a substantial increase in swelling (21,23). MD-treated flours had higher viscosity than untreated flours. Viscosity increased with increasing MD concentration. This may be due to the interaction between MD and polysaccharides present in sweet potato. However, viscosity decreased at a higher drying temperature for all samples due to the intermolecular interaction and hydration of molecules. Anthocyanin contents The anthocyanin content of the flours with treatment of different MD concentrations and drying temperatures ranged from 35.98-41.18 mg/100 g (Table 4). The content of anthocyanin was much similar than that of steamed or kneaded flours (16). MD-treated flours had higher anthocyanin contents than untreated flours. These results are consistent with a previous study (24) that reported anthocyanin from pomace was increased by encapsulation with DE 20 MD. The same study further reported that MD could stabilize the anthocyanin pigment due to reduction of water activity. Presently, anthocyanin content increased with increasing drying temperatures for all samples, even though the values were not significantly different. This might be due to much higher amounts of acylated anthocynins present in flour samples. Giusti and Wrolstad (25) indicated that acylated anthocynin exhibits unusual stability in neutral or weakly acidic media. Acylation improves the stability of anthocyanins through intermolecular copigmentation (25). Anthocyanin was highly correlated with MD and color L* values.
Total phenolic content The total phenolic content of sweet potato flours ranged from 9.55-12.24 mg/100 g (Table 4). The phenolic contents of the flours were comparable to that of raw sweet potato flour, and steamed and kneaded sweet potato flour (16). MD-treated flours had higher total phenolic content as compared to untreated flour. Possible explanations for this difference are interference of MD with phenolic compounds during analysis (24) and that, in
14 90 M . A hm ed e t al.
Table 1. Effect of MD concentration and drying temperatures on proximate analysis of sweet potato flour
Drying temperature (oC) 55 60 65
MD concentration (%) 0 10 20 30 0 10 20 30 0 10 20 30
Moisture (%) 1)AB6.15a2) A6.81a B5.74b AB6.39a AB5.72a AB5.43b B5.16c A6.17a A5.20a A5.69b A5.68a A6.18a Ash (%) B2.84c AB2.80b B2.75c C2.49c A3.14b C2.87c B2.96b AB3.05b AB3.27a A3.13a A3.32a B3.21a Protein (%) A2.25a A2.53a A2.63a A2.79ab A2.70a A2.40a A2.95a A3.05a AB2.48a B2.18a A3.22a B2.16a Fat (%) A1.72a A1.54a A1.76a A1.80a A1.44a A1.28a A1.75a A1.55a A1.16a A0.84a A0.77a A1.31a
1)Means followed by different uppercase letters in each row are significantly different among drying temperatures (p<0.05). 2)Means followed by different lowercase letters in each row are significantly different among flour samples (p<0.05).
Table 2. Effect of MD concentration and drying temperatures on Hunter color values of sweet potato flour
Drying temperature (oC) 55 60 65 MD concentration (%) 0 10 20 30 0 10 20 30 0 10 20 30 L* 1)A43.31a2) A45.58c A44.37b B45.40c C47.36a C51.35c C49.76b C49.44b B42.75a B49.28c B48.80b B48.08b a* B19.18c B18.84b A19.39c A18.16a A18.84b A18.14a B19.65c B19.67c C21.30d B18.85a C20.08c B19.53b b* -C6.87b -B6.06c -B7.15a -C5.56d -B7.29a -B6.08c -C6.43b -B5.87d -A7.98a -A6.44d -A7.67b -A6.44d ∆E - A2.47a B1.14b A2.09b - A4.21a B2.68b C2.08b - A7.13a B6.17a B5.63a
1)Means followed by different uppercase letters in each row are significantly different among drying temperatures (p<0.05). 2)Means followed by different lowercase letters in each row are significantly different among flour samples (p<0.05).
Table 3. Effect of MD concentration and drying temperatures on WAI, WSI, SWC, and viscosity of sweet potato flour
Drying temperature (oC) 55 60 65 Maltodextrin concentration (%) 0 10 20 30 0 10 20 30 0 10 20 30 WAI 1)C2.45c2) B2.34b B2.36bc A2.22a B2.40b A2.23b A2.19a B2.30c A2.39b C2.37c B2.34b C2.33c WSI (%) B34.65a A34.72a A35.77b A36.94c A32.56a B37.44c A37.50b C40.69d C38.96a C39.62b C39.68ab B41.66a SWC B3.76d A3.59b B3.67c A3.52a A3.57b A3.59b A3.46a B3.89c C3.88ab B4.00c C3.86a B3.93b Viscosity (cp) A84.567c A93.10b A94.53b A118.90a B36.667b B36.70b B37.33b B49.43a C27.76b B34.43ab B35.13ab C 38.86a
1)Means followed by different uppercase letters in each row are significantly different among drying temperatures (p<0.05). 2)Means followed by different lowercase letters in each row are significantly different among flour samples (p<0.05).
M alto de xtr in-tre ate d S w eet P ota to F lou r 14 91
Table 4. Effect of MD concentration and drying temperatures on anthocyanin content, total phenolic, and ascorbic acid content of sweet potato flour
Drying temperature (oC) 55 60 65
Maltodextrin concentration (%) 0 10 20 30 0 10 20 30 0 10 20 30
Anthocyanin (mg/100 g) 1)A35.98a2) A38.99b A39.38b A39.90b A36.87a A36.84ab A39.74ab A41.04ab A36.68a A40.20b A39.91b A41.18b Total phenolic (mg/100 g) B9.74a A11.76c B11.97c A11.10c C10.04a A11.50d A11.16b B11.37c A9.55a B12.24b B12.11b C12.23b Ascorbic acid (mg/100 g) B22.08c B20.35b B21.17bc A18.42a B20.92b B19.65ab B20.43b A18.24a A14.47c A11.90ab A12.20b B10.92a
1)Means followed by different uppercase letters in each row are significantly different among drying temperatures (p<0.05). 2)Means followed by different lowercase letters in each row are significantly different among flour samples (p<0.05).
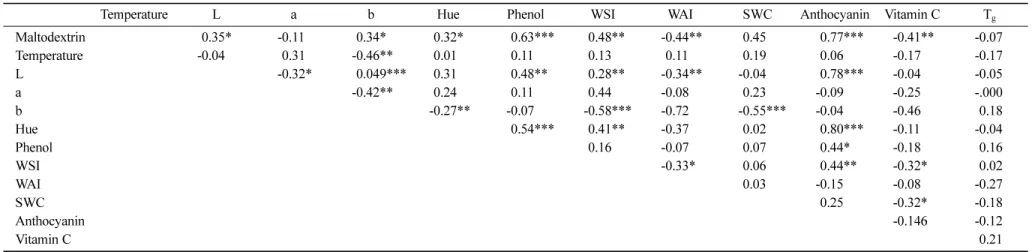
Table 5. Pearson’s correlation coefficient of among quality attributes1)
Temperature L a b Hue Phenol WSI WAI SWC Anthocyanin Vitamin C Tg
Maltodextrin -0.35* -0.11 -0.34* -0.32* -0.63*** -0.48** -0.44** -0.45 -0.77*** -0.41** -0.07 Temperature -0.04 -0.31 -0.46** -0.01 -0.11 -0.13 -0.11 -0.19 -0.06 -0.17 -0.17 L -0.32* -0.049*** -0.31 -0.48** -0.28** -0.34** -0.04 -0.78*** -0.04 -0.05 a -0.42** -0.24 -0.11 -0.44 -0.08 -0.23 -0.09 -0.25 -.000 b -0.27** -0.07 -0.58*** -0.72 -0.55*** -0.04 -0.46 0.18 Hue -0.54*** -0.41** -0.37 -0.02 -0.80*** -0.11 -0.04 Phenol -0.16 -0.07 -0.07 -0.44* -0.18 0.16 WSI -0.33* -0.06 -0.44** -0.32* 0.02 WAI -0.03 -0.15 -0.08 -0.27 SWC -0.25 -0.32* -0.18 Anthocyanin -0.146 -0.12 Vitamin C 0.21
1)WSI, water solubility index; WAI, water absorption index; SWC, swelling capacity; T
1492 M. Ahmed et al.
untreated samples, some phenolic compounds were more hydrolyzed or oxidized than in treated samples because dispersions were prepared in the presence of ambient oxygen. Shahidi and Han (9) reported that water-soluble MD protects encapsulated ingredients from oxidation. Presently, total phenolic content was unaltered or slightly decreased with increasing MD concentration. The changes of total phenolic content may be attributed to the destruction of active compounds. Total phenolic content decreased at a higher drying temperature for untreated flour, whereas it increased for MD-treated flours. This may reflect changes in the phenolic composition and contents that might occur upon MD addition and drying. Laine et al. (26)demonstrated that phenolic compounds such as flavonols may form complexes with polysaccharides such as starch, and that the affinity of phenolics to polysaccharides depends on water solubility, molecular size, conformational mobility, and shape of the polyphenol. Total phenolic content highly correlated with MD.
Ascorbic acid content MD concentrations and drying temperatures affected the ascorbic acid content of sweet potato flours are shown in Table 4. The ascorbic acid content of sweet potato flours ranged from 10.92-22.08 mg/100 g, similar to previously reported values (16). Untreated flours had a higher retention of ascorbic acid than MD-treated flours. The ascorbic acid content was unaltered or slightly decreased with increased MD concentration. These results agree with a previous study (14) that reported MD addition decreased the overall sweet potato solids, decreasing the amount of vitamin C.Drying of sweet potato flour decreased the ascorbic acid decreased. It is well-known that ascorbic acid is relatively unstable to heat, oxygen, and light. Drying temperatures had a detrimental effect on the retention of ascorbic acid since heated air inherently exposes the products to oxidation, reducing their ascorbic acid content (27). Glass transition temperature (Tg) The thermograms of
air-dried untreated and MD-treated sweet potato flours at 55, 60, and 65oC are shown in Fig. 1-3. The T
g of treated
and untreated flours were approximately 37.5-38.5oC.
However, presently, the values of glass transition temperature for all flour samples were lower than those previously reported (14). This may be due to the use of different operating conditions and variety of sweet potato. Since no clear differences were observed between Tg of
samples obtained with and without MD and using different drying temperatures beyond those due to variable moisture content. Small difference of Tg values for MD pre-treated
samples can be explained by gain solutes. Telis and Sobral (28) observed only small differences between Tg of fresh
and osmotically-treated tomato, and attributed this result to the short time adopted for the osmotic treatment, which led to low solute gain. Similarly, Del Valle et al. (29) suggested the same behavior was responsible for small differences in Tg resulting from osmotic treatment of apple cylinders in
sucrose solutions. Slade and Levine (30) reported that the addition of sugar resulted in increased mobility of starch mixtures leading to decreased Tg of the amorphous
starch-sugar-water matrix. There were no relationship between Tg
Fig. 1. DSC thermographs showing the glass transition temperature (Tg) of air-dried at 55oC sweet potato flour with
increasing levels of maltodextrin concentration. a, 0%; b, 10%; c, 20%; and d, 30%.
Fig. 2. DSC thermographs showing the glass transition temperature (Tg) of air-dried at 60oC sweet potato flour with
increasing levels of maltodextrin concentration. a, 0%; b, 10%; c, 20%; and d, 30%.
Fig. 3. DSC thermographs showing the glass transition temperature (Tg) of air-dried at 65oC sweet potato flour with
increasing levels of maltodextrin concentration. a, 0%; b, 10%; c, 20%; and d, 30%.
Maltodextrin-treated Sweet Potato Flour 1493
and quality attributes in sweet potato flours. To the best of our knowledge, this is the first report indicating the effect of different MD concentrations and hot air drying temperatures on Tg in purple sweet potato flour.
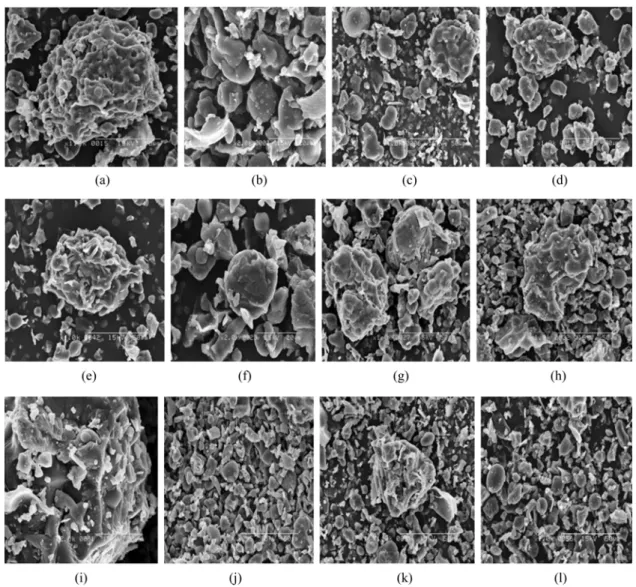
Microstructure Scanning electron micrographs (SEM) of sweet potato flour prepared with different concentrations of MD and drying temperatures are presented in Fig. 4. SEM micrographs showed that the particle size of without MD-treated flours at 55, 60, and 65oC were approximately
9.79, 18.67, and 9.53µm respectively. On the other hand, 10, 20, and 30% MD-treated flours particle size ranged from 21.48 to 10.59, from 17.31 to 15.43 and from 15.94 to 11.59µm approximately. The granules from the MD-treated flour were more disrupted than those of unMD-treated flour. This variation might be attributed to the interaction between MD and polysaccharides present in sweet potatoes. At higher drying temperatures, MD-treated flour was more disrupted as compared to lower drying temperatures. This could weaken molecular interactions at elevated temperature. These results agreement with the observations of Grabowski et al. (14), who reported that potato starch granules are
disrupted through interaction between MD and polysaccharides present in sweet potatoes.
In conclusion,the addition of various levels of maltodextrin and different drying temperature on the physicochemical and nutritional properties of sweet potato flours were investigated in this study. These results indicate a potential influence of MD treatment on quality characteristics of sweet potato flours as compared to untreated flour. Therefore, the nutrient composition of MD-treated flour could be used to make a higher quality product that would be more attractive to product developers and consumers. Further studies will be aimed at increasing the retention of nutrients during storage.
References
1. Terahara N, Konczak I, Ono H, Yoshimoto M, Yamakawa O. Characterization of acylated anthocyanins in callus induced from storage root of purple-fleshed sweet potato, Ipomoea batatas L. J. Biomed. Biotechnol. 5: 279-286 (2004)
2. Yang J, Gadi RL. Effects of steaming and dehydration on anthocyanins, antioxidant activity, total phenols, and color characteristics of purple-fleshed sweet potatoes (Ipomoea batatas).
Fig. 4. Microstructure of sweet potato flours treated with different concentrations of MD and drying temperatures. Air-dried at 55oC (a, b, c, d), 60oC (e, f, g, h), and 65oC (i, j k, l) after treatment with different concentration of MD (0, 10, 20, and 30%, respectively).
1494 M. Ahmed et al.
Am. J. Food Technol. 3: 224-234 (2008)
3. Oki T, Masuda M, Furuta S, Nishiba Y, Terahara N, Suda I. Involvement of anthocyanins and other phenolic compounds in radical-scavenging activity of purple-fleshed sweet potato cultivars. J. Food Sci. 67: 1752-1756 (2002)
4. Cho SA, Yoo BS. Rhelogical behavior of sweet potato starch-glucose composition. Food Sci. Biotechnol. 17: 417-420 (2008) 5. Caperuto L, Amaya-Farfan J, Camargo CRO. Performance of
quinoa (Chenopodium quinoa wild) flour in the manufacture of gluten-free spaghetti. J. Sci. Food Agr. 81: 95-101 (2000) 6. Utomo JS, Cheman YB, Rahman RA, Saad MS. The effect of
shape, blanching methods, and flour on characteristics of restructured sweet potato stick. Int. J. Food Sci. Tech. 43: 1896-1900 (2005)
7. Chen JP, Tai CY, Chen BH. Effects of different treatments on the stability of carotenoids in Taiwanese mango (Mangifera indica L). Food Chem. 100:1005-1010 (2005)
8. Regan OJ, Mulvihill DM. Preparation, characterisation, and selected functional properties of sodium caseinate-maltodextrin conjugates. Food Chem. 115: 1257-1267 (2009)
9. Shahidi F, Han XQ. Encapsulation of food ingredients. Crit. Rev. Food Sci. 33: 501-547 (1993)
10. Desobry SA, Netto FM, Labuza T. Comparison of spray drying, drum drying, and freeze drying for beta carotene encapsulation and preservation. J. Food Sci. 62: 1158-1162 (1997)
11. Righetto AM, Netto FM. Effect of encapsulation materials on water sorption, glass transition, and stability of juice from immature acerole. Int. J. Food Prop. 8: 337-346 (2005)
12. Dib Taxi CMA, De Menezes HC, Santos AB, Grosso CRF. Study of the microcapsultion of camu-camu (Myrciaria dubnia) juice. J. Microcapsul. 20: 443-448 (2003)
13. AOAC. Official Methods of Analysis. 16th ed. Method 973.18. Association of Official Analytical Chemistry, Washington, DC, USA (1995)
14. Grabowski JA, Truong VD, Daubert CR. Spray drying of amylase hydrolyzed sweet potato puree and physicochemical properties of powder. J. Food Sci. 71: E209-E217 (2006)
15. Lai HM, Cheng HH. Properties of pregelatinized rice flour made by hot air or gum puffing. Int. J. Food Sci. Tech. 39: 201-212 (2004) 16. Huang YC, Chang YH, Shao YY. Effects of genotype and treatment
on the antioxidant activity of sweet potato in Taiwan. Food Chem.
98: 529-538 (2006)
17. Egoville MJ, Sullivan JF, Kozempel MF, Jones WJ. Ascorbic acid determination in processed potatoes. Am. Potato J.65: 91-97 (1998) 18. Bhandari BR, Datta N, Crooks R, Howes T, Rigby SA. Semi empirical approach to optimize the quality of drying aids required to spray dry sugar-rich foods. Dry.Technol. 15: 2509-2525 (1997) 19. Van Hal M. Quality of sweet potato flour during processing and
storage. Food Rev. Int. 16: 1-37 (2000)
20. Rocha AM, Morais AM. Polyphenoloxidase activity and total phenolic content as related to browning of minimally processed ‘Jonagored’ apple. J. Sci. Food Agr. 82: 120-126 (2001)
21. Gunaratne A, Hoover R. Effect of heat-moisture treatment on the structure and physicochemical properties of tuber and root starches. Carbohyd. Polym. 49: 425-437 (2002)
22. Goula MA, Adamopoulos KG. Effect of maltodextrin addition during spray drying of tomato pulp in dehumidified air: II. Powder properties. Dry. Technol. 26: 726-737 (2008)
23. Eliasson AC, Gudmundsson M. Starch: Physicochemical and functional aspects. pp. 431-503. In: Carbohydrates in Food. Eliasson A-C (ed). Marcel Dekker, Inc., New York, NY, USA (1996) 24. Delgado-Vargas F, Jimenez AR, Paredes-Lopez O. Natural
pigments: Carotenoids, anthocyanins, and betalains-characteristics, biosynthesis, processing, and stability. Crit. Rev. Food Sci. 40: 173-289 (2000)
25. Giusti MM, Wrolstad RE. Acylated anthocyanins from edible sources and their applications in food systems. Biochem. Eng. J. 14: 217-225 (2003)
26. Laine PA, Kylli PI, Heinonen MA, Jouppila KI. Storage stability of microencapsulated coludberry (Rubus chamaemorus) phenolics. J. Agr. Food Chem. 56: 11251-11261 (2008)
27. Lin TM, Durance TD, Scaman CH. Characterization of vacuum, microwave, air, and freeze-dried carrot slices. Food Res. Int. 31: 111-117 (1998)
28. Telis VRN, Sobral PJA. Glass transition for freeze-dried and air-dried tomato. Food Res. Int. 35: 435-443 (2001)
29. Del Valle JM, Cuadros TRM, Aguilera JM. Glass transition and shrinkage during drying and storage of osmosed apple piece. Food Res. Int. 31: 55-65 (1998)
30. Slade L, Levine H. Beyond water activity: Recent advantages based on an alternative approach to the assessment of food quality and safety. Crit. Rev. Food Sci. 30: 115-360 (1991)