1. Introduction
Flood monitoring has been one of the hot issues in natural disaster monitoring area using satellite images.
Flood-affected area analysis has two procedures: the first procedure is to detect water body in before-and- after images of flood and the second one is to transform
the before and after images into one image coordinate system for image registration. Many methods have been proposed to detect water body by thresholding an index image, which is created using spectral reflectance measurements (Mcfeeters, 1996; Rogers and Kearney, 2004; Xu, 2006; Ji et al., 2009). The thresholding-based method has been also employed to extract water body
Extraction of water body in before and after images of flood using
Mahalanobis distance-based spectral analysis
Chul-Soo Ye†
Department of Ubiquitous IT, Far East University
Abstract :Water body extraction is significant for flood disaster monitoring using satellite imagery.
Conventional methods have focused on finding an index, which highlights water body and suppresses non- water body such as vegetation or soil area. The Normalized Difference Water Index (NDWI) is typically used to extract water body from satellite images. The drawback of NDWI, however, is that some man-made objects in built-up areas have NDWI values similar to water body. The objective of this paper is to propose a new method that could extract correctly water body with built-up areas in before and after images of flood. We first create a two-element feature vector consisting of NDWI and a Near InfRared band (NIR) and then select a training site on water body area. After computing the mean vector and the covariance matrix of the training site, we classify each pixel into water body based on Mahalanobis distance. We also register before and after images of flood using outlier removal and triangulation-based local transformation. We finally create a change map by combining the before-flooding water body and after-flooding water body. The experimental results show that the overall accuracy and Kappa coefficient of the proposed method were 97.25% and 94.14%, respectively, while those of the NDWI method were 89.5% and 69.6%, respectively.
Key Words :
Mahalanobis distance, water body extraction, normalized difference water index, flood monitoringReceived July 7, 2015; Revised August 12, 2015; Accepted August 13, 2015.
†Corresponding Author: Chul-Soo Ye ([email protected])
This is an Open-Access article distributed under the terms of the Creative Commons Attribution Non-Commercial License (http://creativecommons. org/licenses/by-nc/3.0) which permits unrestricted non-commercial use, distribution, and reproduction in any medium, provided the original work is properly cited
Article
in SAR imagery (Matgen et al., 2011; Kuenzer et al., 2013; Martinis et al., 2015).
The NDWI is typically used to extract water body from satellite images (Mcfeeters, 1996). Water body in the NDWI image has higher value than vegetation or soil areas. Some pixels of built-up area in the NDWI image, however, also have similar values to those of water body (Xu, 2006; Xu, 2008). As a result, the pixels of built-up area are detected together with water body when a threshold value is applied to the NDWI image.
Therefore, we need additional spectral information as well as the NDWI to extract correctly water body with built-up area.
Considering the near infrared reflectance of water is lower than the reflectance in visible range such as blue, green and red bands, we can impose this constraint to identify water body in the NDWI image. In this paper we employ a statistical approach to combine the NDWI and the near infrared reflectance information and apply this method to extract water body from high resolution optical satellite images.
2. Methodology
1) Combination of NDWI and NIR information The NDWI is calculated as follows (Mcfeeters,
1996):
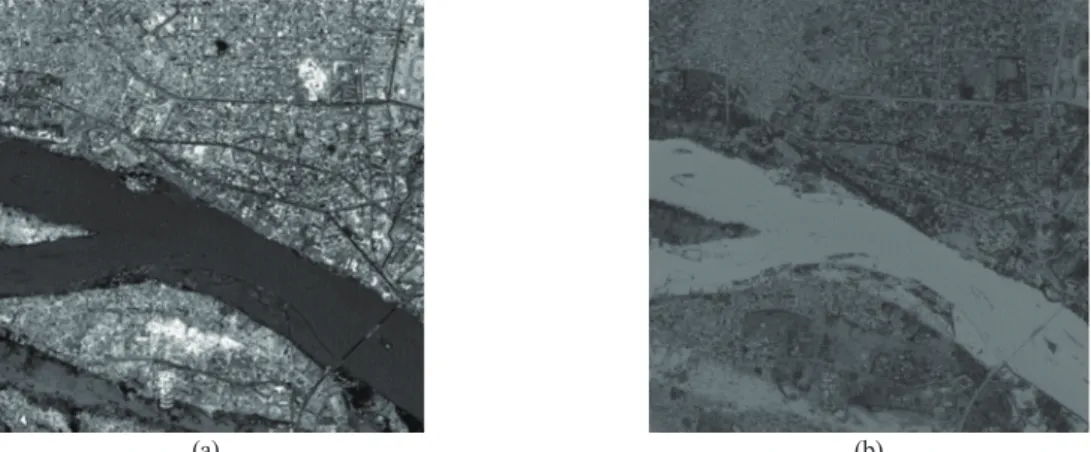
NDWI = (1) where G is a green band and NIR is a near infrared band. While the reflectance of water at the green band is positive, the reflectance of water at the near infrared almost zero. As a result, water body will have high NDWI values, while other ground features such as vegetation or soil will have low values. Fig. 1(a) shows a part of Kompsat-2 panchromatic satellite image. The area with dark grey color is water body. Water body has relatively high value in the NDWI image created using equation (1) (Fig. 1(b)).
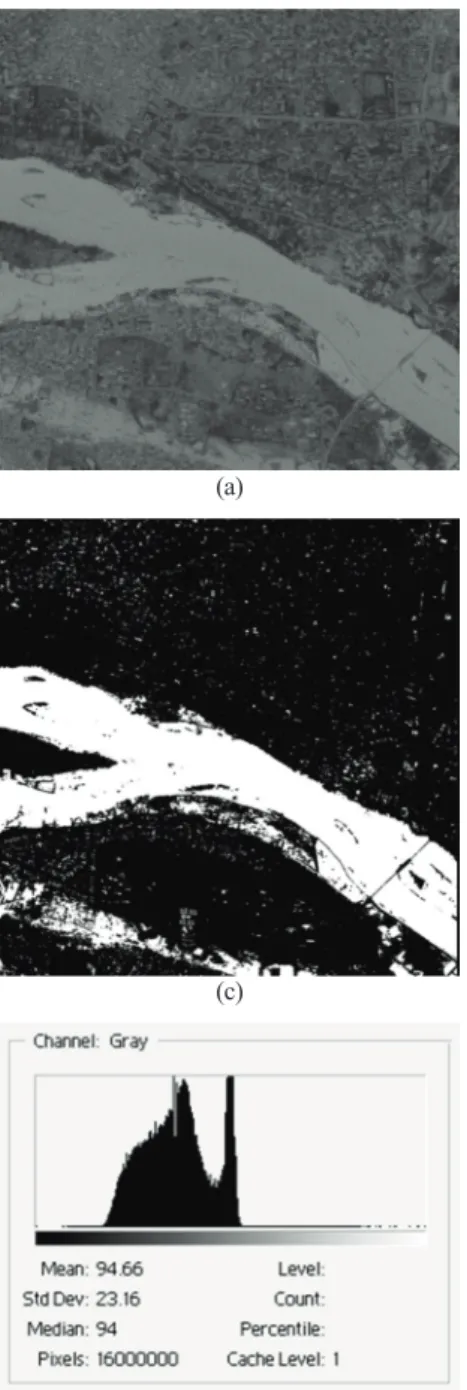
A drawback of the NDWI is that some man-made objects in built-up area have NDWI values similar to water body. Fig. 2 shows the NDWI and binary NDWI images obtained from Kompsat-2 and Kompsat-3 images, respectively. Many man-made objects such as buildings and roads exist close to a river. We classified each pixel as water body, if its NDWI value is higher than a threshold value T
B. The threshold value T
Bwas selected manually as the valley points T
B= 117 and T
B= 159 between two peaks in the two histograms, respectively. Many pixels in the built-up area were detected together with water body pixels in each binary NDWI image. This means that we need additional spectral information as well as the NDWI to extract
G _ NIR G + NIR
Fig. 1. The NDWI image created using a green band and a NIR band of Kompsat-2 image (a) the Kompsat-2 panchromatic image (b) the NDWI image.
(a) (b)
correctly water body with built-up area.
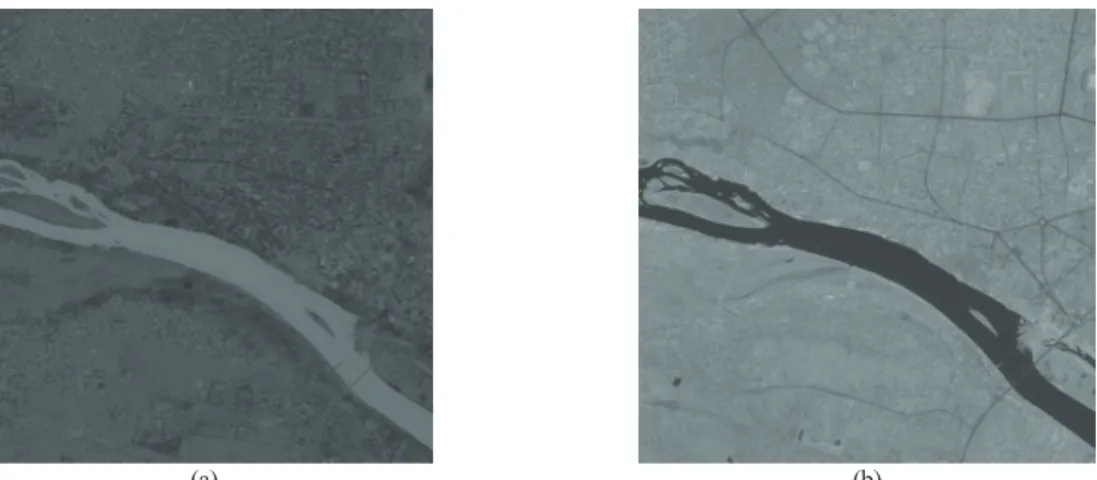
The reflectance of NIR over water body has opposite property compared to the NDWI (Fig. 3). While the NDWI of water body is high, the NIR band shows the low reflectance in water body. The low reflectance of NIR in water body is useful spectral information to
discriminate water body and pixels with high NDWI value in built-up area. Fig. 4 shows a scattergram of the NDWI and NIR images. We can see that the spectral clusters of water body and non-water body components are well separated.
Fig. 2. The NDWI and binary NDWI images (a) the NDWI image created from Kompsat-2 image (b) the NDWI image created from Kompsat-3 image (c) the binary NDWI image of Fig. 2(a) (TB= 117) (d) the binary NDWI image of Fig. 2(b) (TB= 159) (e) the histogram of Fig. 2(a) (f) the histogram of Fig. 2(b).
(e) (f)
(c) (d)
(a) (b)
2) Extracting water body based on Mahalanobis distance
The proposed method of extracting water body consists of four parts: feature vector extraction, training site selection, computation of mean vector and covariance matrix and finally classification based on Mahalanobis distance (Fig. 5). First, we create a two- element feature vector x consisting of the NDWI and NIR band. Next step is to select a training site on water body area. After selecting the training site, we compute the mean vector u
xand the covariance matrix C
xof the training site. Finally, we classify pixels based on Mahalanobis distance D
M(x) given as follows:
D
M(x) = (2) where
ux
= ∑
Kk = 1xk
,
K: total number of pixels in a training site
Cx= ∑
Kk = 1
(x
k_ u
x)(x
k_ u
x)
TThe Mahalanobis distance is a scale-independent distance measure and widely used in supervised classification. It is an appropriate distance measure when variables have different scales. For example, two points A and B in Fig. 6 are located at the same Mahalanobis distance from a centroid, while located at
(x _ u
x)
TCx_1(x _ u
x) K 1
K 1
Fig. 4. The Scattergram of the NDWI and NIR images.
Fig. 3. The NDWI and NIR images (a) the NDWI image (b) the NIR image.
(a) (b)
different Euclidean distances (A is closer to the centroid than B). We compute the Mahalanobis distance between each feature vector x in the image and the mean vector u
xof the training site by using equation (2). Pixels with a smaller Mahalanobis distance than a predefined threshold distance T
Mare classified into water body.
3) Image registration of before and after images of flood
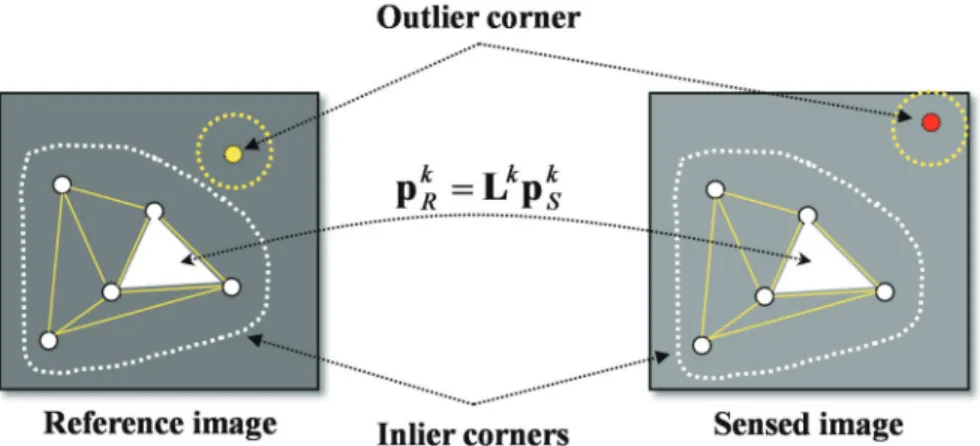
We need to register before and after images of flood in order to compare them and find the changed area after flooding. A scene-based image registration method is employed to monitor rapidly the flood affected area by using only before and after images of flood, without using any other information. We align before and after images of flood by the image registration method, which performs outlier removal and triangulation-based local transformation (Ye, 2014a). After finding corresponding corners in reference and sensed images (Ye, 2014b), we transform a sensed image into a reference image coordinate system using RANSAC-based Global Transformation.
Corners with large residual errors are eliminated as outlier corners. After creating Delaunay TIN using inlier corners, we warp all the triangles in the sensed image to the corresponding triangles in the reference image (Fig. 7).
Fig. 5. The flow chart of water body extraction.
Fig. 6. An example of the scale-independent Mahalanobis measure. Two points A and B are located at the same Mahalanobis distance from a centroid. All pixels within the threshold distance TMare classified into water body.
Fig. 7. Image registration using outlier removal and triangulation-based local transformation.
3. Experimental Results
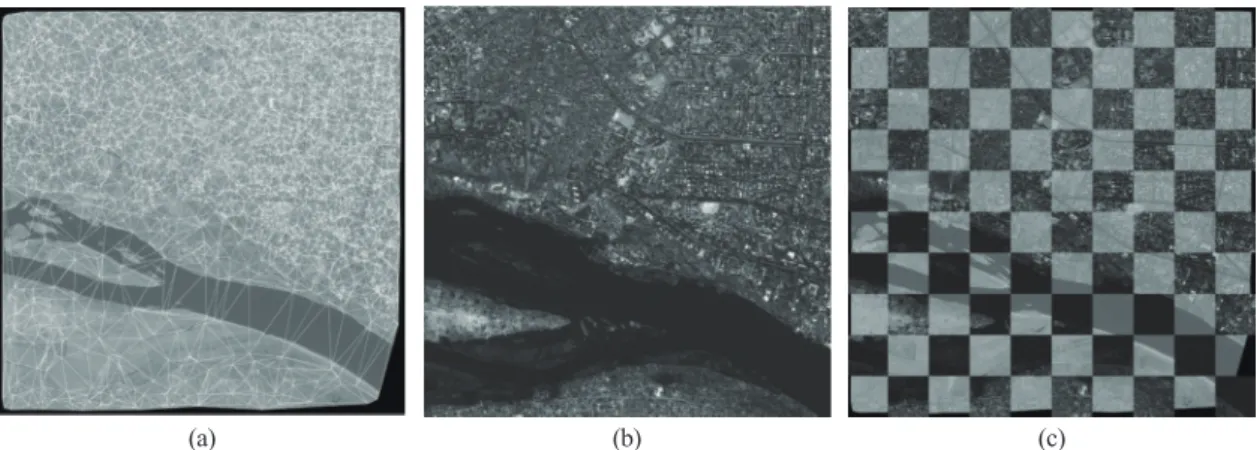
The proposed algorithm was tested using the before- flooding Kompsat-2 image and the after-flooding Kompsat-3 image of Niger acquired in 2009 and 2013, respectively (Fig. 8). We resampled the before-flooding Kompsat-2 image using linear interpolation to produce the sensed image with the same resolution as Kompsat- 3 image. We can see that many man-made objects exist close to a river and also water body area was expanded after flooding. Fig. 9(a) shows the result of Delaunay TIN creation on the warped panchromatic image after image registration. Fig. 9(c) shows the checkerboard mosaicked image of warped image and reference image.
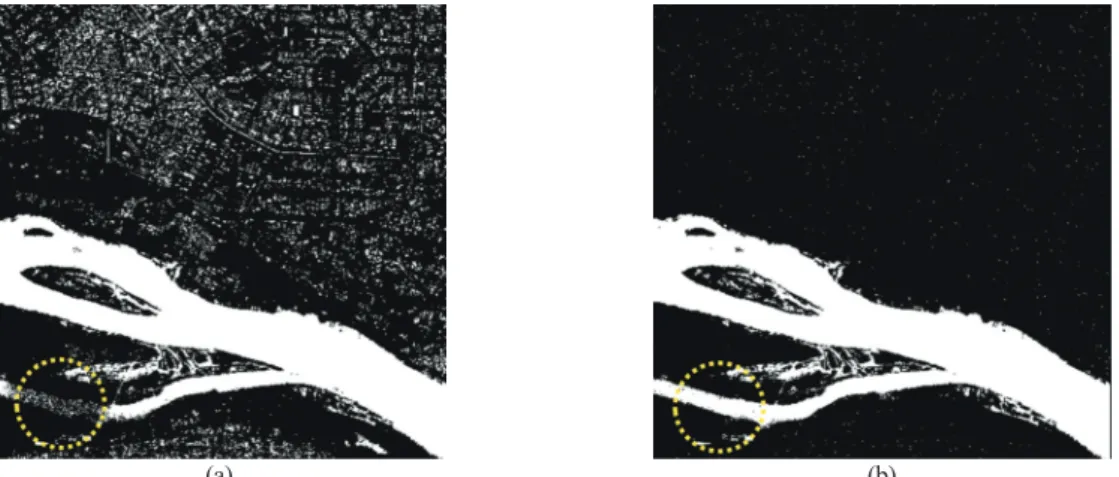
Fig. 10(a) shows water body extracted by the NDWI
method. We can see that man-made objects in the built- up area were detected together with water body in the NDWI image. In contrast, the proposed method removed successfully most misclassified pixels in the built-up area. Moreover, a part of water body classified into non-water body on the bottom left in Fig. 10(a), was correctly classified into water body.
We applied morphological processing to the extracted water body in order to eliminate small holes in the extracted water body image. After creating a 3 × 3 structuring element, we first applied opening operation to the extracted water body image two times and then also applied closing operation to the previous result image two times. Fig. 11(a) shows the final extracted water body of the proposed method after morphological
Fig. 8. Experimental images (a) the before-flooding Kompsat-2 image of Niger (April 18, 2009) (b) the after-flooding Kompsat-3 image of Niger (Jan. 21, 2013).
(a) (b)
Fig. 9. Results of image registration (a) Delaunay TIN creation on the warped image (sensed image) after image registration (b) the warped reference image (c) the checkerboard mosaicked image of warped image and reference image.
(a) (b) (c)
processing. Most of the small holes detected in built-up area were successfully removed. Fig. 11(b) shows the final extracted water body overlaid on the original image.
To assess the accuracy of the water body classification by the random sampling method, we
selected 400 points randomly from water body and non-water body areas. We computed users accuracy, producers accuracy, overall accuracy and Kappa coefficient as shown in Table 1 and Table 2. The overall accuracy of the proposed method was 97.25%,
Fig. 10. Results of water body extraction (a) the NDWI method (b) the proposed method(TM= 0.3).(a) (b)
Table 2. Accuracy assessment of the proposed method Reference data Number
of total pixels
Users accuracy Water Non- (%)
water
Water 71 8 79 89.87
Non-water 3 318 321 99.07
Number of total pixels 74 326 400 Producers accuracy (%) 95.95 97.55
Overall accuracy (%) 97.25 Kappa coefficient (%) 91.11
Fig. 11. Results of the proposed method after morphological processing (a) the extracted water body after morphological processing (b) the extracted water body overlaid on original image.
(a) (b)
Table 1. Accuracy assessment of the NDWI method Reference data Number
of total pixels
Users accuracy Water Non- (%)
water
Water 67 35 102 65.69
Non-water 7 291 298 97.65
Number of total pixels 74 326 400 Producers accuracy (%) 90.54 89.26
Overall accuracy (%) 89.50 Kappa coefficient (%) 69.62
while that of the NDWI method was 89.5%. The proposed method produced also higher Kappa coefficient (91.11%) than the NDWI method (69.62%).
By applying morphological processing to the extracted water body image, we obtained higher overall accuracy (98.25%) and Kappa coefficient (94.14%) than the proposed method with no morphological processing as shown Table 3.
We also applied the proposed method to the before- flooding image warped after image registration. Fig. 12 shows the extracted water body overlaid on before- flooding image. We can see that water body was successfully extracted. We obtained high overall accuracy (99.75%) and Kappa coefficient (98.78%) as
shown in Table 4.
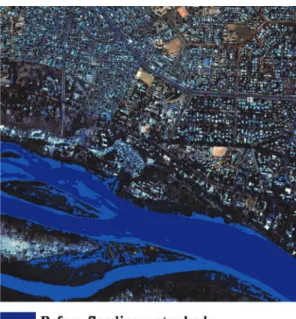
Fig. 13 shows the change map of water body obtained by combining the before-flooding water body and the after-flooding water body. Dark blue area represents the before-flooding water body and light blue area represents the after-flooding water body. The amount of changed water area was estimated using this change map. The estimated areas of before-flooding and after-flooding water body were 0.718 km
2and 1.193 km
2, respectively. The amount 0.475 km
2of changed water body area was 8.38% of whole area in Fig. 12.
Table 3. Accuracy assessment of the proposed method after morphological processing
Reference data Number of total
pixels Users accuracy Water Non- (%)
water
Water 70 3 73 95.89
Non-water 4 323 327 98.78
Number of total pixels 74 326 400 Producers accuracy (%) 94.59 99.08
Overall accuracy (%) 98.25 Kappa coefficient (%) 94.17
Table 4. Accuracy assessment of the proposed method for the before-flooding image
Reference data Number of total
pixels Users accuracy Water Non- (%)
water
Water 46 1 47 97.87
Non-water 0 353 353 100.00
Number of total pixels 46 354 400 Producers accuracy (%) 100.00 99.72
Overall accuracy (%) 99.75 Kappa coefficient (%) 98.78
Fig. 12. The extracted water body overlaid on before-flooding
image. Fig. 13. The change map of water body.