1. Introduction
Synthetic Aperture Radar (SAR)-based monitoring of flood has been frequently used due to its all-weather capability in image acquisition. Water body extraction is an essential process to detect inundation extent.
Thresholding method has been widely employed to discriminate between water body and non-water body in SAR imagery (Matgen et al., 2011; Klemenjak et al.,
2012; Kuenzer et al., 2013; Martinis et al., 2015).
Considering water body tends to have low backscatter value, water body class is assigned to the pixels with lower intensity than a threshold value. Kuenzer et al.
(2013) employed two empirical threshold values, which define confident water and land areas, respectively and then compared the dilatation of confident water area with confident land area to exclude overestimated water pixels. Matgen et al. (2011)
Water body extraction in
SAR image using water body texture index
Chul-Soo Ye†
Department of Ubiquitous IT, Far East University
Abstract :Water body extraction based on backscatter information is an essential process to analyze flood- affected areas from Synthetic Aperture Radar (SAR) image. Water body in SAR image tends to have low backscatter values due to homogeneous surface of water, while non-water body has higher backscatter values than water body. Non-water body, however, may also have low backscatter values in high resolution SAR image such as Kompsat-5 image, depending on surface characteristic of the ground. The objective of this paper is to present a method to increase backscatter contrast between water body and non-water body and also to remove efficiently misclassified pixels beyond true water body area. We create an entropy image using a Gray Level Co-occurrence Matrix (GLCM) and classify the entropy image into water body and non-water body pixels by thresholding of the entropy image. In order to reduce the effect of threshold value, we also propose Water Body Texture Index (WBTI), which measures simultaneously the occurrence of repeated water body pixel pair and the uniformity of water body in the binary entropy image. The proposed method produced high overall accuracy of 99.00% and Kappa coefficient of 90.38% in water body extraction using Kompsat-5 image. The accuracy analysis indicates that the proposed WBTI method is less affected by the choice of threshold value and successfully maintains high overall accuracy and Kappa coefficient in wide threshold range.
Key Words :
Water body extraction, flood monitoring, gray level co-occurrence matrix, entropy imageReceived July 29, 2015; Revised August 17, 2015; Accepted August 18, 2015.
†Corresponding Author: Chul-Soo Ye ([email protected])
This is an Open-Access article distributed under the terms of the Creative Commons Attribution Non-Commercial License (http://creativecommons. org/licenses/by-nc/3.0) which permits unrestricted non-commercial use, distribution, and reproduction in any medium, provided the original work is properly cited
Article
assumed a gamma distribution of water backscatter and defined a threshold value based on a histogram of gamma distribution. Martinis et al. (2015) determined one global threshold value obtained by integrating local threshold values of a small number of blocks of the whole image. The local threshold values were derived by Kittler’s method (Kittler and Illingworth, 1986), where two classes are assumed to be normally distributed.
The performance of these threshold-based methods depends on the backscatter difference between water body and non-water body. If pixels in non-water body have similar backscatter values to those of water body, then misclassification of water body will be increased even though the threshold values are carefully chosen by empirical decision or by using the statistical distribution of water backscatter. In this paper, we propose a method to increase the backscatter contrast between water body and non-water body using entropy-based texture analysis. In comparison to other water body extraction methods, we also propose the Water Body Texture Index (WBTI) created by integrating two texture features entropy and contrast computed from a co-occurrence matrix of entropy image.
2. Methodology
1) Backscatter characteristics of water body and non-water body
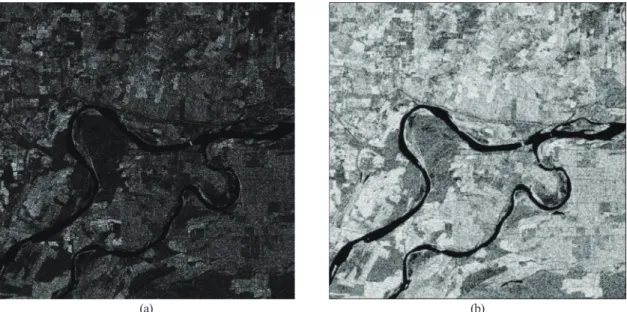
Water body in SAR imagery has low backscatter values due to homogeneous surface of water, while non-water body has higher backscatter values than water body. However, non-water body may have low backscatter values depending on surface characteristic of the ground. For example, Fig. 1 shows water body
Fig. 1. Subset of Kompsat-5 image obtained by HH polarization of an area (Ranjanpur District in Pakistan) acquired on December 12, 2014.
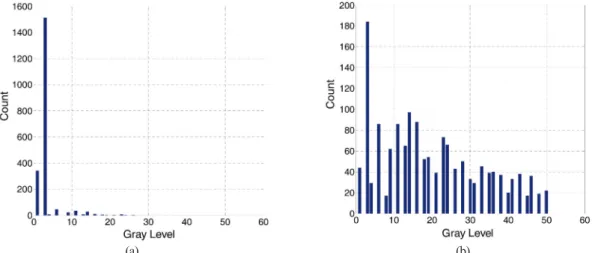
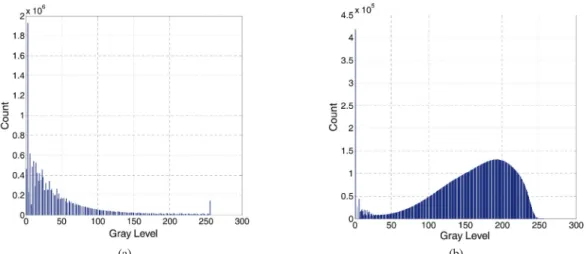
Fig. 2. Histograms of water body and non-water body areas marked with the white rectangles in Fig. 1 (a) water body (b) non-water body.
(a) (b)
and non-water body in Kompsat-5 image. Non-water body area in Fig.1 has low backscatter values as well as high backscatter values. Fig. 2 shows the histograms of water body and non-water body areas marked with the white rectangles in Fig. 1. The peaks of both histograms are obtained at the same gray level, i.e., the second smallest gray level. This means that if the threshold value for water body is determined as a higher gray level than the second smallest gray level, then the pixels with the second smallest gray level in non-water body area are also classified into water body, i.e., misclassification happens in non-water body area.
Therefore we need other information to discriminate between water body and non-water body instead of applying directly a threshold value to the gray level image.
2) GLCM-based texture analysis
Thresholding methods based on histogram of gray level image considers only gray level, while they do not consider spatial relationship between neighboring pixels. Water body and non-water body have different spatial relationship between neighboring pixels: Pixels in water body have similar backscatter values, while pixels in non-water body show irregular patterns of backscatter values. Texture is one of the important characteristics to analyze similar or irregular patterns of backscatter values. The Gray Level Co-occurrence Matrix (GLCM) is a widely used statistical technique for textural feature extraction (Haralick, 1973).
The element m
ijof GLCM M is given by equation (1) (Haralick, 1973), i.e., by the number of times that specific pixel pairs occur in a local image I with L gray levels of size N × N.
mij
(∆x, ∆y) = ∑
Nx= 1
∑
Ny= 1
{ (1)
where ∆x and ∆y represent the relative distances between the specific pixel pair along the x-axis and the y-axis, respectively.
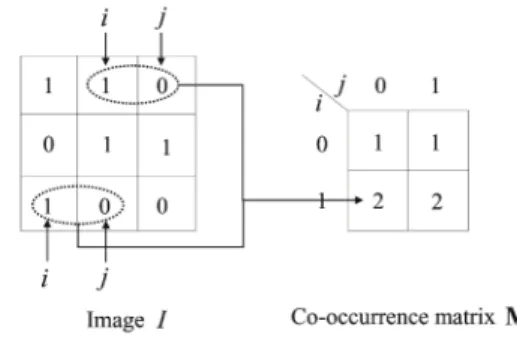
Fig. 3 illustrate how to generate a co-occurrence
matrix for a binary image I. For example, the pattern(i, j) of two adjacent pixels with ∆x = 1 and ∆y = 0 occurs twice for horizontal direction in the image I. The number 2 is assigned to the element m
10of M. The size of matrix M depends on the possible gray level L of image. In the case of a binary image and 8-bit gray level image, M will be of size 2 × 2 and 256 × 256, respectively. We may also adjust the size of M arbitrarily by reducing the gray level of the image to save computational load.
The co-occurrence probability p
ij(∆x, ∆y) of element
mij(∆x, ∆y) is obtained by normalizing the co-occurrence matrix, i.e., dividing each element m
ij(∆x, ∆y) by the total number of pixel pairs as follows (Haralick, 1973):
P
ij(∆x, ∆y) = (2)
Various features such as entropy, energy, contrast, etc., are computed by using the co-occurrence probability p
ij(∆x, ∆y). The entropy is defined as follows (Haralick, 1973):
Entropy = _
x= 1∑
Ny= 1∑
N pij(∆x, ∆y) log p
ij(∆x, ∆y) (3) The entropy measures the irregularity of image, i.e., water body with homogeneous surface has a low entropy value, while non-water body has a high entropy value due to its irregular texture characteristic in SAR imagery. Fig. 4 shows a test Kompsat-5 image and a normalized entropy image. Most pixels in non-water body area have relatively high entropy value, while
1, if I(x, y) = i and I(x+ ∆x, y+ ∆y) = j 0, otherwise
mij
(∆x, ∆y)
∑
Nx= 1y= 1
∑
Nmij(∆x, ∆y)
Fig. 3. Generation of a co-occurrence matrix with relative distance (∆x, ∆y) = (1, 0).
those in water body area have low entropy values (Fig.
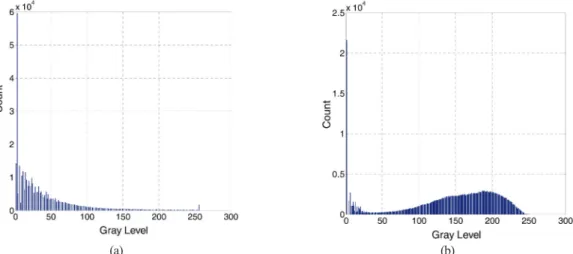
4(b)). Comparing the two histograms of a test Kompsat-5 image and the normalized entropy image in Fig. 5, we see that it is easy to discriminate between water body and non-water body in the entropy image.
By investigating the histogram of entropy image, we can easily determine the threshold value T
Efor water body extraction. For example, In the case of entropy image in Fig. 4(b), a gray level in the range between 50 and 70 may be one of good candidate values for thresholding of the entropy image.
3) Water Body Texture Index (WBTI) Conventional statistical distribution of water backscatter is not applicable to the histogram of entropy image due to irregular distribution shape of water body histogram, i.e., entropy values of training sites for water body do not follow the conventional statistical distribution such as a gamma distribution. We observed that most entropy values of training sites selected manually in the Kompsat-5 imagery are filled with zero values, except that a training site contains a few backscatter values within water body or near the
Fig. 5. Histograms of Fig. 4 (a) the original test Kompsat-5 image (b) the normalized entropy image.
(a) (b)
Fig. 4. (a) The original test Kompsat-5 image (b) the normalized entropy image.
(a) (b)
boundary between water body and non-water body.
Therefore, instead of estimating a statistical distribution of water body in entropy image, we initially classify the entropy image into water body and non- water body pixels by thresholding of the entropy image based on the histogram of entropy image, as explained in section 2.2. Then we perform a post-processing based on a binary texture analysis, which will be explained in detail later, to improve the accuracy of initial water body extraction.
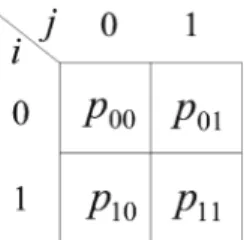
If an entropy value of pixel is above a threshold value, the pixel is set to one (water body), otherwise zero (non-water body). Since a binary image has only two gray levels 0 or 1, we can make a normalized co- occurrence matrix M of size 2 × 2 using equation (2) as shown in Fig. 6.
The four elements of normalized co-occurrence matrix M contain statistical information to describe the texture in a binary image. The elements p
00and p
11represent the probabilities that both of two pixels considered belong to non-water body and water body, respectively. The elements p
01and p
10represent the probabilities that one element of pixel pair belongs to non-water body and the other belongs to water body.
Conventional energy and contrast texture features given by equation (4) and (5) measure uniformity and variation in image, respectively. The energy and entropy, however, have some limits in describing exact phenomenon in image. For example, two energy values of images in Fig. 7(a) and (b) (Case 1 and Case 2) are identical even though the patterns of the images are different. The contrast values for Fig. 7(c) and (d) (Case 3 and Case 4) are also identical under different patterns.
Energy = ∑
Nx= 1
∑
Ny= 1p2ij
(∆x, ∆y) (4) Contrast = ∑
Nx= 1
∑
Ny= 1
(i _ j)
2pij(∆x, ∆y) (5) In order to measure water body texture in a binary image of size W × W, we propose the WBTI defined
Fig. 6. Normalized co-occurrence matrix M for the binary imagewith gray level 0 and 1.
Fig. 7. Examples of co-occurrence matrix generation (d = 1, ∆x = 1 and ∆y = 0) (a) case 1: non-water body elements (b) case 2: water body elements (c) case 3: water body and non-water body elements (d) case 4: water body and non-water body elements.
(c) (d)
(a) (b)
using the following formulae:
WBTI = ∑
Wx= 1
∑
Wy= 1
(w
H+ w
V) (6) where w
Hand w
Vare the WBTI elements in horizontal and vertical directions, respectively, defined as follows:
w
H= p
112(0, 1) _ (
p200(0, 1) + p
201(0, 1) + p
102(0, 1) ) (7)
w
V= p
211(1, 0) _ (
p200(1, 0) + p
201(1, 0) + p
210(1, 0) ) (8)
The WBTI measures simultaneously the occurrence of repeated water body pixel pair and the uniformity of water body in a binary image. The elements p
211and p
200represent the energy term for water body and non-water body in equation (4), respectively, and measure the probabilities that water body and non-water body pixel pairs occur in image, respectively. The element p
201+ p
210, which is the contrast in equation (5), measures the variation in image. Therefore, the WBTI becomes high when the number of repeated water body pixel pairs
increases and the variation in spatial distribution of water body pixels decreases in image. We finally assign water body class to the pixel which is detected as water body in the initial water body classification and also its WBTI is above the threshold value T
W.
We computed the energy, the contrast and the WBTI, respectively, for each case in Fig. 7 as shown in Table 1. The WBTI becomes the minimum and maximum when the image is filled with non-water body pixels and water body pixels, respectively (Case 1 and Case 2). While the contrast values of Case 3 and Case 4 are identical though the patterns of water body are different, the WBTI discriminates between Case 3 and Case 4, i.e., the image in Fig. 7(c) contains more water body texture information than Fig. 7(d) from a WBTI perspective.
3. Experimental Results
The proposed method was tested using Kompsat-5 image obtained by HH polarization of an area (Ranjanpur District in Pakistan) acquired on December 12, 2014 (Fig. 8(a)). We obtained the entropy image in 1 2
Table 1. Energy, contrast and WBTI for the cases in Fig. 7
Energy Contrast WBTI
Case 1 1 0 -1
Case 2 1 0 1
Case 3 0.389 0.5 -0.028
Case 4 0.389 0.5 -0.250
Fig. 8. (a) The original test Kompsat-5 image over Ranjanpur District in Pakistan (b) the normalized entropy image created from GLCM.
(a) (b)
Fig. 8(b) based on the GLCM texture analysis. First we reduced the gray level of original image from 256 to 20 gray levels. The co-occurrence matrix of each pixel was created using the local window of size 11 × 11 pixels for the relative distances ∆x = 1 and ∆y = 0. The resulting entropy image in Fig. 8(b) shows the contrast between water body and non-water body was largely enhanced. We also see the change of histogram between the original image and entropy image in Fig.
9(a) and (b).
We investigated the accuracy of initial water body classification by segmenting the original and entropy images, respectively. After selecting 400 points randomly from water body and non-water body area, we computed the overall accuracy and Kappa coefficient according to the threshold values in the range 1 to 90. In the case of original image classification, the maximum overall accuracy of 94.75% was obtained at the threshold values of 1 and 2 with very low Kappa coefficient of 37.65%. The overall accuracy and the Kappa coefficient continue to decrease after the threshold values of 2 and 3, respectively. In the case of entropy image classification, the overall accuracy exists between 94.25% and 99.00% in the range 1 to 90, while the Kappa coefficient between 61.40% and 90.78%. If the threshold value is limited in a more narrow range, for
example, between 50 and 60, we can obtain higher overall accuracy between 98.00% and 99.00% and Kappa coefficient between 83.55% and 90.78%.
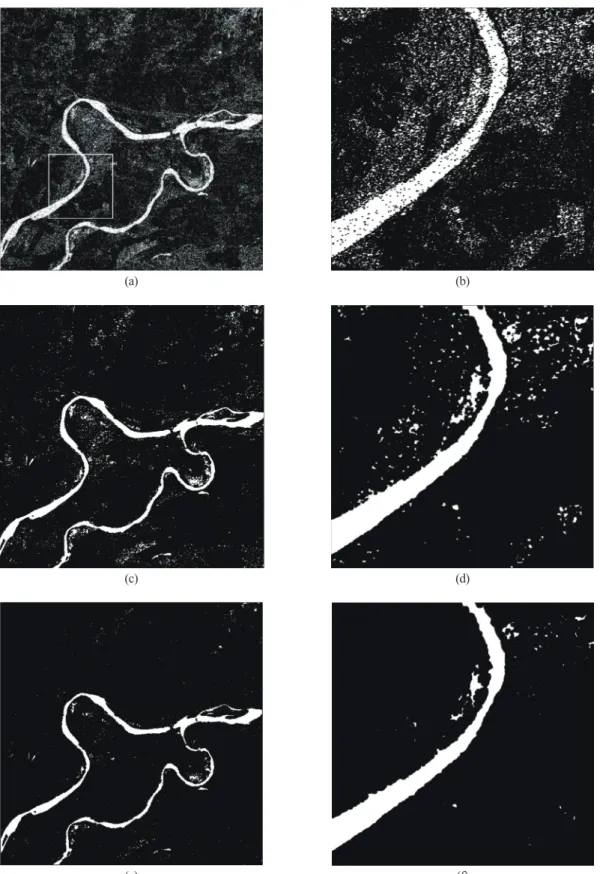
We extracted water body by segmenting the original and the entropy image with threshold values set to 3 and T
E= 65, respectively, as shown in Fig. 11(a) and (c). After creating the normalized entropy image in Fig.
8(b), we initially classified the normalized entropy image into water body and non-water body pixels with the threshold value T
E= 65. Then we obtained the WBTI image by assigning water body class to the initial water body pixels whose WBTI is above the threshold value T
W= 0.9 as shown in Fig. 11(e).
The WBTI method successfully suppressed the
Fig. 9. Histograms of Fig. 8 (a) the original test Kompsat-5 image (b) the normalized entropy image.(a) (b)
Fig. 10. The overall accuracy (O.A.) and Kappa coefficient (K.C.) of initial water body classification by segmenting the original and entropy images using various threshold values.
Fig. 11. Results of water body extraction by using (a) the original image (c) the entropy image (e) the WBTI image. The images (b), (d) and (f) on the right column are enlarged images of the images (a), (c) and (e) over the white square area in Fig. 11(a).
(e)
(c) (d)
(a) (b)
(f)
misclassification of water body in non-water body area.
We computed the overall accuracy and Kappa coefficient for each classified image in Fig. 11(a), (c) and (e) as shown in Table 2, Table 3 and Table 4. The overall accuracy and Kappa coefficient of the classification result obtained from original image were 92.75% and 55.63%, respectively. The classification result obtained directly from entropy image produced higher overall accuracy of 97.50% and Kappa coefficient of 80.83% than the classification result
obtained from original image. The proposed WBTI method produced higher overall accuracy of 99.00%
and Kappa coefficient of 90.38% than the other two methods.
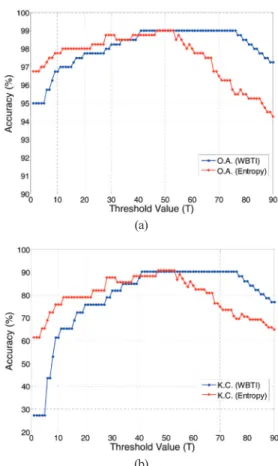
Fig. 12 shows the accuracy comparison of proposed WBTI method and direct segmentation method of entropy image, based on overall accuracy and Kappa coefficient according to the threshold values in the range 1 to 90. The proposed WBTI method maintains the maximum overall accuracy of 99.00% and Kappa coefficient of 90.38% in the threshold range between 41 and 76, while the direct segmentation method of entropy image maintains the maximum only in the threshold range between 47 and 53. The proposed WBTI method was less affected by the choice of threshold value T
Eand successfully maintained the high
Table 2. Accuracy assessment of the classification resultobtained from original image
Reference data Number of total pixels
Users accuracy Water Non- (%)
water
Water 21 26 47 44.68
Non-water 3 350 353 99.15
Number of total pixels 24 376 400 Producers accuracy (%) 87.50 93.09 Overall accuracy (%) 92.75 Kappa coefficient (%) 55.63
Fig. 12. The overall accuracy and Kappa coefficient of the direct segmentation method of entropy image and the proposed WBTI method according to the threshold value (a) the overall accuracy (b) the Kappa coefficient.
(b) Table 3. Accuracy assessment of the classification result (a)
obtained directly from entropy image Reference data Number
of total pixels
Users accuracy Water Non- (%)
water
Water 23 9 32 71.88
Non-water 1 367 368 99.73
Number of total pixels 24 376 400 Producers accuracy (%) 95.83 97.61 Overall accuracy (%) 97.50 Kappa coefficient (%) 80.83
Table 4. Accuracy assessment of the classification result obtained from proposed WBTI image
Reference data Number of total pixels
Users accuracy Water Non- (%)
water
Water 20 0 20 100
Non-water 4 376 380 98.95
Number of total pixels 24 376 400 Producers accuracy (%) 83.33 100.00 Overall accuracy (%) 99.00 Kappa coefficient (%) 90.38