http://crossmark.crossref.org/dialog/?doi=10.14474/ptrs.2018.7.4.154&domain=pdf&date_stamp=2018-12-25
Received: 5 October, 2018 Revised: 18 November, 2018 Accepted: 29 November, 2018 Corresponding author: Wan-hee Lee (ORCID https://orcid.org/0000-0001-8030-4853)
Department of Physical Therapy, College of Health and Welfare, Sahmyook University, 815 Hwarang-ro, Nowon-gu, Seoul 01795, Republic of Korea Tel: 82-2-3399-1633 Fax: 82-2-3399-1639 E-mail: [email protected]
This is an Open-Access article distributed under the terms of the Creative Commons Attribution Non-Commercial License (http://creativecommons.org/licenses/
by-nc/4.0) which permits unrestricted non-commercial use, distribution, and reproduction in any medium, provided the original work is properly cited.
Copyright © 2018 Korean Academy of Physical Therapy Rehabilitation Science
https://doi.org/10.14474/ptrs.2018.7.4.154 pISSN 2287-7576
eISSN 2287-7584
Phys Ther Rehabil Sci 2018, 7 (4), 154-163 www.jptrs.org
Effect of two types of muscle contraction training on
muscle thickness, strength, and delayed onset of muscle soreness in persons with chronic stroke
Seung-yeop Lim
a, Wan-hee Lee
baDepartment of Physical Therapy, Sahmyook University College of Health Science, Seoul, Republic of Korea
bDepartment of Physical Therapy, College of Health and Welfare, Sahmyook University, Seoul, Republic of Korea
Objective: The purpose of this study was to investigate the effects of eccentric contraction training (ECT) and concentric con- traction training (CCT) on the muscle thickness (MT), muscle strength (MS) and delayed onset of muscle soreness (DOMS) of the lower extremities in persons with chronic stroke.
Design: Randomized controlled trial.
Methods: Thirty persons with chronic stroke were randomly assigned to the ECT or the CCT group. The ECT was performed in a specially designed system of eccentric contraction of both legs and, the CCT was performed using a traditional stepper system for concentric contraction of both legs. The training was performed for 30 min/times, 3 times/wk for 6 weeks. Rehabilitation ultra- sound imaging was used to measure MT of the vastus medialis/lateralis (VL), and soleus (SOL), a digital muscle tester was used to measure MS, and a visual analog scale was used to assess DOMS.
Results: In the ECT group, MT was significantly improved except for SOL resting (p<0.01). In the CCT group, the MT was sig- nificantly improved except for VL contraction (p<0.05). The MS was significantly improved in both groups, especially in the ECT group (p<0.01). In the ECT group, muscle soreness was highest in the first week after training but gradually decreased, and in the CCT group, it was highest in the second week of training but gradually decreased (p<0.01).
Conclusions: ECT can improve lower limb MT, MS, and DOMS of chronic stroke survivors. Therefore, it is recommended that ECT be used in the rehabilitation of persons with chronic stroke.
Key Words: Muscle contraction, Muscle strength, Stroke, Ultrasonography
Introduction
Skeletal muscle contraction can be categorized into con- centric or eccentric contraction.
In exercise physiology, the mechanism of muscle con- traction occurs according to the cross-bridge theory based on the sliding filament theory. This theory entails small con- tractile units (sarcomeres), which cause muscle tension.
Sarcomeres are composed of thick myosin filaments and thin actin filaments. Myosin attaches to actin proteins which attract each other, shortening the sarcomeres, resulting in
shortening of muscles, and generating tension [1,2].
Contraction of this kind in which the muscle is shortened and tension is generated is referred to as a concentric con- traction [2].
Eccentric contraction, on the other hand, refers to the con-
traction that occurs when the muscle is stretched because the
external force is greater than the tension produced by the
muscle [2]. In other words, eccentric contraction is a con-
traction in which the sarcomere is stretched. Here, the my-
osin moves away from the actin protein, lengthening the sar-
comere, thereby generating tension [2]. Thus, Lindstedt et
Lim and Lee: Two types of muscle contraction training in chronic stroke patients 155
al. [3] defined eccentric contraction as ‘negative work’ be- cause the muscle generates tension with lengthening.
The characteristics of eccentric contraction compared to concentric contraction are as follows: (1) Eccentric con- traction generates large muscle tension due to decreased rate of actin-myosin cross-bridge detachment [1]. (2) It gen- erates large tension but uses less energy. In general, a mole- cule of adenosine tri-phosphate (ATP) is utilized during con- centric contraction for cross-bridge separation. However, during eccentric contraction, the cross-bridges are forcibly separated due to stretching of the muscle fibers, resulting in less ATP consumption [4]. (3) It produces a cross-education effect. This means that if eccentric contraction training (ECT) is performed on a healthy uninjured limb, the training effect is also seen on the injured limb [5,6]. (4) Stroke pa- tients have more retentive eccentric contraction ability [7].
Therefore, ECT can be a more effective training method than concentric contraction training (CCT) for persons with chronic stroke with hemiplegic symptoms and decreased strength.
However, despite these advantages, studies on traditional muscle training for rehabilitation of stroke survivors have focused on CCT. One reason cited for this is that eccentric contraction causes delayed onset of muscle soreness (DOMS) [8,9]. Overstretching due to eccentric contraction does not allow for overlap between myosin and actin fila- ments, thereby exceeding the allowable capacity for con- nective tissue and other proteins in the sarcomere, and as a result, repetitive eccentric loads can damage muscle cells and cause DOMS [10]. Therefore, ECT has been mainly fo- cused on sports rehabilitation [11,12].
Nevertheless, there has been recent increases in cases where ECT has been used for the rehabilitation of chronic stroke patients. In the study by Fernandez-Gonzalo et al.
[13], 32 subjects with chronic stroke participated in eccen- tric overload flywheel resistance training for 12 weeks with results showing significantly improved balance and gait per- formance in the training group. In the study by Park et al.
[14], 30 chronic stroke participants undertook ECT at differ- ent velocities for 8 weeks with results showing improved muscle activation and static balance (limits of stability) at low velocities.
However, these studies focused only on functional per- formance abilities such as balance and gait after muscle con- traction training, and there are few studies focusing on mus- cle characteristics [13,14]. Even if the characteristics of muscle had been analyzed, they were analyzed only by elec-
trical signals from the skin surface, such as surface electro- myography [14]. Therefore, there have been no studies on the effects of ECT and CCT on the muscle architecture and characteristics of persons affected by stroke. Due to limited analyses, it is difficult to objectively explain the the direct ef- fects of ECT and CCT on muscles.
Therefore, we aimed to investigate the effects of the 2 types of muscle contraction training on muscle thickness (MT), muscle strength (MS), and DOMS in persons with chronic stroke.
Methods Participants
Thirty chronic stroke survivors (22 men, 8 women) hospi- talized at Saeall Rehabilitation Hospital were recruited for this study. To minimize errors with group allocations, 30 notes have been labeled as either the 'ECT group' or the 'CCT group' and have been mixed together in a box with no in- ternal view. Participants were blinded to allocation and were divided into two groups by drawing lots. All the allocations were performed by a physical therapist who was not in- volved in the study. The selected participants were divided by drawing lots into 2 groups, the ECT group (n=15) and the CCT group (n=15). The ECT group consisted of 11 men and 4 women (age mean±standard deviation [SD], 53.47±6.78 years) and the CCT group consisted of 11 men and 4 women (age mean±SD, 55.50±5.82 years). The exclusion criteria for these post-stroke hemiparesis groups were: (1) heart dis- ease or uncontrolled hypertension; (2) hip, knee or ankle sur- gery within the past year; (3) visual impairments, visual field deficits or hearing impairments; and (4) participation in a re- cent similar study. The study protocol was approved by the Institutional Review Board of Sahmyook University in Seoul (IRB No. 2-7001793-AB-N-012018046HR). Partici- pants provided signed consent after receiving verbal and written information about the study.
Procedures
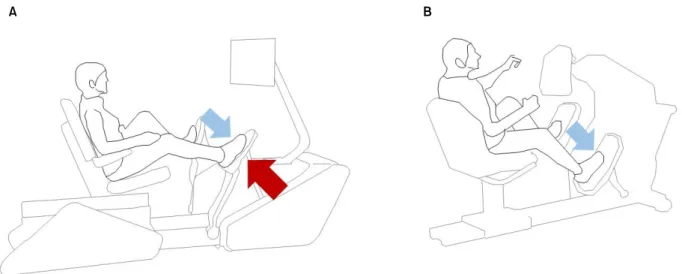
A specially designed training system (Eccentron;
Baltimore Therapeutic Equipment, Hanover, MD, USA)
was used to perform ECT (Figure 1A) [15]. The knee ex-
tensor and ankle plantar flexor muscles were trained using
ECT by negatively resisting the Eccentron pedals which are
cross-driven at equal speeds using the leg muscles. The in-
tensity of training was determined using dosing tests per-
formed every 2 weeks. The dosing test was conducted to set
A B
Figure 1. Training system (A) Eccentric contraction training system (Eccentron). (B) Concentric contraction training system (StepOne).
the optimal intensity for each participant. After measuring the maximum eccentric MS of both lower limbs, 50% of the second maximum value for the weak (paralyzed) limb was taken as the training intensity [16]. In this study, the speed of training was set based on the findings of a previous study that showed low speed training (18-23 revolution per mi- nute, RPM) was more effective than high speed training (26-40 RPM) for chronic stroke survivors [17].
We used a training system (StepOne; Scifit Systems Inc., Tulsa, OK, USA) similar to ECT in posture and motion to perform CCT (Figure 1B) [18]. The patient performed the training by pedaling, utilizing muscle force generated by the legs, and the training intensity was automatically adjusted to a previously set RPM. This CCT recruits the knee extensors and the ankle plantar flexors. The training speed was set at the same RPM as for the ECT.
The participants who provided their written consent per- formed the training 30 minutes/time 3 times/week for 6 weeks. During the training, 2 professional physiotherapists constantly monitored the participants and were prepared for any emergencies. A pre-test was conducted 1 week before the start of training, and a post-test was conducted within 1 week of completing the 6-week training. The evaluation as- sessed MT, MS, and DOMS of the lower extremity muscles and was performed 3 times for each variable. The average value was used as the final measurement value.
Outcome measures Muscle thickness
A mobile rehabilitation ultrasound imaging system (RUSI; MySono U5, Samsung Medison, Seoul, Korea) was used to evaluate MT. The frequency modulation range of the RUSI was 47-63 Hz, and the gain was fixed and applied to all images in the same way. Imaging using RUSI was per- formed using a linear probe in B-mode with a generous amount of ultrasonic gel applied on the skin and the probe moved over the gel with minimal pressure, perpendicular to the skin surface.
For MT measurements, the vastus medialis (VMO),
vastus lateralis (VL), and soleus (SOL) were selected. To as-
sess the VMO, participant laid supine on a bed and an imagi-
nary line was drawn from the anterior superior iliac spine to
the center of the patellar. An imaginary line was also drawn
parallel to the top of the patellar and the ultrasound probe
was placed at the intersection of the 2 lines. The angle of the
ultrasound probe was adjusted until it was parallel to the
VMO fascicles [19,20]. The VMO MT was measured as the
vertical distance at a position 2 cm from the vertex (Figure
2A). To assess the VL, an imaginary line was drawn between
the greater trochanter of the femur and the lateral condyle of
the tibia, and the ultrasound probe was placed in the longi-
tudinal direction at the midpoint of the line [21-23]. The VL
MT, taken as the vertical distance between the superior and
inferior aponeuroses, was measured (Figure 2B). To assess
the SOL, the participant laid prone on a bed and an imagi-
nary line was drawn connecting the popliteal fossa and
Lim and Lee: Two types of muscle contraction training in chronic stroke patients 157
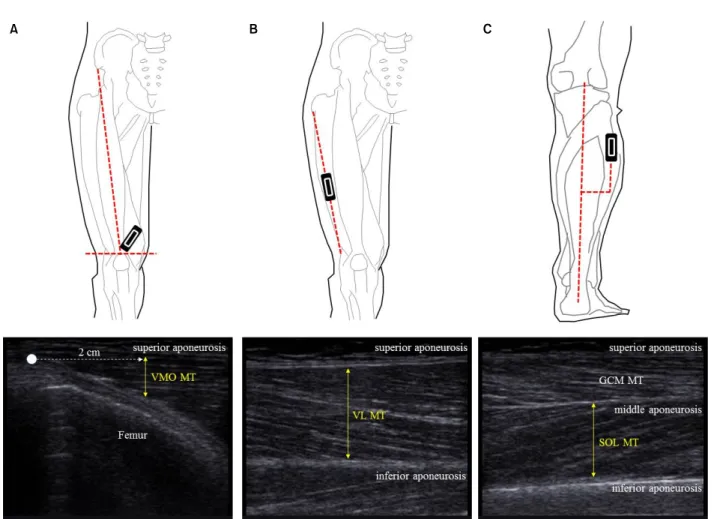
A B C
Figure 2. The position of the ultrasound probe and the position of the muscle thickness measurement from the ultrasound image. (A) Vastus medialis (VMO), (B) vastus lateralis (VL), (C) soleus (SOL). VMO: vastus medialis, MT: muscle thickness, GCM: gastrocnemius.
calcaneus. The ultrasound probe was moved laterally from the midpoint of the line to approximately the upper 20%
point of the line [24,25]. The SOL MT was taken as the verti- cal distance between the middle and inferior aponeuroses below the gastrocnemius (Figure 2C).
Measurements were taken in the resting and contracted states of the muscle. The intra- and inter-reliabilities of the RUSI were r=0.98-1.0 and r=0.93-0.98, respectively [26].
Muscle strength
A digital MS tester (Commander Power track II; J-Tech medical, Salt Lake City, UT, USA) was used to evaluate lower extremity MS. A digital MS tester can measure strengths up to 56.7 kg. After 3 measurements, the data measured with coefficient of variation values within 15%
were used. To measure the strength of the knee extensors (VMO and VL), the participant was instructed to sit on a chair and perform knee extension (KE) with maximum force with the pressure plate of the digital MS tester placed on the
anterior aspect of the ankle. To measure the strength of the ankle plantar flexor (SOL), the participant was instructed to perform ankle plantar flexion (APF) with maximum force with the pressure plate of the digital MS tester placed on the forefoot [27]. The intra- and inter-reliabilities of the digital MS test were r=0.92 and r=0.98, respectively [28].
DOMS
At the end of every week of training, the levels of muscle
soreness experienced by the participants were recorded us-
ing the visual analog scale (VAS). In general, DOMS ana-
lyzes creatinine kinase or myoglobin levels in the blood
through blood sampling [29,30]. However, Komulainen et
al. [31] and Sorichter et al. [32] claimed that the activity of
creatinine kinase and the concentration of myoglobin in the
blood were less relevant to muscle damage, and Manfredi et
al. [33] reported that muscle damage in the lower limb was
caused after eccentric contraction training, but there was no
significant difference in the activity of creatining kinaes.
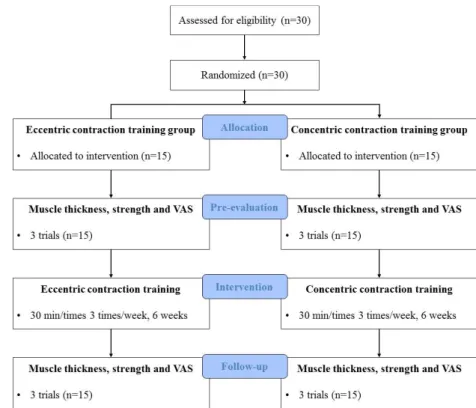
Figure 3. Consolidated Standards of Reporting Trials (CONSORT) dia- gram showing flow of participants through each stage of this randomized trail. Participants were screened and randomly assigned to groups. VAS:
visual analog scale.
Moreover, Lavender and Nosaka [34] argued that since mus- cle damage can affect the performance of daily living activ- ities, it is important to consider symptoms such as muscle pain, and therefore, DOMS was quantitatively analyzed through the VAS [34]. Therefore, this study has analyzed DOMS with VAS referring to the previous studies. The be- fore-training VAS value was set as the baseline (value of zero). VAS was rated on a scale of 1 to 10 with 1 signifying no pain and 10 signifying very severe pain [34,35].
To prepare for emergencies that may occur during the measurement, one physiotherapist was available and ready.
The measurements were performed at the end of treatment in an empty room to minimize measurement errors that may originate from the surrounding complex environment.
Statistical analysis
Descriptive statistics (mean and SD) for all outcome measures were calculated. The socio-demographic charac- teristics of the participants were tested using the t-test and chi-square test. Paired t-test was performed for pre- and post-tests, and the independent t-test was performed to ana- lyze the difference between the groups. The repeated meas- ures analysis of variances was used to compare differences in DOMS over time. The effect sizes were calculated using Cohen's d. All analyzes were performed using PASW
Statistics ver. 18.0 software (IBM Co., Armonk, NY, USA) and a significance level of 0.05 was adopted.
Results
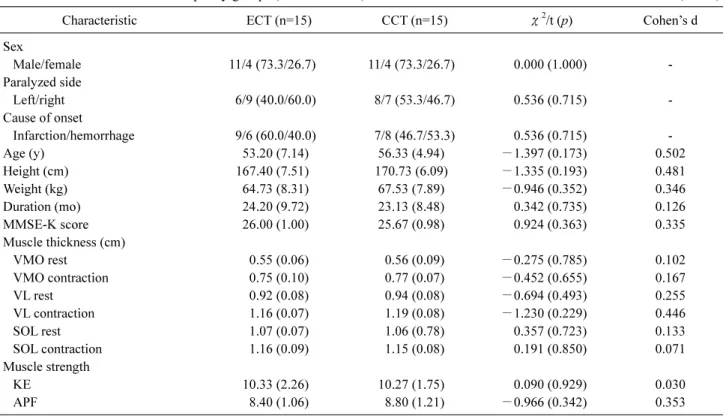
General characteristics of the ECT and CCT groups All 30 participants completed all tests (pre- and post- tests) and interventions (Figure 3). The characteristics of the 2 groups of participants are listed in Table 1. There were no significant differences between the groups in terms of base- line characteristics and values at the beginning of the study ( p<0.05).
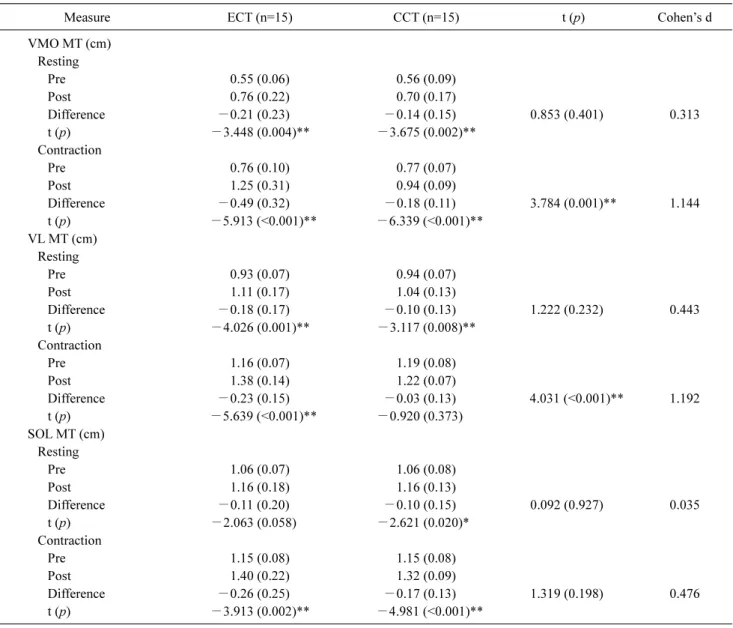
Muscle thickness
The MT was measured at resting and contraction states of
the muscles. The VMO and VL MT of the ECT group
showed significant improvements ( p<0.01) at rest and dur-
ing contraction. The SOL MT showed significant improve-
ments ( p<0.01) only during contraction. The VMO and SOL
MT of the CCT group showed significant improvements
( p<0.05) at rest and during contraction. The VL MT showed
significant improvements ( p<0.01) only at rest. Taken to-
gether, significant differences ( p<0.01) and large effect sizes
(Cohen's d>1.0) were found in both groups only in MT dur-
ing VMO and VL contractions (Table 2).
Lim and Lee: Two types of muscle contraction training in chronic stroke patients 159
Table 1. Characterization of the sample by groups (ECT and CCT) (N=30)
Characteristic ECT (n=15) CCT (n=15) χ2/t (p) Cohen’s d
Sex
Male/female 11/4 (73.3/26.7) 11/4 (73.3/26.7) 0.000 (1.000) -
Paralyzed side
Left/right 6/9 (40.0/60.0) 8/7 (53.3/46.7) 0.536 (0.715) -
Cause of onset
Infarction/hemorrhage 9/6 (60.0/40.0) 7/8 (46.7/53.3) 0.536 (0.715) -
Age (y) 53.20 (7.14) 56.33 (4.94) −1.397 (0.173) 0.502
Height (cm) 167.40 (7.51) 170.73 (6.09) −1.335 (0.193) 0.481
Weight (kg) 64.73 (8.31) 67.53 (7.89) −0.946 (0.352) 0.346
Duration (mo) 24.20 (9.72) 23.13 (8.48) 0.342 (0.735) 0.126
MMSE-K score 26.00 (1.00) 25.67 (0.98) 0.924 (0.363) 0.335
Muscle thickness (cm)
VMO rest 0.55 (0.06) 0.56 (0.09) −0.275 (0.785) 0.102
VMO contraction 0.75 (0.10) 0.77 (0.07) −0.452 (0.655) 0.167
VL rest 0.92 (0.08) 0.94 (0.08) −0.694 (0.493) 0.255
VL contraction 1.16 (0.07) 1.19 (0.08) −1.230 (0.229) 0.446
SOL rest 1.07 (0.07) 1.06 (0.78) 0.357 (0.723) 0.133
SOL contraction 1.16 (0.09) 1.15 (0.08) 0.191 (0.850) 0.071
Muscle strength
KE 10.33 (2.26) 10.27 (1.75) 0.090 (0.929) 0.030
APF 8.40 (1.06) 8.80 (1.21) −0.966 (0.342) 0.353
Values are presented as n (%) or mean (SD).
ECT: eccentric contraction training, CCT: concentric contraction training, MMSE-K: Mini Mental State Examination-Korean, VMO: vastus medialis, VL: vastus lateralis, SOL: soleus, KE: knee extensor power, APF: ankle plantar flexor power.
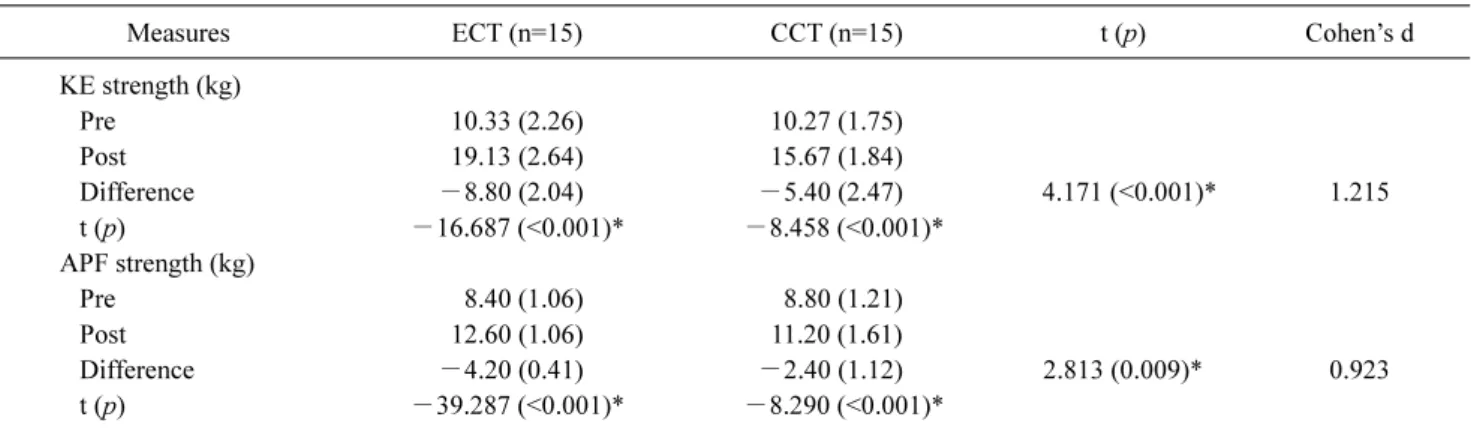
Muscle strength
The MS was assessed by measuring KE and APF strengths. The KE and APF strengths of the ECT group showed significant improvements ( p<0.01). The KE and APF strengths of the CCT group showed significant im- provements ( p<0.01). Taken together, the KE and APF strengths of both groups showed significant differences ( p<0.01) and large effect sizes (Cohen's d >0.9) (Table 3).
DOMS
Muscle soreness was similar in the ECT and CCT groups but was significantly lower in the ECT group. Figure 4 shows changes in muscle soreness after training. ECT mus- cle soreness peaked in the first week after training and grad- ually decreased thereafter. In contrast, CCT muscle soreness peaked in the second week after training and then decreased gradually.
Discussion
In this study, chronic stroke participants performed 2
types of muscle contraction training for the evaluation of MT, MS, and DOMS. The study results revealed significant increases in MT and MS with reduced DOMS in the ECT group compared to the CCT group.
In this study, we observed that the MT of the knee ex-
tensors (VMO and VL) and ankle plantar flexor (SOL) in-
creased significantly after the 2 types of muscle contraction
training, with particularly more MT increase noted in the
ECT than in CCT group. This result is different from those
of previous studies. Cadore et al. [36] reported a similar in-
crease after 6 weeks of ECT and CCT in the VL MT of twen-
ty-two healthy adults. In the study by Norrbrand et al. [37],
15 healthy adults performed ECT and CCT for 5 weeks and
MT increases of the quadriceps in the ECT group was re-
ported, though the increase was not significant. Both studies
examined healthy participants but our study was different
from previous studies in that they targeted chronic stroke pa-
tients with selective atrophy of type II fibers due to changes
in the fiber properties of paralyzed muscles [38]. In addition,
metabolic damage of myosin and actin protein and sarco-
mere degneration cause decrease of muscle mass and MT
[39]. It has been reported, however, that ECT increases mus-
Table 2. Mean (1 SD) values of muscle thickness and results for statistical comparisons (N=30)
Measure ECT (n=15) CCT (n=15) t (p) Cohen’s d
VMO MT (cm) Resting
Pre 0.55 (0.06) 0.56 (0.09)
Post 0.76 (0.22) 0.70 (0.17)
Difference −0.21 (0.23) −0.14 (0.15) 0.853 (0.401) 0.313
t (p) −3.448 (0.004)** −3.675 (0.002)**
Contraction
Pre 0.76 (0.10) 0.77 (0.07)
Post 1.25 (0.31) 0.94 (0.09)
Difference −0.49 (0.32) −0.18 (0.11) 3.784 (0.001)** 1.144
t (p) −5.913 (<0.001)** −6.339 (<0.001)**
VL MT (cm) Resting
Pre 0.93 (0.07) 0.94 (0.07)
Post 1.11 (0.17) 1.04 (0.13)
Difference −0.18 (0.17) −0.10 (0.13) 1.222 (0.232) 0.443
t (p) −4.026 (0.001)** −3.117 (0.008)**
Contraction
Pre 1.16 (0.07) 1.19 (0.08)
Post 1.38 (0.14) 1.22 (0.07)
Difference −0.23 (0.15) −0.03 (0.13) 4.031 (<0.001)** 1.192
t (p) −5.639 (<0.001)** −0.920 (0.373)
SOL MT (cm) Resting
Pre 1.06 (0.07) 1.06 (0.08)
Post 1.16 (0.18) 1.16 (0.13)
Difference −0.11 (0.20) −0.10 (0.15) 0.092 (0.927) 0.035
t (p) −2.063 (0.058) −2.621 (0.020)*
Contraction
Pre 1.15 (0.08) 1.15 (0.08)
Post 1.40 (0.22) 1.32 (0.09)
Difference −0.26 (0.25) −0.17 (0.13) 1.319 (0.198) 0.476
t (p) −3.913 (0.002)** −4.981 (<0.001)**
Values are presented as mean (SD).
ECT: eccentric contraction training, CCT: concentric contraction training, VMO: vastus medialis, MT: muscle thickness, VL: vastus lateralis, SOL: soleus.
*p<0.05, **p<0.01.
cle proportions and sizes of type II fibers [36,40,41]. It was also reported that slow-velocity ECT, when performed by those with chronic stroke, increases the binding force be- tween myosin and actin and induces simultaneous con- traction of type I and type II muscle fibers [17]. Therefore, it is considered that the low-velocity ECT used in this study significantly increased the MT in chronic stroke participants.
Increase in MT can be considered as occurring with a corre- sponding increase in MS.
The MS was significantly increased after training in both groups, with greater increases observed in the ECT group
than in the CCT group. The greater MS observed in the ECT
group can be explained by the following theories: (1) ECT
causes enhanced neural stimulation within the muscle as it
increases the stretch of muscle spindles. The muscle spindle
stretch, which stimulates the nerves that transmit neural im-
pulses to the muscle, in turn increases the concentric con-
traction force of the muscle [42]; (2) ECT has been reported
to generate greater force during concentric contraction by
storing elastic energy in muscle fibers and tendons [43]; (3)
It has been reported that ECT leads to muscle hypertrophy,
especially of type II muscle fibers, which increases the con-
Lim and Lee: Two types of muscle contraction training in chronic stroke patients 161
Table 3. Mean (1 SD) values of muscle strength and results for statistical comparisons (N=30)
Measures ECT (n=15) CCT (n=15) t (p) Cohen’s d
KE strength (kg)
Pre 10.33 (2.26) 10.27 (1.75)
Post 19.13 (2.64) 15.67 (1.84)
Difference −8.80 (2.04) −5.40 (2.47) 4.171 (<0.001)* 1.215
t (p) −16.687 (<0.001)* −8.458 (<0.001)*
APF strength (kg)
Pre 8.40 (1.06) 8.80 (1.21)
Post 12.60 (1.06) 11.20 (1.61)
Difference −4.20 (0.41) −2.40 (1.12) 2.813 (0.009)* 0.923
t (p) −39.287 (<0.001)* −8.290 (<0.001)*
Values are presented as mean (SD).
ECT: eccentric contraction training, CCT: concentric contraction training, KE: knee extension, APF: ankle plantar flexion.
*p<0.01.
Figure 4. Graph of VAS measurement results of eccentric con- traction training group and concentric contraction training group after 6 weeks of intervention. VAS: visual analog scale, ECT: ec- centric contraction training, CCT: concentric contraction training.
centric contraction force [40]. In this study, we could not ex- perimentally demonstrate the enhanced nerve stimulation nor increases in stored elastic energy. However, MT increase was confirmed with the RUSI. Therefore, it is considered that ECT produces greater KE and APF strengths than CCT due to MT increases caused by increased type II fiber size.
It is generally known that DOMS is more likely to occur during eccentric contraction. Bubbico and Kravitz [2]
showed that overstretching during eccentric contraction causes excessive release of calcium ions from the sarcoplas- mic reticulum which contribute to DOMS by disrupting muscle voltage regulating sensors. Furthermore, over- stretching due to eccentric contraction does not cause over-
lap between myosin and actin filaments but results in excess allowable capacity of connective tissue and other proteins in the sarcomere. Eventually, repetitive eccentric loads dam- age muscle cells and lead to DOMS [10]. ECT at a strength close to maximum resistance is also known to induce DOMS [2]. In this study however, ECT produced a significantly lower VAS than CCT. This is considered to be due to the ECT range and intensity. In this study, the ECT range was between 15 and 75 degrees of knee joint angle [15]. The training intensity was determined using a dosing test per- formed every 2 weeks and based on the strength of the para- lyzed lower limb. The training posture can prevent over- stretching and appropriate training intensity can lower DOMS. This is similar to the findings of an earlier study by Lavender and Nosaka [34] where elderly and young adult participants performed ECT for 6 weeks with the elderly subjects reporting less DOMS than the young adults. The re- searchers explained that the elderly participants had less DOMS because their range of motion while performing ECT was slightly less than that of the young adults. The re- searchers further explained that the lesser DOMS was also because ECT was performed at submaximal intensities.
CCT can be performed at a similar range as ECT, but as dos- ing tests are not used in CCT, optimal training intensity can- not be determined for each participant. This means that there is a possibility that the CCT intensities in this study were not ideal. In this study, it is considered that the relatively high DOMS recorded in the CCT group was due to this unstable MS.
This study had the following limitations: (1) only mus-
cle-related properties were considered as dependent
variables. It is recommended that future studies investigate the effects of ECT through functional evaluation; (2) there was a necessity to study related variables through analysis of the correlation between dependent variables; (3) more par- ticipants should be recruited in future studies to better repre- sent characteristics of the contraction training types for chronic stroke survivors.
In this study, 6 weeks of ECT for persons with chronic stroke showed significantly greater improvements in MT, MS, and decreased DOMS compared to CCT. Therefore, ECT is more effective in the rehabilitation of chronic stroke survovrs than CCT.
Acknowledgements
This research was supported by the Basic Science Research Program of the National Research Foundation of Korea (NRF-2018R1D1A1B07042870).
Conflict of Interest
The authors declared no potential conflicts of interest with respect to the authorship and/or publication of this article.
References
1. Herzog W, Leonard TR, Joumaa V, Mehta A. Mysteries of mus- cle contraction. J Appl Biomech 2008;24:1-13.
2. Bubbico A, Kravitz L. Eccentric exercise: a comprehensive re- view of a distinctive training method. IDEA Fit J 2010;7:50-9.
3. Lindstedt SL, LaStayo PC, Reich TE. When active muscles lengthen: properties and consequences of eccentric contractions.
News Physiol Sci 2001;16:256-61.
4. McHugh MP, Connolly DA, Eston RG, Gleim GW. Exercise-in- duced muscle damage and potential mechanisms for the repeated bout effect. Sports Med 1999;27:157-70.
5. Engardt M, Knutsson E, Jonsson M, Sternhag M. Dynamic mus- cle strength training in stroke patients: effects on knee extension torque, electromyographic activity, and motor function. Arch Phys Med Rehabil 1995;76:419-25.
6. Lee M, Carroll TJ. Cross education: possible mechanisms for the contralateral effects of unilateral resistance training. Sports Med 2007;37:1-14.
7. Roig M, Macintyre DL, Eng JJ, Narici MV, Maganaris CN, Reid WD. Preservation of eccentric strength in older adults: evidence, mechanisms and implications for training and rehabilitation. Exp Gerontol 2010;45:400-9.
8. Byrne C, Twist C, Eston R. Neuromuscular function after ex- ercise-induced muscle damage: theoretical and applied implications. Sports Med 2004;34:49-69.
9. Lockhart NC, Brooks SV. Protection from contraction-induced
injury provided to skeletal muscles of young and old mice by passive stretch is not due to a decrease in initial mechanical damage. J Gerontol A Biol Sci Med Sci 2006;61:527-33.
10. Balnave CD, Allen DG. Intracellular calcium and force in single mouse muscle fibres following repeated contractions with stretch. J Physiol 1995;488:25-36.
11. de Hoyo M, Pozzo M, Sañudo B, Carrasco L, Gonzalo-Skok O, Domínguez-Cobo S, et al. Effects of a 10-week in-season eccen- tric-overload training program on muscle-injury prevention and performance in junior elite soccer players. Int J Sports Physiol Perform 2015;10:46-52.
12. Douglas J, Pearson S, Ross A, McGuigan M. Chronic adapta- tions to eccentric training: a systematic review. Sports Med 2017;
47:917-41.
13. Fernandez-Gonzalo R, Fernandez-Gonzalo S, Turon M, Prieto C, Tesch PA, García-Carreira Mdel C. Muscle, functional and cognitive adaptations after flywheel resistance training in stroke patients: a pilot randomized controlled trial. J Neuroeng Rehabil 2016;13:37.
14. Park SK, Yang DJ, Uhm YH, Heo JW, Kim JH. The effect of vir- tual reality-based eccentric training on lower extremity muscle activation and balance in stroke patients. J Phys Ther Sci 2016;
28:2055-8.
15. LaStayo P, Marcus R, Dibble L, Wong B, Pepper G. Eccentric versus traditional resistance exercise for older adult fallers in the community: a randomized trial within a multi-component fall re- duction program. BMC Geriatr 2017;17:149.
16. Johnson SL, Fuller DK, Donnelly B, Caputo JL. Effect of an 8-week eccentric training program on strength and balance in older adults. Int J Exerc Sci 2018;11:468-78.
17. Park SK, Kim JH. Effects of isokinetic eccentric training on low- er extremity muscle activation and walking velocity in stroke patients. J Korean Phys Ther 2015;27:190-5.
18. Fritz K. High intensity intervals and gait training for a patient with heart failure and Parkinson disease in a skilled nursing fa- cility: a case report. DUNE: DigitalUNE 2017.
19. Franke RA, Baroni BM, Rodrigues R, Geremia JM, Lanferdini FJ, Vaz MA. Neural and morphological adaptations of vastus lat- eralis and vastus medialis muscles to isokinetic eccentric training. Motriz: Revista de Educação Física 2014;20:317-24.
20. Giles LS, Webster KE, McClelland JA, Cook J. Can ultrasound measurements of muscle thickness be used to measure the size of individual quadriceps muscles in people with patellofemoral pain? Phys Ther Sport 2015;16:45-52.
21. Marín PJ, Ferrero CM, Menéndez H, Martín J, Herrero AJ.
Effects of whole-body vibration on muscle architecture, muscle strength, and balance in stroke patients: a randomized controlled trial. Am J Phys Med Rehabil 2013;92:881-8.
22. Chleboun GS, Busic AB, Graham KK, Stuckey HA. Fascicle length change of the human tibialis anterior and vastus lateralis during walking. J Orthop Sports Phys Ther 2007;37:372-9.
23. E Lima KM, Carneiro SP, Alves Dde S, Peixinho CC, de Oliveira LF. Assessment of muscle architecture of the biceps femoris and vastus lateralis by ultrasound after a chronic stretching program.
Clin J Sport Med 2015;25:55-60.
24. Fujiwara K, Toyama H, Asai H, Maeda K, Yaguchi C. Regular heel-raise training focused on the soleus for the elderly: evalua- tion of muscle thickness by ultrasound. J Physiol Anthropol
Lim and Lee: Two types of muscle contraction training in chronic stroke patients 163
2010;29:23-28.
25. Fujiwara K, Asai H, Toyama H, Kunita K, Yaguchi C, Kiyota N, et al. Changes in muscle thickness of gastrocnemius and soleus associated with age and sex. Aging Clin Exp Res 2010;22:24-30.
26. Koski JM, Saarakkala S, Helle M, Hakulinen U, Heikkinen JO, Hermunen H, et al. Assessing the intra- and inter-reader reli- ability of dynamic ultrasound images in power Doppler ultrasonography. Ann Rheum Dis 2006;65:1658-60.
27. Krebs DE, Scarborough DM, McGibbon CA. Functional vs.
strength training in disabled elderly outpatients. Am J Phys Med Rehabil 2007;86:93-103.
28. Piao C, Yoshimoto N, Shitama H, Makino K, Wada F, Hachisuka K. Validity and reliability of the measurement of the quardriceps femoris muscle strength with a hand-held dynamometer on the affected side in hemiplegic patients. J UOEH 2004;26:1-11.
29. Hasenoehrl T, Wessner B, Tschan H, Vidotto C, Crevenna R, Csapo R. Eccentric resistance training intensity may affect the severity of exercise induced muscle damage. J Sports Med Phys Fitness 2017;57:1195-204.
30. Kim J, Lee J. The relationship of creatine kinase variability with body composition and muscle damage markers following eccen- tric muscle contractions. J Exerc Nutrition Biochem 2015;19:
123-9.
31. Komulainen J, Takala TE, Vihko V. Does increased serum crea- tine kinase activity reflect exercise-induced muscle damage in rats? Int J Sports Med 1995;16:150-154.
32. Sorichter S, Mair J, Koller A, Gebert W, Rama D, Calzolari C, et al. Skeletal troponin I as a marker of exercise-induced muscle damage. J Appl Physiol (1985) 1997;83:1076-82.
33. Manfredi TG, Fielding RA, O'Reilly KP, Meredith CN, Lee HY, Evans WJ. Plasma creatine kinase activity and exercise-induced muscle damage in older men. Med Sci Sports Exerc 1991;23:
1028-34.
34. Lavender AP, Nosaka K. Comparison between old and young men for changes in makers of muscle damage following volun-
tary eccentric exercise of the elbow flexors. Appl Physiol Nutr Metab 2006;31:218-25.
35. Ward T, Lindley M, Bolton C, Greenhaff P, Evans R, Steiner M.
Eccentric Cycling: A Potential Training Modality in Chronic Disease. A Feasibility Study in Healthy Males. Paper presented at: D51. PHYSIOLOGY AND PHYSICAL ACTIVITY IN PULMONARY REHABILITATION; 2018 May 23; San Diego, USA. p. A7063.
36. Cadore EL, González‐Izal M, Pallarés JG, Rodriguez‐Falces J, Häkkinen K, Kraemer W, et al. Muscle conduction velocity, strength, neural activity, and morphological changes after eccen- tric and concentric training. Scand J Med Sci Sports 2014;24:
e343-52.
37. Norrbrand L, Fluckey JD, Pozzo M, Tesch PA. Resistance train- ing using eccentric overload induces early adaptations in skeletal muscle size. Eur J Appl Physiol 2008;102:271-81.
38. Snow LM, Low WC, Thompson LV. Skeletal muscle plasticity after hemorrhagic stroke in rats: influence of spontaneous phys- ical activity. Am J Phys Med Rehabil 2012;91:965-76.
39. English C, McLennan H, Thoirs K, Coates A, Bernhardt J. Loss of skeletal muscle mass after stroke: a systematic review. Int J Stroke 2010;5:395-402.
40. Hortobágyi T, Zheng D, Weidner M, Lambert NJ, Westbrook S, Houmard JA. The influence of aging on muscle strength and muscle fiber characteristics with special reference to eccentric strength. J Gerontol A Biol Sci Med Sci 1995;50:B399-406.
41. Paddon-Jones D, Leveritt M, Lonergan A, Abernethy P.
Adaptation to chronic eccentric exercise in humans: the influ- ence of contraction velocity. Eur J Appl Physiol 2001;85:466-71.
42. Dietz V, Schmidtbleicher D, Noth J. Neuronal mechanisms of human locomotion. J Neurophysiol 1979;42:1212-22.
43. Doan BK, Newton RU, Marsit JL, Triplett-McBride NT, Koziris LP, Fry AC, et al. Effects of increased eccentric loading on bench press 1RM. J Strength Cond Res 2002;16:9-13.