http://crossmark.crossref.org/dialog/?doi=10.14474/ptrs.2016.5.4.210&domain=pdf&date_stamp=2016-12-25
Received: 29 November, 2016 Revised: 16 December, 2016 Accepted: 19 December, 2016 Corresponding author: Wan-Hee Lee
Department of Physical Therapy, College of Health and Welfare, Sahmyook University, 815 Hwarang-ro, Nowon-gu, Seoul 01795, Republic of Korea Tel: 82-2-3399-1633 Fax: 82-2-3399-1639 E-mail: [email protected]
This is an Open-Access article distributed under the terms of the Creative Commons Attribution Non-Commercial License (http://creativecommons.org/licens es/by-nc/4.0) which permits unrestricted non-commercial use, distribution, and reproduction in any medium, provided the original work is properly cited.
Copyright © 2016 Korean Academy of Physical Therapy Rehabilitation Science
https://doi.org/10.14474/ptrs.2016.5.4.210 pISSN 2287-7576
eISSN 2287-7584
Phys Ther Rehabil Sci 2016, 5 (4), 210-214 www.jptrs.org
Changes of abdominal muscle thickness during stable and unstable surface bridging exercise in young people
Tae Hoon Kim
a, Joohee Hahn
b, Ju-Ri Jeong
c, Changjoo Lee
d, You Jin Kim
d, Sung Min Choi
d, Da Young Jeon
d, Jin Hwa Lee
d, In-Hyuk Lim
e, Wan-Hee Lee
daSunshine Care Physical Therapy, New York, NY, USA
bDepartment of Physical Therapy, The Graduate School, Sahmyook University, Seoul, Republic of Korea
cMusculoskeletal Center, Samsung Seoul R&D Medical Clinic, Seoul, Republic of Korea
dDepartment of Physical Therapy, College of Health and Welfare, Sahmyook University, Seoul, Republic of Korea
eDepartment of Physical Therapy, Yeoju Institute of Technology, Yeoju, Republic of Korea
Objective: The aim of this study was to measure the muscle architectural parameters of abdominal muscles in healthy individuals by rehabilitative ultrasound imaging (RUSI) and to investigate their changes after bridging exercise in various environments.
Design: Cross-sectional study.
Methods: The study included 40 healthy participants (19 men, 21 women). Subjects were randomly allocated to a stable surface group (SG, n=20) or an unstable surface group (UG, n=20). The participants assumed three positions in rest, bridging exercise with knee flexion 60o, and bridging exercise with knee flexion 90o for the measurement of abdominal muscle thickness by RUSI. For the resting position, the participants held the head neutral in a hook-lying position and the dominant side was measured. For con- traction, the participants performed the bridging exercise with the knee joint in 60o and 90o of flexion for 10 seconds each.
Results: For transversus abdominis, external oblique muscle thickness, within the stable surface group and the unstable surface group, no significant contraction difference was observed in both the 60o and 90o bridge exercise conditions. Contraction differ- ence of internal oblique muscle was significantly larger at 90o than at 60o within the SG (p<0.05). But within the UG, no significant contraction difference was shown. There was no significant contraction difference between the surface group and the unstable SG at 60o condition and at 90o condition in all measured muscles.
Conclusions: The contraction difference is different for each muscle during bridge exercise with knee flexion 60o and bridging exercise with knee flexion 90o. Muscle contraction difference is generally large when exercised on an unstable surface than a stable surface, but these are not statistically significant when bridging exercise is performed using dynamic air cushion for unstable surface.
Key Words: Abdominal muscles, Abdominal oblique muscles, Exercise, Ultrasonography
Introduction
The core muscle, like the corset, is located in the lum- bar-pelvic region [1]. The lumbar muscle is an important muscle because it provides mobility and stability during var- ious movements [2]. The core stability is divided into the roles of global muscles and local muscles [3]. The local mus-
cles are close to the spine and must act before the global muscle moves to stabilize the lumbopelvic region. On the other hand, the global muscles are located close to the sur- face and generate force and torque [1]. In order to stabilize the spine, it is important to harmonize the global and local muscles without activating any one muscle [4].
Bridging exercise is a typical method for stabilizing the
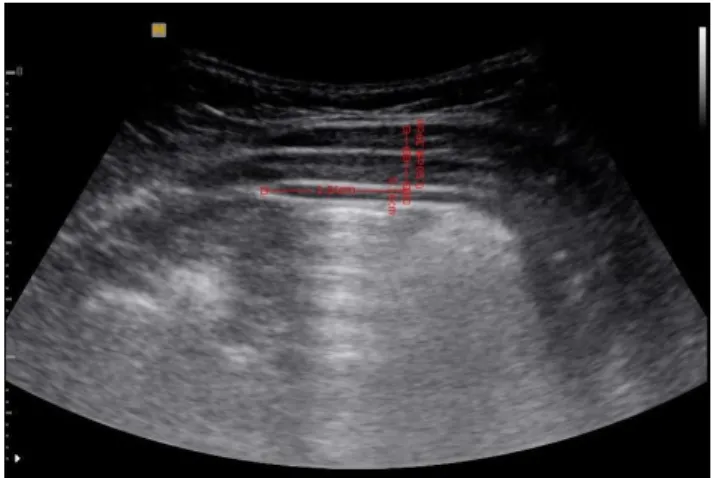
Figure 1. Placement of probe. Figure 2. Measurement of muscle thickness.
trunk muscles. It is known to enhance muscle coordination patterns to generate the overall torque of the global muscle and the stability of the local muscle [4]. Bridging exercise enhance the neuromuscular control of trunk flexor and ex- tensor muscles and enhancing stability of the trunk and lum- bar region by strengthening the pelvis and lower limb mus- cles [5]. In addition, many studies have been conducted through various methods and modifications. To evaluate the effects of bridging exercise, electromyography is often used [1,5-9]. However there is still a lack of study to investigate the mechanism of motor function improvement after bridg- ing exercise, especially from the muscle fascicle level.
The muscle architecture defined by the geometric ar- rangement of the fascicle affects muscle function which characterizes and specifies the muscle’s ability to generate power [10]. Recently, rehabilitative ultrasound imaging (RUSI) has been applied to measure skeletal muscle struc- ture [11,12]. RUSI can distinguish between muscle and tis- sue to produce high-quality images of the muscle structure.
It is also possible to quantitatively measure muscle structure such as fiber size, thickness, length, cross-sectional area, and pennation angle [13].
The purpose of this study was, therefore, to measure the muscle architectural parameters of transversus abdominis (TrA), internal oblique (IO), and external oblique (EO) in healthy individuals by RUSI and to investigate their changes after bridging exercise in various environments. It will help us to understand the biomechanical mechanisms of exercise.
We hypothesize that RUSI could distinguish the changes af- ter bridging exercise and that the exercise might be related to the changes of muscle architecture.
Methods Subjects
Forty healthy individuals (19 men, 21 women) volun- tarily participated in the study. Healthy subjects aged be- tween 18 and 28 years, with a full active range of motion and who had no history of skeletal muscle pain were recruited for the study. The exclusion criteria were: past or present musculoskeletal or neuromuscular disorders in the lower ex- tremity, pelvic, and lower back; pregnancy; malignant tu- mors; and obesity body mass index (BMI) >30 kg/m
2. The study was approved by the Institutional Review Board of the Sahmyook University (SYUIRB 2-1040781-AB-N-01- 2016110HR) in Seoul.
Procedures
Subjects were randomly allocated to a stable surface group (SG, n=20) or an unstable surface group (UG, n=20).
SG performed these exercise on the ground and UG put a dy- namic air cushion (TOGU, Prien-Bachham, Germany) un- der the feet. The participants assumed three positions at rest, bridging exercise with knee flexion 60
o(BEKS), and bridg- ing exercise with knee flexion 90
o(BEKN) for the measure- ment of abdominal muscle thickness. For the resting posi- tion, the participants held the head neutral in a hook-lying position; the dominant side was measured. For contraction, the participants performed the bridging exercise with the knee joint at 60
oflexion for 10 seconds, and afterward with the knee joint flexion 90
o.
Muscle thickness measurement was performed with a
Medison Mysono portable ultrasound system (U5; Samsung
Medison, Seoul, Korea). In this study, the portable ultra-
Table 2. Comparison of baseline muscle thickness (N=40) Muscle Condition
(mm)
SG (n=20)
UG
(n=20) t(p)
TrA Rest 2.55 (0.72) 2.46 (0.81) 0.358 (0.722)a BEKS 3.54 (1.25) 3.57 (1.52)
BEKN 4.02 (1.47) 3.68 (1.60)
IO Rest 7.78 (1.56) 6.78 (2.12) 1.689 (0.099) BEKS 8.07 (2.05) 8.16 (2.85)
BEKN 8.65 (2.04) 8.05 (2.63)
EO Rest 5.05 (1.06) 4.43 (1.12) 1.772 (0.084) BEKS 4.69 (1.35) 3.87 (1.07)
BEKN 4.76 (1.03) 4.07 (1.21) Values are presented as mean (SD).
SG: stable surface group, UG: unstable surface group, TrA: trans- versus abdominis, IO: internal oblique, EO: external oblique, BEKS:
bridging exercise with knee flexion 60o, BEKN: bridging exercise with knee flexion 90o.
aComparison of baseline muscle thickness in rest condition
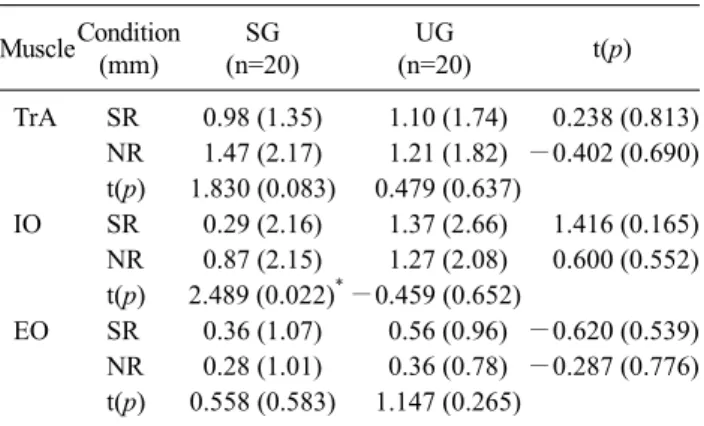
Table 3. Comparisons of muscle contraction difference (N=40) MuscleCondition
(mm)
SG (n=20)
UG
(n=20) t(p)
TrA SR 0.98 (1.35) 1.10 (1.74) 0.238 (0.813) NR 1.47 (2.17) 1.21 (1.82) −0.402 (0.690) t(p) 1.830 (0.083) 0.479 (0.637)
IO SR 0.29 (2.16) 1.37 (2.66) 1.416 (0.165) NR 0.87 (2.15) 1.27 (2.08) 0.600 (0.552) t(p) 2.489 (0.022)*−0.459 (0.652)
EO SR 0.36 (1.07) 0.56 (0.96) −0.620 (0.539) NR 0.28 (1.01) 0.36 (0.78) −0.287 (0.776)
t(p) 0.558 (0.583) 1.147 (0.265)
Values are presented as mean (SD).
SG: stable surface group, UG: unstable surface group, TrA: trans- versus abdominis, IO: internal oblique, EO: external oblique, SR:
contraction difference of rest and bridging exercise with knee flexion 60o, NR: difference in contraction of rest and bridging exercise with knee flexion 90o.
*p<0.05.
Table 1. Characteristics of the subjects (N=40)
Parameter SG (n=20) UG (n=20)
Gender (male/female) 9/11 10/10
Age (y) 22.65 (1.87) 22.90 (1.97)
Height (cm) 166.92 (5.98) 168.51 (9.18)
Weight (kg) 60.95 (7.87) 59.57 (11.96)
Body mass index (kg/m2) 21.79 (1.67) 20.76 (2.42)
Waist (cm) 78.17 (6.49) 76.84 (9.20)
Values are presented as number only or mean (SD).
SG: stable surface group, UG: unstable surface group.
sound with a 5-MHz curvilinear transducer was used to ob- tain images [14]. The probe was placed horizontally on the middle of abdominal region between the 11th costal carti- lage and the anterior superior iliac crest (Figure 1) [15]. A coupling gel was applied to contact between the ultrasound probe and skin surface of the subject. At the end of the con- traction, the image was captured and saved.
We analyzed the image and calculated measurements of the abdominal muscle using Sante DICOM Viewer (Santesoft Ltd., Athens, Greece). The image was measured along a hor- izontal reference line located 2.5 cm from the edge mus- cle-fascia junction of TrA. Then the thickness of three mus- cles layers (EO, IO, TrA) were measured by drawing a verti- cal line in the horizontal reference line (Figure 2).
Statistical analysis
The data were analyzed by PASW Statistics ver. 18.0 (IBM Co., Armonk, NY, USA). Comparisons of subject’
general characteristics were performed using the independent t-test. Rest, BEKS, and BEKN data were analyzed using the paired t-test to describe within-group differences. The in- dependent t-test to test differences between the groups. The statistical significance level was 0.05 for all analyses.
Results
Demographic characteristics
The participants’ characteristics are presented in Table 1.
No significant differences in general characteristics were observed between the SG and the UG. 40 healthy partic- ipants (male=19, female=21) with mean age 22.65 and 22.90 years, mean weight 60.95 and 59.57 kg, mean height 166.92 and 168.51 cm, mean BMI 21.79 and 20.76 kg/m
2, and waist circumference 78.17 and 76.84 cm, respectively.
Comparison of abdominal muscles (TrA, IO, EO) thick- ness
A summary of the results for the change of TrA muscle thickness is shown in Table 2 and 3. For TrA muscle thick- ness, within the SG, no significant contraction difference was observed in both the 60
oand 90
oconditions. The same result in the UG was observed. There was no significant con- traction difference between the surface group and the un- stable stable surface group at 60
ocondition. The same result was obtained at the 90
ocondition.
The thickness variation of IO is shown in Table 2 and 3.
For the SG, the contraction difference was significantly larg- er at 90
othan at 60
o. But for the UG, no significant contrac- tion difference was shown in both the 60
oand 90
ocondi- tions. There was no significant difference between groups in both 60
oand 90
oconditions. The results of EO are shown in Table 2 and 3, and are not different from those of TrA.
Discussion
Stabilization of the trunk is necessary to improve the sta- bility of the spine and pelvis in functional postures and movements, to strengthen the involved muscles, and to regu- late and balance muscle and movement [16]. Bridging ex- ercises for the stabilization of lumbopelvic focuses on re- training the coordination patterns of muscles between stabi- lization of local muscles and torque formation of global muscles [7].
The aim of this study was to measure the muscle architec- tural parameters of abdominal muscles in healthy indivi- duals by RUSI and to investigate their changes after bridg- ing exercise in various environments.
The results of the present study correspond well with those found in the earlier experimental studies. Lee et al. [8], reported that the the muscle activity of EO was higher than that of knee flexion 90
oat the knee angle 60
obut not significant. In this study, the contraction difference of EO was greater at 60
othan at 90
obut not statistically significant in both stable and UGs. In a previous study, when the knee angle was 90
oand 60
oin the bridging exercise, muscle activ- ity was higher at 60
othan at 90
ofor all the muscles mea- sured. However, in gluteus medius, it was higher at 90
othan at 60
o[8]. In this study, the contraction difference of TrA was larger at 90
othan at 60
o. The contraction difference of IO was significantly larger at 90
othan at 60
oin SG. This result shows that the contraction or activity of the muscles accord- ing to the angle of the knee during bridging exercise may be different depending on the muscles.
Czaprowski et al. [3] measured the muscle activity of rec- tus abdominis (RA), EO, and IO-TrA by surface electro- myography (EMG) while performing bridging exercises in various positions. There was no significant difference in muscle activity between supine bridge on stable surface and supine bridge on a BOSU; a balance cushion similar to TOGU. In the present study, there was no statistically sig- nificant difference in muscle contraction between the stable and unstable groups, resembling the results in the previous research.
In this study, although not statistically significant, the muscle contraction difference in the UG is larger than that of the SG at the same knee joint angle of IO and EO at the 60
oknee joint condition of the TrA. In previous studies, the max- imum voluntary isometric contraction (MVIC) values of the muscles were measured by EMG when performing normal bridging exercise (NBE), bridging with ball exercise (BBE), and bridging with sling exercise (BSE). As a result, %MVIC values were significantly higher during BSE than during BBE and NBE in IO, RA, multifidus, and erector spinae (ES). Especially in RA and ES, %MVIC values were sig- nificantly higher during BBE than during NBE [9]. In anoth- er previous study, normal back bridging (NB), back bridging using swiss ball (BUB) and back bridging using sling (BUS) are performed. Activation of TrA during BUB was sig- nificantly higher than during NB and BUS [1]. These results are similar to our studies.
The conclusion of this study is that the contraction differ- ence according to the knee angle is different for each muscle during bridging exercise. Muscle contraction difference is generally large when exercised on an unstable surface than a stable surface, but these are not statistically significant when bridging exercise is performed using TOGU with an unstable surface.
This study still has limitations to be discussed about using ultrasound to assess muscle structure. The EMG application method according to the change of the bridging posture is specified in the previous study, but there is no agreement about the RUSI yet. Finally, the number of subjects was limited. Future studies will require a larger sample size or multi-center design with a more specific protocol.
Conflict of Interest
The authors declared no potential conflicts of interest with respect to the authorship and/or publication of this article.
References
1. Ahmad I, Sharma S. Electromyographic activity profile of trans- verse abdominis and multifidus muscles during bridging exer- cise variants in colligiate cricketers. Physiother Occup Ther 2014;7:161-71.
2. Nabavi N, Mosallanezhad Z, Haghighatkhah HR, Mohseni Bandpeid MA. Reliability of rehabilitative ultrasonography to measure transverse abdominis and multifidus muscle dimen- sions. Iran J Radiol 2014;11:e21008.
3. Czaprowski D, Afeltowicz A, Gębicka A, Pawłowska P, Kędra A, Barrios C, et al. Abdominal muscle EMG-activity during bridge exercises on stable and unstable surfaces. Phys Ther Sport 2014;15:162-8.
4. Stevens VK, Coorevits PL, Bouche KG, Mahieu NN, Vanderstraeten GG, Danneels LA. The influence of specific training on trunk muscle recruitment patterns in healthy subjects during stabiliza- tion exercises. Man Ther 2007;12:271-9.
5. Park HJ, Oh DW, Kim SY. Effects of integrating hip movements into bridge exercises on electromyographic activities of selected trunk muscles in healthy individuals. Man Ther 2014;19:246-51.
6. Feldwieser FM, Sheeran L, Meana-Esteban A, Sparkes V.
Electromyographic analysis of trunk-muscle activity during sta- ble, unstable and unilateral bridging exercises in healthy individuals. Eur Spine J 2012;21 Suppl 2:S171-86.
7. Stevens VK, Bouche KG, Mahieu NN, Coorevits PL, Vanderstraeten GG, Danneels LA. Trunk muscle activity in healthy subjects dur- ing bridging stabilization exercises. BMC Musculoskelet Disord 2006;7:75.
8. Lee SK, Moon DC, Cho HR, Kim TY. Effects of trunk and neck extensor muscle activity on the bridging exercise according to knee joint angle. J Phys Ther Sci 2013;25:363-5.
9. Kang H, Jung J, Yu J. Comparison of trunk muscle activity dur- ing bridging exercises using a sling in patients with low back pain. J Sports Sci Med 2012;11:510-5.
10. Liu P, Wang Y, Hu H, Mao Y, Huang D, Li L. Change of muscle architecture following body weight support treadmill training for
persons after subacute stroke: evidence from ultrasonography.
Biomed Res Int 2014;2014:270676.
11. Kim MK, Ko YJ, Lee HJ, Ha HG, Lee WH. Ultrasound imaging for age-related differences of lower extremity muscle architec- ture. Phys Ther Rehabil Sci 2015;4:38-43.
12. Lee KB, Kim JG, Park HG, Kim JE, Kim HS, Lee WH.
Correlation between lateral abdominal, rectus femoris, and tri- ceps brachii muscle thickness and endurance during prone bridge exercise in healthy young adults. Phys Ther Rehabil Sci 2015;4:11-6.
13. Jeong JR, Han JH, Cho JE, Lee WH. Reliability and validity of a personal computer based muscle viwer for measuring upper tra- pezius and transveres abdominis muscle thickness. Phys Ther Rehabil Sci 2016;5:155-61.
14. Koppenhaver SL, Parent EC, Teyhen DS, Hebert JJ, Fritz JM.
The effect of averaging multiple trials on measurement error dur- ing ultrasound imaging of transversus abdominis and lumbar multifidus muscles in individuals with low back pain. J Orthop Sports Phys Ther 2009;39:604-11.
15. Ko YJ, Ha HG, Jeong J, Lee WH. Variations in lateral abdominal muscle thickness during abdominal drawing-in maneuver in three positions in a young healthy population. Phys Ther Rehabil Sci 2014;3:101-6.
16. Richardson CA, Snijders CJ, Hides JA, Damen L, Pas MS, Storm J. The relation between the transversus abdominis muscles, sac- roiliac joint mechanics, and low back pain. Spine (Phila Pa 1976) 2002;27:399-405.