Introduction
Orchard soil groundcover management systems (GMS) facilitate routine orchard operations, create optimal conditions for growth and productivity of fruits tree, and conserve soil resources. Oliveira and Merwin (2001) reported that bulk density was lower and soil porosity, greater under Mulch than those of other GMSs. Infiltration was more rapid under Mulch than other GMSs. GMS treatments and related management practices at this orchard had also substantially different long-term effects on soil physical conditions (Haynes, 1981; Poesen and Lavee. 1994).
Surface soil organic matter content, bulk density, cone index, macroscopic capillary length and hydraulic conductivity showed significant differences between tillage systems
and positions. Haynes (1981) found that the pH of the surface soil (0 to 10 cm) was significantly lower in the herbicide strip than in the grassed alley. He also found that the decrease in pH in the surface soil of the herbicide strip was also accompanied by a large decrease in the base saturation and a consequent significant increase in exchangeable acidity.
Soil erosion by water occurs when bare-sloped soil surface is exposed to rainfall, When the rainfall intensity exceeds the rate of soil intake, or infiltration rate, soil- surface runoff take places (Nearing et al., 1999; Mar- tínez et al, 2006). Runoff-prone soils have been shown to be particularly vulnerable to soil erosion by surface runoff during the summer time (Salako et al., 2006).
Seasonal losses of soil as impacted by rainfall event along with management practices are not well quantified for these soils. Soil erosion can occur in two stages: 1) detachment of soil particles by raindrop
Effects of Rainfall Events on Soil in Orchard Field under Herbicide Treatment.
1. Temporal Characteristics in Soil Physical and Chemical Properties
Doug-Young Chung 1 *, Pil-Joo Kim 2 , and Mi-Suk Park 1
1 Department of Bioenvironmental Chemistry College of Agriculture and Life Science Chungnam National Univ. Daejeon Korea
2 Division of Applied Life Science (BK21), Graduate School, Gyeongsang National University, 900, Kajwa-dong, Jinju 660-701, South Korea.
The periodic application effects of two different herbicides on soil physical properties were observed in a slightly hilly orchard of pear tree located on the southestern flank of the Palbong Mountain in Gongju Chungnam : (1) bare surface vegetation; (2) glyphosate-treated plot; (3) paraquat-treated plot. The slope of experimental plots ranged from 5.5 %to 10.2 %at an altitude of 125 m and 896 m 2 (28 m x 32 m) in area. The total respective rainfall events were 47, 52, 52 times during experimental period from 2006 to 2008, while approximately 65 percent of daily rainfall intensity from 2006 to 2008 was less than 20 mm a day. The organic matter contents on the surface 15 cm soil ranging from 1.23%to 1.84%in 2006 were changed into from 1.35
% to 2.28% in 2008 in the order of control > glyphosate > paraquat > bare plot in 2008, indicating that the herbicide treatment influenced the accumulation organic matter in soil. The changes in soil particle contents showed that the loss of soil particles in top 5 cm soil depth was greater in a bare soil than in other treatments such as control, glyphosate, and paraquat-treated plot. The net changes in the bulk densities showed that there were little variations between May of 2006 and Nov. of 2008 even though there were some losses of the soil particles. The soil strength of the glyphosate-treated bare plots was much greaterthan those of otherplots such as control, glyphosate, and paraquat plots. Howeverthe soil strengths in control plots were lowerthan those in the plots of glyphosate and paraquat treated ones.
Key words: Rainfall, Soil Properties, Soil strength, Orchard, Herbicides
Received : January 20. 2010 Accepted : February 11. 2010
*Corresponding author : Phone: +82428216739
Email: [email protected]
impact, splash, or flowing water; and 2) transport of detached particles by splash or flowing water. There- fore, soil erosion is a physical process requiring energy, and its control requires certain measures to dissipate this energy (Sands et al., 1979; Salako, 2002).
Field studies at a range of scales provide an understanding of the transport process and pathways for soil losses from the orchard areas. However this data is expensive to collect and it is often impractical to compare management strategies over a variety of soils and climatic conditions.
Therefore, simulation models can extend observed data to provide the potential soil loss for off site losses over a broad range of scenarios.
The main objectives of this investigation were to assess and to link, the changes of soil physcial properties at the orchard field under sporadic and periodic runoff during the rainy season. From this investigation, we expected to figure out processes involved in soil loss by runoff for the different surface coverage and practices at the orchard area.
Material and methods
Average annual rainfall of the investigation site established on orchard field located in runoff-prone soils in Banghungri Woosungmyon Gongjucity Choongchungnamdo was approximately 1270 mm with a localized heavy rain from late June to end of August.
The experimental plots, located on 5 to 6% slope which was reprofiled, was in area of 896 m 2 (28 m x 32 m) consisted of for four rows of pear trees. This site was divided into total 12 plots for three replications of one control and three of bare and two herbicide-treated plots.
Each plot (70 m 2 ), bounded on four sides by plastic borders which were set to depth of 30 cm, consisted of pear tree planted area (10m x 0.5 m), treated area (2.5 m x 10 m), and buffer zone (4.0 m x 10.0 m).
Pear trees were aligned in the slope direction, and mean tree canopy radius was 0.5 m. The plant-cover plot for herbicide applications, 2.5 m wide, ran across the slope.
Herbicides were only applied over the plant-cover area next to the pear trees and the rest of the area between the pear trees were left with weeds which were sometimes removed by a mower during the investigation period.
Paraquat (N,N'-Dimethyl-4,4'-bipyridinium dichloride) and glyphosate (N-phosphonomethyl glycine) were applied as pre- and post-emergence herbicides to control weeds over the plots. Herbicides were applied at 307g 10a -1 and 57.8g 10a -1 for glyphosate and paraquat, respectively (Fig. 1). Herbicide treatment methods and periods were as follows as shown in Table 1.
Daily precipitation To measure the daily precipi- tation we installed four rainfall gauges (Rainwise Weather Stations PORTLOG USA) to collect the rain on each treatment plot for 24 hour's period during a rainy day.
During the field experimental periods for three years from
F A (1)
E F
D (4)
E F
B (7)
E F
C (10)
E
10m B 1m
(2)
B (5)
A (8)
D
(11) 10m
C 1m (3)
C (6)
D (9)
A
(12) 10m
0.5m ← 2.5m → ← 4.0m → 0.5m ← 2.5m → ← 4.0m → 0.5m ← 2.5m → ← 4.0m → 0.5m ← 2.5m → ← 4.0m → A:bare-No vegetation cover; B:Control-Natural vegetation cover by weeds; C:Glyphosate (Pre-emergence);
D:Paraquat(Post-emergence); E:Buffer zone; F:Pear tree planted area
Fig. 1. Diagram of herbidcide treatment plots established at Banghungri investigation site. ( ) indicated plot number.
Table 1. Types of herbicide and their treatment methods and periods.
Treatment Treatment Method and remarks
Control(C) Natural vegetation with no herbicide throughout experimental period
Bare(B) Glyphosate and Selective herbicides were applied to removal all weeds before the rainy season.
Paraquat(P) Three applications when weeds grew to 30 cm tall on following three tems;
Late May(Before rainy season), Mid July(During rainy season), Late(August (After rainy season)
Glyphosate(G)
June of 2006 and Sept. of 2008, the total rainfall events were 47, 52, 52 times, respectively. and the highest daily precipitations were 71 mm, 91 mm, and 108.5 mm in July of 2006, September of 2007, and August of 2008, respectively.
Physical and chemical properties of soils for orchard field In order to evaluate the effects of soil physical properties on runoff and infiltration rates, 5 random soil cores for each plot were collected at depth of 0-15 cm by using a stainless cylinder of 98.13 cm 3 volume (5 cm in diameter and 15 cm in height) in May (or June in the first year) and November in 2006, 2007, and 2008.
Collected soil samples were air-dried, sieved to pass a 2-mm sieve and analyzed for pH and EC (1:5 soil/deionized water suspension), texture by the hydrometer method (Soil Survey Staff. 1993). Organic matter content was measured by the Walkley-Black method
in all soil samples (Klute, 2001). Bulk density was also measured with the core samples after drying for 48 hours at 105 . Duplicate analyses were conducted on each ℃ sample. As indirect measurement of soil compaction, soil strength of five random point were measured with Pocket penetrometer (Cole-parmer, USA) within each plot.
Results and discussion
Table 2 showed that the major species of weeds found on the plots of the investigation site.
Rainfall patterns The daily precipitation less than 10 mm which did not play an role to cause runoff or erosion in the fields was more than 50 percent for three years of experimental periods (Table 3). From the variation in rainfall events also among three years, we found that the relatively higher precipitation to cause runoff and erosion
Table 2. Weed species found on the experimental plots.
Weed Species
Gramineae Poa sphondylodes, Setaria viridis, Digitaria sanguinalis Polygonaceae Rumex crispus, Persicaria blumei
Caryophyllaceae Cerastium holosteoides var. hallaisanensm Stellaria aquatica, Stellaria media Cruciferae Cardamine flexuos, Capsella bursapastoris, Draba nemorosa var. hebecarpa
Rosaceae Duchesnea chrysantha, Rosa multiflora Leguminosae Trifolium repens
Borraginaceae Trigonotis peduncularis
Scrophulariaceae Veronica arvensis, Veronica persica, Veronica polita var. lilacina Plantaginales Plantago asiatica
Rubiales Rubia akane, Galium spurium,
Compositae Erigeron annuus, Artemisia feddei, Artemisia princeps var. orientalis, Taraxacum officinale, Lactuca indica var. laciniata, Sonchus oleraceus, Youngia denticulata
Table 3. Rainfall events and their distribution from 2006 to 2008.
Date
2006 2007 2008
Month Total Month Total Month Total
June July Aug. Sept. No(%) June July Aug. Sept. No(%) June July Aug. Sept. No(%)
< 10 mm 5 10 5 4 24(51.1) 8 4 6 8 26(50.0) 6 9 7 9 31(59.6)
< 20 mm 1 4 3 3 11(23.4) 1 5 2 8(15.4) 1 4 1 6(11.5)
< 30 mm 2 2 1 5(10.6) 2 1 1 1 5(9.6) 2 1 2 5(9.6)
< 40 mm 1 1 2(4.3) 1 3 4(7.7) 1 3 4(7.7)
< 50 mm 1 1(2.1) 3 3(5.8) 0.0
< 60 mm 1 1(2.1) 1 1(1.9) 1 1(1.9)
< 70 mm 2 2(4.3) 1 1(1.9) 1 1(1.9)
< 80 mm 1 1(2.1) 1 1 2(3.8) 1 1(1.9)
> 90 mm 0(0.0) 1 1 2(3.8) 2 1 3(5.8)
Total 9 22 9 7 47(100) 11 8 16 17 52(100) 11 17 12 12 52(100)
generally occurred in July and August. The critical precipitation level to cause a beginning of erosion on the orchard field was significantly influenced by a temporary rainfall characteristics not by a daily precipitation.
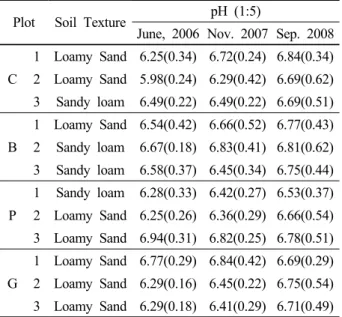
Soil characteristics Table 4 shows the physical and chemical properties of the soils collected from the experimental plots. The soil textures were sandy loam and loamy sand. The pH from June of 2006 to Nov. of 2007 was increased on control and herbicide-treated plots to where the weeds as organic matter were returned while pH was slightly decreased or remained in bare plot where there was little addition of organic matter because the weeds grown on the plot were frequently removed during the growing period. The increase of pH was slightly distinctive in plots of 2, 5, and 7 classified as control plot where the weeds grown were naturally returned to the plots.
Therefore, the weeds as organic matter could play a role to influence change in pH (Haynes, 1981).
Table 4. Soil physical and chemical properties rate mea- sured in June of 2006 and Sep. of 2007. Inside the parenthesis indicates standard deviation.
Plot Soil Texture pH (1:5)
June, 2006 Nov. 2007 Sep. 2008
C
1 Loamy Sand 6.25(0.34) 6.72(0.24) 6.84(0.34) 2 Loamy Sand 5.98(0.24) 6.29(0.42) 6.69(0.62) 3 Sandy loam 6.49(0.22) 6.49(0.22) 6.69(0.51)
B
1 Loamy Sand 6.54(0.42) 6.66(0.52) 6.77(0.43) 2 Sandy loam 6.67(0.18) 6.83(0.41) 6.81(0.62) 3 Sandy loam 6.58(0.37) 6.45(0.34) 6.75(0.44)
P
1 Sandy loam 6.28(0.33) 6.42(0.27) 6.53(0.37) 2 Loamy Sand 6.25(0.26) 6.36(0.29) 6.66(0.54) 3 Loamy Sand 6.94(0.31) 6.82(0.25) 6.78(0.51)
G
1 Loamy Sand 6.77(0.29) 6.84(0.42) 6.69(0.29) 2 Loamy Sand 6.29(0.16) 6.45(0.22) 6.75(0.54) 3 Loamy Sand 6.29(0.18) 6.41(0.29) 6.71(0.49) ( ) means the standard deviation for each average
Electrical conductivity (hereafter EC) did not influence the soil physical properties. The results of EC for three years from May of 2006 and Sep. of 2008 showed that EC was slightly increased in all experimental plots in 2007 and then slightly decreased in 2008 (Table 5).
The increase in EC was slightly greater in control plot than the other plots including bare and herbicide-treated plots. This indicates that changes of EC could be influenced
by the amount of organic matter throughout the experimental period for all plots.
Table 5. Changes in electrical conductivities measured from June of 2006 to Sep. of 2008. Inside the paren- thesis indicates standard deviation.
Plot EC(dS/m)
June, 2006 Nov. 2007 Sep. 2008
C
1 1.06(0.08) 1.21(0.17) 1.16(0.34) 2 0.92(0.19) 1.16(0.16) 1.12(0.22) 3 1.16(0.09) 1.27(0.15) 1.15(0.09)
B
1 1.01(0.14) 1.04(0.15) 0.98(0.27) 2 1.08(0.10) 1.11(0.06) 1.14(0.14) 3 1.12(0.12) 1.15(0.08) 1.09(0.13)
P
1 1.19(0.13) 1.22(0.17) 1.06(0.24) 2 1.12(0.08) 1.18(0.11) 1.03(0.19) 3 1.07(0.11) 1.14(0.07) 1.12(0.24)
G
1 1.12(0.09) 1.16(0.08) 1.11(0.15) 2 1.15(0.16) 1.19(0.12) 1.11(0.23) 3 1.18(0.09) 1.21(0.03) 1.09(0.18)
The initial organic matter contents for 12 plots were ranged from 1.23% (the lowest in plot 12) to 1.84%
(the highest in plot 10), showing these ranges of organic matter were slightly lower than those of the normal upland soils (Table 7). The increase in organic matter contents in the surface of each plot was lower on the plots treated with glyphosate and paraquat than those of the control plot in which the weeds were left over throughout the experimental period. The increase in the organic matter content on the surface soil (10-15 cm depth) for three years of investigation period was in the order of control
> glyphosate > paraquat > bare plot, indicating that removal of weeds from the plot influenced the accumulation organic matter in soil.
As seen in Table 6 the average net changes of organic matter content were about 0.62, 0.23, 0.44, and 0.46%
for control, bare, paraquat, and glyphosate, respectively.
And the most distinctive increase in organic matter was found in the control plot by about 0.62 % during two and a half years. We could conclude that the weeds grown in control plot was were returned to soil during the investigation plot. And the changes between fall and spring were little or slightly decreased whereas there were increased in organic matter regardless of treatment for the plots.
Rock fragments greater than 2 mm in diameter are
unattached pieces, that are strongly cemented or more resistant to rupture (Soil Survey Staff 1993). According to the Soil Survey Staff classification (1993), stones are in the size range of 2-75 mm with subclasses as fine stones (2-5 mm), medium stones (5-20 mm), and coarse stones (20-75 mm). Soils with abundant stones are gravelly, and the relative abundance of each of the 3 classes enables description as fine gravelly, medium gravely, and coarse gravelly, respectively (Nyssen et
al., 2001; Harrison et al., 2003).
Table 7-9 shows the changes in contents of stones and soil particles during June of 2006 and May of 2008.
As shown in tables, the contents of stones increased inn the bare plot from which the weeds were removed during the growing period, whereas the contents of soil particles were similar or slightly increased in all plots besides the bare plot. The stone contents regarding to the cross-sectional diameter varied and its distribution Table 6. Contents of organic matter on the surface soil (10-15 cm) for each plot during the experimental period.
Plot Organic matter (%)
2006 2007 2008
Sum (06-08)
Treatment No June Nov. △
(Nov-Jun) May Nov. △
(Nov-May) May Sep. △
(Sep-May)
C
1 1.82 2.15 0.33 2.09 2.37 0.28 2.36 2.28 -0.08 0.53
2 1.58 1.82 0.24 1.8 2.1 0.3 2.07 2.21 0.14 0.68
3 1.65 1.89 0.24 1.82 2.18 0.36 2.15 2.21 0.06 0.66
Avg. 1.68 1.95 0.27 1.90 2.22 0.31 2.19 2.23 0.04 0.62
B
1 1.28 1.26 -0.02 1.28 1.24 -0.04 1.35 1.39 0.04 -0.02
2 1.48 1.58 0.1 1.57 1.71 0.14 1.68 1.79 0.11 0.35
3 1.23 1.32 0.09 1.3 1.39 0.09 1.41 1.59 0.18 0.36
Avg. 1.33 1.39 0.06 1.38 1.45 0.06 1.48 1.59 0.11 0.23
P
1 1.38 1.53 0.15 1.53 1.74 0.21 1.72 1.84 0.12 0.48
2 1.27 1.41 0.14 1.4 1.55 0.15 1.54 1.64 0.1 0.39
3 1.35 1.52 0.17 1.52 1.61 0.09 1.60 1.78 0.18 0.44
Avg. 1.33 1.49 0.15 1.48 1.63 0.15 1.62 1.75 0.13 0.44
G
1 1.73 1.86 0.13 1.85 2.01 0.16 2.00 2.08 0.08 0.37
2 1.29 1.48 0.19 1.47 1.66 0.19 1.64 1.89 0.25 0.63
3 1.84 1.97 0.13 1.95 2.12 0.17 2.09 2.16 0.07 0.37
Avg. 1.62 1.77 0.15 1.76 1.93 0.17 1.91 2.04 0.13 0.46
Table 7. Percents of stone contents measured at the investigation sites of pear orchard area in 2006. (Unit : %)
Plot Stone content (%)
Soil Particles
Fine Medium Coarse Total
Treatment No June Nov. June Nov. June Nov. June Nov. △ (Nov-Jun) June Nov.
C
1 12.1 11.8 3.3 4.1 2.2 2.2 17.6 18.1 0.5 82.4 81.9
2 16.9 17.2 3.7 3.9 1.8 1.6 22.4 22.7 0.3 77.6 77.3
3 12.5 13.1 5.8 5.6 3.1 2.9 21.4 21.6 0.2 78.6 78.4
Avg. 13.8 14.0 4.3 4.5 2.4 2.2 20.5 20.8 0.3 79.5 79.2
B
1 13.5 13.7 5.2 5.4 4.3 4.3 23.0 23.4 0.4 77.0 76.6
2 16.8 16.9 4.3 4.5 4.5 4.7 25.6 26.1 0.5 74.4 73.9
3 14.7 15.1 4.7 4.8 3.8 4.1 23.2 23.6 0.4 76.8 76.4
Avg. 15.0 15.2 4.7 4.9 4.2 4.4 23.9 24.4 0.4 76.1 75.6
P
1 10.6 11.2 3.4 3.3 1.1 1.2 15.1 15.7 0.6 84.9 84.3
2 18.4 18.7 2.8 2.9 3.1 3.2 24.3 24.8 0.5 75.7 75.2
3 13.5 13.8 1.9 2.1 2.6 2.3 17.6 18.2 0.6 82.4 81.8
Avg. 14.2 14.6 2.7 2.8 2.3 2.2 19.0 19.6 0.6 81.0 80.4
G
1 14.2 13.8 1.2 2.3 3.2 3.6 19.0 19.7 0.7 81.0 80.4
2 8.2 7.8 3.5 4.3 1.9 2.5 14.1 14.6 0.5 85.9 85.5
3 16.3 15.7 1.0 1.6 1.9 1.6 18.7 18.9 0.2 81.3 81.1
Avg. 12.9 12.4 1.9 2.7 2.3 2.5 17.3 17.7 0.4 82.7 82.3
was in the order of fine (2-5 mm), medium (5-20 mm), and coarse (20-75 mm).
And the coarse stones were frequently found on the surface of the soil throughout the plots. From this, we assumed that the increase in stone contents caused by loss and leaching of soil particles in the bare plots during the rainy period might affects the pore size which could play a role as channel of transport of soil particle, especially the clay particles. Thus the pore size could become larger as more clay particles or soil surface exposed to air might
move downward with the precipitation for the plots where the content of stone and the size of stone were greater.
These changes in pore geometry followed by the transport of small soil particles can influence the water movement such as infiltration and percolation in soil.
The stone contents on the plots measured in 2008 were in the order of Bare > Control > Paraquat ≃ Glyphosate and their increases were by 0.2% to 0.43%
of those measured in 2006. We assumed that this could be caused by the relative loss of soil particles, especially Table 8. Percents of stone contents as stones measured at the investigation sites of pear orchard area in 2007. (Unit : %)
Plot Stone content (%)
Soil particles
Fine Medium Coarse Total
Treatment No May Nov. May Nov. May Nov. May Nov. △ (Nov-May) May Nov.
C
1 12.1 12.3 4.2 4.1 2.4 2.2 18.7 18.6 -0.10 81.3 81.4
2 17.2 17.4 3.7 3.9 1.3 1.3 22.2 22.6 0.40 77.8 77.4
3 13.9 13.8 5.4 5.4 1.9 1.6 21.2 20.8 -0.40 78.8 79.2
Avg. 14.4 14.5 4.4 4.5 1.9 1.7 20.7 20.7 -0.03 79.3 79.3
B
1 14.2 13.8 4.3 4.6 3.1 3.1 21.6 21.5 -0.10 78.4 78.5
2 16.8 16.6 3.5 3.9 3.8 4.1 24.1 24.8 0.70 75.9 75.5
3 15.2 14.8 4.3 4.5 3.3 3.6 22.8 23.1 0.30 77.2 77.1
Avg. 15.4 15.1 4.0 4.3 3.4 3.6 22.8 23.1 0.30 77.2 77.0
P
1 11.6 11.9 2.7 2.3 2.1 2.7 16.4 16.9 0.50 83.6 83.1
2 18.1 18.3 3.4 2.8 2.8 3.2 24.3 24.3 0.00 75.7 75.7
3 13.7 13.5 1.5 1.8 2.4 2.3 17.6 17.6 0.00 82.4 82.4
Avg. 14.5 14.6 2.5 2.3 2.4 2.7 19.4 19.6 0.17 80.6 80.4
G
1 13.6 13.7 2.4 2.6 3.3 2.8 19.3 19.1 -0.20 80.7 80.9
2 8.1 8.3 4.8 4.6 1.3 1.3 14.2 14.2 0.00 85.8 85.8
3 15.7 15.4 1.6 1.9 1.5 1.5 18.8 18.8 0.00 81.2 81.2
Avg. 12.5 12.5 2.9 3.0 2.0 1.9 17.4 17.4 -0.07 82.6 82.6
Table 9. Percents of stone contents as stones measured at the investigation sites of pear orchard area in 2008. (Unit : %)
Plot Stone content (%) Soil
Particles
Fine Medium Coarse Total
Treatment No May Sep. May Sep. May Sep. May Sep. △ (Sep.-May) May Sep.
C
1 12.3 12.8 4.1 4.3 2.0 2.0 18.4 19.1 0.70 81.6 80.9
2 17.6 15.8 4.0 3.9 1.3 1.4 22.9 21.1 -1.80 77.1 78.9
3 13.8 14.1 5.5 5.7 1.6 1.7 20.9 21.5 0.60 79.1 78.5
Avg. 14.6 14.2 4.5 4.6 1.6 1.7 20.7 20.6 -0.17 79.3 79.4
B
1 13.5 13.7 5.2 5.4 4.3 4.3 23.0 23.4 0.40 77.0 76.6
2 16.8 16.6 4.3 4.2 4.5 4.3 25.6 25.1 -0.50 74.4 74.9
3 14.7 15.1 4.7 4.8 3.8 4.1 23.2 24.0 0.80 76.8 76.0
Avg. 15.0 15.1 4.7 4.8 4.2 4.2 23.9 24.2 0.23 76.1 75.8
P
1 10.6 11.2 3.4 3.3 1.1 1.2 15.1 15.7 0.60 84.9 84.3
2 18.4 17.9 2.8 2.6 3.1 3.2 24.3 23.7 -0.60 75.7 76.3
3 13.5 13.8 1.9 2.1 2.2 2.0 17.6 17.9 0.30 82.4 82.1
Avg. 14.2 14.3 2.7 2.7 2.1 2.1 19.0 19.1 0.10 81.0 80.9
G
1 13.6 13.9 2.7 2.6 2.7 2.9 19.0 19.4 0.40 81.0 80.6
2 8.3 8.9 4.5 4.5 1.3 1.3 14.1 14.7 0.60 85.9 85.3
3 15.4 15.7 1.9 2.2 1.4 1.6 18.7 19.5 0.80 81.3 80.5
Avg. 12.4 12.8 3.0 3.1 1.8 1.9 17.3 17.9 0.60 82.7 82.1
clay or similar one.
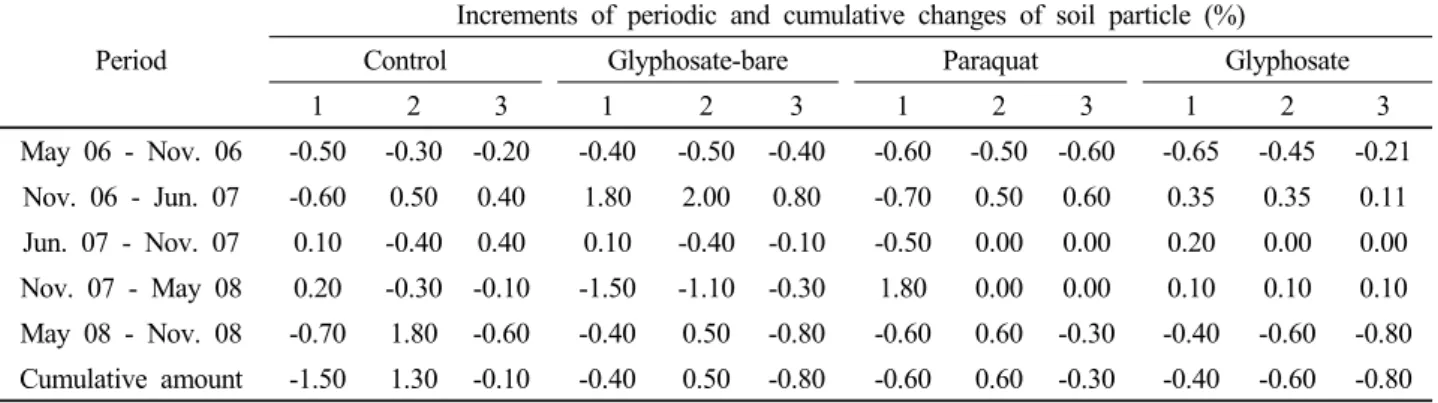
As shown in Fig. 3 the stone contents observed on the top soil ( 5 cm) at the investigation plots from < June of 2006 to Nov. of 2008 were slightly decreased throughout experimental period. However, the net changes in the stone contents ranged from -1.8 % (decrease) to 1.2% (increase).
To compare the influence among the treatments, we calculate the changes of soil particles throughout periods (Fig. 4). The results showed that the net changes of soil particles were distinctive in the bare plots and the average changes for the treatments were -3.0, -0.27, -0.13, and -0.33 % for bare plot, control, glyphosate, and paraquat, respectively. From these results, we could assume that the infiltration rate and soil strength on the bare plots could be changed significantly.
For changes in soil particle contents among the treatments, we found that the loss of soil particles in top soil (<
5 cm) was greater in a glyphosate-treated bare soil than in other treatments such as control, glyphosate, and paraquat-treated plot. However, the loss of soil particles in control plot was slightly less than in glyphosate, and paraquat-treated plots. Therefore, we could conclude that the loss of soil particles in the top soil ( < 5 cm) was significantly influenced by vegetation cover while there were a close relation between herbicide types in this experiment (Fig. 4).
Table 11 shows the statistical analysis of changes in soil particle distributions for the treatments of the plots for three years from June of 2006 to Nov. of 2008.
The results of the soil particle distribution for three years indicated that the standard deviation was in the order of Paraquat > Glyphosate > Control > Glyphosate- bare
As shown in Table 10, the standard deviations were relatively greater on the paraquat- and glyphosate-
Period
May-06 Nov-06 June07 Nov07 May08 Nov08
Percent of Stone (%)
12 14 16 18 20 22 24
26 Control-1
Control-2 Control-3 Gly-bare 1 Gly-bare 2 Gly-bare 3 Paraquat 1 Paraquat 2 Paraquat 3 Glyphosate 1 Glyphosate 2 Glyphosate 3
Fig. 3. The stone contents observed on top soil ( < 5 cm) of the plots from June of 2006 to Nov. of 2008.
Period
May-06 Nov-06 June07 Nov07 May08 Nov08
P e rce nt of S ton e (% )
70 75 80 85 90
Control-1 Control-2 Control-3 Gly-bare 1 Gly-bare 2 Gly-bare 3 Paraquat 1 Paraquat 2 Paraquat 3 Glyphosate 1 Glyphosate 2 Glyphosate 3
Fig. 4. The soil particle contents observed on top 5cm of the plots from June of 2006 to Nov. of 2008.
treated plots, indicating that there were large variations in soil particle losses depending on the treatment.
Table 10. Statistical analysis of changes in soil particle distributions for the treatments of the plots for three years from June of 2006 to Nov. of 2008.
Treatment Category Replication
1 2 3
C Average 81.58 77.68 78.77
Stdev 0.52 0.64 0.33
B Average 77.35 74.83 76.72
Stdev 0.87 0.75 0.45
P Average 84.18 75.72 82.25
Stdev 0.72 0.35 0.25
G Average 80.76 85.69 81.10
Stdev 0.26 0.25 0.30
Also we found that the percentages of periodic and cumulative increments of soil particle distributions were varied due to variation of soil physical properties, and that there were some loss of soil particles for all plots regardless of treatments. The loss in soil particle distributions were greater on the glyphosate- and paraquat- plots than those of on control and glyphosate-bare plots (Table 11).
The stone contents in soil profiles can influence the soil strength and root elongation, resulting increases of soil strength and prevention of elongation of deep- rooted plants, such as trees, from exploring the soil deeply (Salako et al. 2002, 2007; Rodrigue and Burger, 2004; Fasina et al., 2007). The influence of stone fragments on fine soil properties (Poesen and Lavee, 1994; Harrison, 2003) can also include increased water infiltration, decreased soil compaction (Sands, 1979), and
varying effects on overland flow and infiltration rate.
Therefore, it is possible that the presence of stones affects infiltration rate due to changes in certain physical and chemical properties of the fine soil fraction. Apart from these changes, they also create problems during soil sampling for estimation of properties such as bulk density (Harrison et al. 2003) as well as soil hydraulic properties (Sauer and Logsdon 2002; Salako et al.
2007). However, the presence of stone fragments on surface soil can be an advantage in soil conservation, as they serve as mulch that prevents soil loss through erosion and water loss by evaporation (Poesen and Lavee 1994; Nyssen et al. 2001).
The soil strength of the glyphosate-treated bare plot was much greater than those of other plots such as control, glyphosate, and paraquat plots where the weeds or weed residue were grown or remained. From this, we could assumed that the weeds whether it was alive or dead could attribute to loose the soil strength. But the soil strengths in control plots were lower than those in the plots of glyphosate and paraquat treated.
This indicates that the amount of biomass returned to the soil can be major factors in governing soil strength.
To verify the effect of treatments, we calculated the net changes in soil strength between investigation period of before and after rainy seasons. In Fig. 7, we found that there were net increase of soil strength by 0.8 to 1.2 kg on the bare plot and slight increase in the plot of glyphosate treatment. But there were decreases in soil strength in control amnd paraquat treatment plots (Fig. 5).
The long term use of agricultural machinery can cause extensive compaction in the top layer of soil. Compaction is also the process degrading a soil physical properties which influence all biological and many chemical processes
Table 11. Increments of periodic and cumulative changes of soil particle distributions on the plots for three years from June of 2006 to Nov. of 2008.
Period
Increments of periodic and cumulative changes of soil particle (%)
Control Glyphosate-bare Paraquat Glyphosate
1 2 3 1 2 3 1 2 3 1 2 3
May 06 - Nov. 06 -0.50 -0.30 -0.20 -0.40 -0.50 -0.40 -0.60 -0.50 -0.60 -0.65 -0.45 -0.21
Nov. 06 - Jun. 07 -0.60 0.50 0.40 1.80 2.00 0.80 -0.70 0.50 0.60 0.35 0.35 0.11
Jun. 07 - Nov. 07 0.10 -0.40 0.40 0.10 -0.40 -0.10 -0.50 0.00 0.00 0.20 0.00 0.00
Nov. 07 - May 08 0.20 -0.30 -0.10 -1.50 -1.10 -0.30 1.80 0.00 0.00 0.10 0.10 0.10
May 08 - Nov. 08 -0.70 1.80 -0.60 -0.40 0.50 -0.80 -0.60 0.60 -0.30 -0.40 -0.60 -0.80
Cumulative amount -1.50 1.30 -0.10 -0.40 0.50 -0.80 -0.60 0.60 -0.30 -0.40 -0.60 -0.80
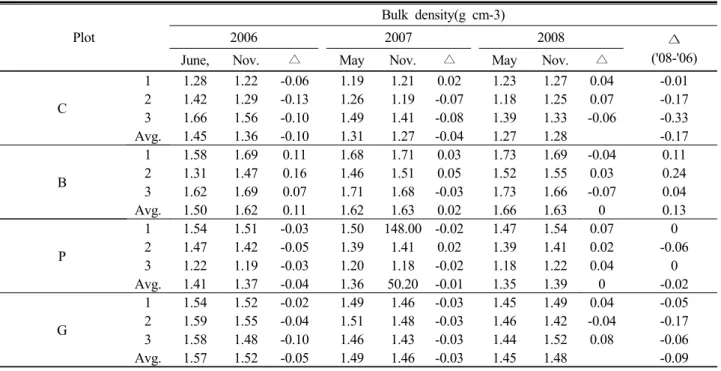
in the soil. Bulk density is related to natural soil characteristics such as texture, organic matter, soil structure, and gravel content. Generally, bulk densities of soils containing the stones are less than 1.6 g cm -3 (Lal, 1997; Hulugalle and Ezumah, 1991; Salako et al,. 2006a, 2006b, 2007).
The total soil bulk density (with gravel) related to the textural classes in the 15 cm soil layers in the pear orchard soils yielded relatively higher values ranging from 1.37 to 1.57 g cm -3 as compared with the relatively lower bulk densities of the upland soils. This could be interpreted as having relatively lower porosity regardless of pore sizes which could significantly influence water
flow characteristics within soils (Table 12).
To verify the effect of treatments on the bulk density based on the each measurement in a given investigation period, we calculated the net changes in bulk density between investigation period before and after rainy season.
In Fig. 6, we found that there were net increase of bulk density by 0.11 to 0.21 g cm -3 on the bare plot whereas there were decreases in bulk density by 0.19, 0.12, 0.06 for control, glyphosate, and paraquat treatment plots.
From this result for the two and half years of investigation period, we also found that the decrease in bulk density of control plot where the fully grown weeds was returned was larger by 0.07, and 0.12 g cm -3 than those of herbicide treated plots during the growing periods.
Summary
During the field experimental periods of three years, the daily rainfall intensity less than 20 mm a day were greater than 65 percent. However, there were many localized heavy rains of around 25 mm to 35 mm which came down within an short time to cause runoff and erosion. The soil textures which contained the stone contents ranging from approximately 15% to 25% in 2006 were classified as sandy loam and loamy sand.
Plot
B-1 B-2 B-3 C-1 C-2 C-3 G -1 G-2 G-3 P-1 P-2 P-3
Net c ha ng es of soil st rengt h( kg)
-0.6 -0.4 -0.2 0.0 0.2 0.4 0.6 0.8 1.0 1.2 1.4
June 2006 - Nov. 2006 Nov. 2006 - May 2007 May 2007 - Nov. 2007 Nov. 2007 - May 2008
Net change bwt June 2006 - May 2008
Fig. 5. Net changes of soil strength calculated before and after the rainy season at the investigation plots from June of 2006 to May of 2008. Above and below zero means loss and gain of soil particles, respectively.
Table 12. Changes of average bulk density measured with a soil sampling core at the investigation sites of pear orchard area.
Plot
Bulk density(g cm-3)
2006 2007 2008 ∆
('08-'06)
June, Nov. △ May Nov. △ May Nov. △
C
1 1.28 1.22 -0.06 1.19 1.21 0.02 1.23 1.27 0.04 -0.01
2 1.42 1.29 -0.13 1.26 1.19 -0.07 1.18 1.25 0.07 -0.17
3 1.66 1.56 -0.10 1.49 1.41 -0.08 1.39 1.33 -0.06 -0.33
Avg. 1.45 1.36 -0.10 1.31 1.27 -0.04 1.27 1.28 -0.17
B
1 1.58 1.69 0.11 1.68 1.71 0.03 1.73 1.69 -0.04 0.11
2 1.31 1.47 0.16 1.46 1.51 0.05 1.52 1.55 0.03 0.24
3 1.62 1.69 0.07 1.71 1.68 -0.03 1.73 1.66 -0.07 0.04
Avg. 1.50 1.62 0.11 1.62 1.63 0.02 1.66 1.63 0 0.13
P
1 1.54 1.51 -0.03 1.50 148.00 -0.02 1.47 1.54 0.07 0
2 1.47 1.42 -0.05 1.39 1.41 0.02 1.39 1.41 0.02 -0.06
3 1.22 1.19 -0.03 1.20 1.18 -0.02 1.18 1.22 0.04 0
Avg. 1.41 1.37 -0.04 1.36 50.20 -0.01 1.35 1.39 0 -0.02
G
1 1.54 1.52 -0.02 1.49 1.46 -0.03 1.45 1.49 0.04 -0.05
2 1.59 1.55 -0.04 1.51 1.48 -0.03 1.46 1.42 -0.04 -0.17
3 1.58 1.48 -0.10 1.46 1.43 -0.03 1.44 1.52 0.08 -0.06
Avg. 1.57 1.52 -0.05 1.49 1.46 -0.03 1.45 1.48 -0.09
The accumulation of the organic matter contents which were ranged from 1.23% to 1.84% during 2006 and 2008 was in the order of control > glyphosate > paraquat
> bare plot on the surface soil (10-15 cm depth). This indicated that the herbicide treatment influenced the accumulation organic matter in soil. The results of the changes in soil particle contents influenced by the rainfall events and their intensity among the treatments showed that the loss of soil particles in top soil ( < 5 cm depth) was greater in the bare plot than in other treatments such as control, glyphosate, and paraquat-treated plots. However, the loss of soil particles in control plot was slightly less than in two herbicide plots. The net changes of the bulk densities showed that there were little changes between Nov. of 208 and May of 2006 even though there were some losses of the soil particles.
We assumed that this could be attributed by the presence of a relatively high proportion of the stone content on the surface of soils. The soil strength of the bare plot was much greater than those of other plots such as control, glyphosate, and paraquat plots where the weeds or weed residue were grown or remained. But the soil strengths in control plots were lower than those in the plots of glyphosate and paraquat treatment.
We assumed that the amount of biomass returned to the soil could be major factors in governing soil strength.
References
Harrison R. B, A. B. Adams, C. Licata, B. Flaming, G. L.
Wagoner, E. Carpenter, and E. D. Vance. 2003. Quantifying deep-soil and coarse-soil fractions: avoiding sampling bias.
Soil Science Society of America Journal 67, 1602-1606.
Haynes, R. J. 1981. Soil pH decrease in the herbicide strip of grasses-down orchard. Soil Sci. 132.4. 274-278
Nyssen J., M. Halle, J. Poesen, J. Deckers, and J. Moeyersons.
2001. Removal of rock fragments and its effects on soil loss and crop yield, Tigray, Ethiopia. Soil Use and Management 17, 179-187. doi: 10.1079/SUM200173
Oliveira, M.T., and I. A. Merwin. 2001. Soil physical conditions in a New York orchard after eight years under different groundcover management systems. Plant and Soil 234(2):
233-237.
Poesen J, and H. Lavee. 1994. Rock fragments in topsoils:
significance and processes. CATENA 23, 1-28. doi: 10.1016/
0341-8162(94)90050-7
Salako, F. K., P. O. Dada, C. O. Adejuyigbe, M. O. Adedire, O.
Martins, C. A. Akwuebu, and O. E. Williams. 2007. Soil strength and maize yield after topsoil removal and application of nutrient amendments on a gravelly Alfisol toposequence.
Soil and Tillage Research 94, 21-35. doi: 10.1016/j.still.
2006.06.005
Salako, F. K., G. Tian, and B. T. Kang. 2002. Indices of root and canopy growth of leguminous cover crops in the savanna zone of Nigeria. Tropical Grasslands 36, 33-46.
Salako, F. K., G. Tian, G. Kirchhof, and G. E. Akinbola. 2006.
Soil particles in agricultural landscapes of a derived savanna in southwestern Nigeria and implications for selected soil properties. Geoderma 137, 90-99. doi: 10.1016/j.geoderma.
2006.06.017
Sands, R, E. L. Greacen, and C. J. Gerard. 1979. Compaction of sand soils in radiata pine forests. I. A penetrometer study.
Australian Journal of Soil Research 17, 101-113. doi:
10.1071/ SR9790101
Soil Survey Staff. 1993. 'Soil survey manual. Soil Conservation Service.' US Department of Agriculture Handbook 18.
(USDA: Washington, DC)
Plot
B : Bare Soil, C:Control, G:Glyphosate, P:Paraquat B-1 B-2 B-3 C-1 C-2 C-3 G-1 G-2 G-3 P-1 P-2 P-3 Net c hanges of bul k den si ty (g /c m
3)
-0.3 -0.2 -0.1 0.0 0.1 0.2 0.3
June 2006 - Nov. 2006 Nov. 2006 - May 2007 May 2007 - Nov. 2007
Nov. 2007 - May 2008
Net change bwt June 2006 - May 2008
Fig. 6. Net changes of bulk density measured before
and after the rainy season at the investigation plots from
June of 2006 to May of 2008. Above and below zero
means increase and decrease of bulk density.
제초제 처리 과수원 포장에서 강우 사상의 효과.
토양 물리성과 화학성의 변화 1.