Endoplasmic Reticulum Stress-Induced Activation of Activating Transcription Factor 6 Decreases cAMP-Stimulated Hepatic Gluconeogenesis via Inhibition of CREB
Hye-Young Seo, Mi-Kyung Kim, Ae-Kyung Min, Hye-Soon Kim, Seong-Yeol Ryu, Nam-Kyeong Kim, Kyeong Min Lee, Han-Jong Kim, Hueng-Sik Choi, Ki-Up Lee, Keun-Gyu Park, and In-Kyu Lee
Department of Internal Medicine (H.-Y.S., K.M.L., H.-J.K., I.-K.L.), Kyungpook National University School of Medicine, Daegu 700-721, South Korea; Department of Internal Medicine (M.-K.K., A.-K.M., H.-S.K., S.-Y.R., N.-K.K., K.-G.P.), Keimyung University School of Medicine, Daegu 700-712, South Korea; Hormone Research Center (H.-S.C.), School of Biological Sciences and Technology, Chonnam National University, Gwangju, 500-757 South Korea; and Department of Internal Medicine (K.-U.L.), University of Ulsan College of Medicine, Seoul, 138-736 South Korea
The expression of genes encoding key hepatic gluconeogenic enzymes, including phosphoenol- pyruvate carboxykinase (PEPCK) and glucose-6-phosphatase (G6Pase), is regulated at the tran- scriptional level by a network of transcription factors and cofactors, including cAMP response element-binding protein (CREB). It has been suggested that increased endoplasmic reticulum (ER) stress in the liver impairs hepatic glucose metabolism. However, the direct effect of ER stress on hepatic gluconeogenesis is still not clear. Here, we investigated whether ER stress influences he- patic gluconeogenesis and whether this process is mediated by activating transcription factor 6 (ATF6) through the inhibition of cAMP-mediated activation of CREB. A cAMP stimulant, forskolin, and 8-bromoadenosine-cAMP increased PEPCK and G6Pase mRNA expression in H4IIE rat hepa- toma cells, and ER stress induced by tunicamycin or thapsigargin decreased the expression of these genes in forskolin or 8-bromoadenosine-cAMP-treated cells. In a transient transfection study, ATF6 inhibited the PEPCK and G6Pase promoters. Also, adenovirus-mediated overexpression of ATF6 in H4IIE cells decreased forskolin-stimulated PEPCK and G6Pase gene expression. Moreover, the in- hibition of endogenous ATF6 expression by small interfering RNAs restored the ER stress-induced suppression of PEPCK and G6Pase gene expression. Transient transfection of ATF6 inhibited trans- activation by CREB on the PEPCK and G6Pase promoters, and a gel shift assay showed that Ad-ATF6 inhibits forskolin-stimulated CREB DNA-binding activity. Finally, we found that expression of ATF6 decreased fasting-induced PEPCK, G6Pase mRNA expression, and blood glucose levels in mice.
Taken together, these data extend our understanding of ER stress and the regulation of liver gluconeogenesis by ATF6. (Endocrinology 151: 561–568, 2010)
G lucose homeostasis is maintained by balancing glu- cose production in the liver with glucose use by pe- ripheral tissues (1, 2). Under fasting conditions, hepatic gluconeogenesis is strongly stimulated by transcriptional
activation of gluconeogenic genes by glucagon via the cAMP axis, but during feeding, this process is inhibited by insulin (3, 4). Hepatic gluconeogenesis is regulated mainly by the activities of key enzymes such as phosphoenolpyru-
ISSN Print 0013-7227 ISSN Online 1945-7170 Printed in U.S.A.
Copyright © 2010 by The Endocrine Society
doi: 10.1210/en.2009-0641 Received June 4, 2009. Accepted November 11, 2009.
First Published Online December 18, 2009
Abbreviations: ATF6, Activating transcription factor 6; 8-br-cAMP, 8-bromoadenosine- cAMP; CHOP, CCAAT/enhancer-binding protein homologous protein; CRE, cAMP response element; CREB, CRE binding protein; CRTC2, CREB regulated transcription co- activator 2; ER, endoplasmic reticulum; GFP, green fluorescent protein; G6Pase, glucose- 6-phosphatase; IRE, interferon response element; MOI, multiplicity of infection; PEPCK, phosphoenolpyruvate carboxykinase; PERK, pancreatic ER kinase; PGC-1␣, peroxisome proliferator-activated receptor␥-coactivator-1␣; siRNA, small interfering RNA; Tg, thap- sigargin; Tm, Tunicamycin; XBP, X-box binding protein.
Endocrinology, February 2010, 151(2):561–568 endo.endojournals.org 561
vate carboxykinase (PEPCK) and glucose-6-phosphatase (G6Pase) (5). The expression of the genes encoding these enzymes is strongly regulated at the transcriptional level by a network of transcription factors and cofactors, such as cAMP response element (CRE)-binding protein (CREB) (6), CREB regulated transcription coactivator 2 (CRTC2) (7), peroxisome proliferator-activated receptor ␥-coacti- vator-1 ␣ (PGC-1␣) (8), and small heterodimer partner (9).
cAMP signaling leads to CREB phosphorylation at Ser133 (10). Phospho-CREB, bound to the CRE, then recruits the coactivators CBP and p300, which activate gene transcrip- tion through their intrinsic histone acetyltransferase ac- tivity and through recruitment of other coactivator mol- ecules (11, 12).
Recently, numerous studies have shown the impor- tance of endoplasmic reticulum (ER) stress in the patho- genesis of various liver diseases, including chronic viral hepatitis, insulin resistance, nonalcoholic fatty liver dis- ease, ischemia-reperfusion injury, genetic disorders of protein misfolding, and alcoholic liver disease (13–15).
However, the direct effects of ER stress on hepatic glucose metabolism have not been well established. The ER stress response involves the function of three molecular compo- nents: pancreatic ER kinase (PERK), interferon response element (IRE)-1/X-box binding protein (XBP)-1, and ac- tivating transcription factor 6 (ATF6) (16). Among these, ATF6 is a member of the ATF/CREB family (17). The mammalian ATF/CREB family represents a large group of basic-region leucine zipper transcription factors with rather diverse physiological functions (17). However, de- spite their different activities, ATF/CREB family members share a common ability to respond to environmental sig- nals and maintain cellular homeostasis. For example, ATF2, ATF3, and ATF6 play roles in mediating stress responses: ATF2 and ATF3 have been implicated in tran- scriptional control of stress-response genes (18), whereas ATF6 is involved in regulating the expression of genes associated with ER stress and serum responses (19). Fur- thermore, CREB and ATF1 are involved in modulating transcription in response to intracellular cAMP concen- trations, and ATF4 acts as a negative regulator of CRE- dependent transcription (17). The consensus binding site for ATF is TGACGT(C/A)(G/A) (20), a sequence identical to the CRE consensus (TGACGTCA) (21). However, no study has suggested that ATF6 plays a role in regulating CRE-dependent genes. Moreover, the mechanism of tran- scriptional regulation of PEPCK and G6Pase by ATF6 has not been fully defined.
In this study, we examined whether ER stress influences hepatic gluconeogenesis and whether this process is me- diated by ATF6 inhibition of cAMP-mediated activation of CREB activity.
Materials and Methods
Chemicals
Tunicamycin (Tm; Sigma, St. Louis, MO), thapsigargin (Tg;
Sigma), 8-bromoadenosine-cAMP (8-br-cAMP; Sigma), and the cAMP stimulant forskolin (Sigma) were purchased and dissolved in the recommended solvents.
Cell culture
The H4IIE rat hepatoma cell line and HepG2 human hepa- toma cell line were cultured in 5% CO2/96% air at 37 C in MEM (Life Technologies, Inc.-BRL, Grand Island, NY) supplemented with 10% fetal bovine serum (Hyclone, Logan, UT) and antibi- otics. After reaching approximately 80% confluence, cells were serum-starved for 24 h in medium containing 0.5% fetal bovine serum and then treated as indicated in the text.
Generation of recombinant adenovirus
The cDNA encoding a constitutively active form of ATF6 (amino acids 1-373, 50-kDa, cytosolic N-terminal portion of ATF6) was inserted into the pAdTrack-CMV shuttle vector. The vector construct was then electroporated into BJ5138 cells, and a recombinant vector was generated using the AdEasy adenoviral vector system. The recombinant viruses were amplified in HEK- 293 cells and purified by CsCl (Sigma) gradient centrifugation.
Viral preparations were collected and desalted, and titers were determined using Adeno-X rapid titer (BD Bioscience, San Jose, CA), according to the manufacturer’s instructions. The effi- ciency of adenoviral infection was assessed using a recombinant adenovirus encoding ATF6 fused to green fluorescent protein (GFP) (data not shown).
Construction of a small interfering RNA (siRNA) for ATF6
The ATF6 siRNA was chemically synthesized by Bioneer (Seoul, Korea), deprotected, and annealed. Transfections were performed according to the manufacturer‘s instructions. Briefly, H4IIE cells were transfected with the ATF6 siRNA oligonucle- otide (100 nM) using the Lipofectamine 2000 transfection re- agent (Invitrogen, Carlsbad, CA). Cells were transfected for 4 h, serum-starved for 16 h, and treated with Tm (2g/ml) and for- skolin (30M) for an additional 12 h. Cells were harvested, and the total RNA was isolated for Northern blot analysis. The se- quences of the ATF6 and nonspecific control siRNAs were as follows: rat ATF6 siRNA, CCA UUG UGU UAC CAG CAA U tt (sense); nonspecific control siRNA, GGA GUA CGC AUA CCU GAA AGG tt (sense). The effects of ATF6 siRNA on the expression of ATF6 mRNA were measured by RT-PCR.
Northern blot analysis
H4IIE cells were treated with Tm, Tg, forskolin (30M), or 8-br-cAMP (500M) and subsequently infected with adenoviral vectors expressing ATF6. Cells were harvested at the indicated times, total RNA was isolated using Trizol reagent (Invitrogen), according to the manufacturer’s instructions, and 20g of total RNA from each sample was used. The probes for PEPCK, G6Pase, and ATF6 were labeled with [␣-32P]dCTP using a ran-
dom-primer DNA-labeling system (Amersham Biosciences, Little Chalfont, UK).
Western blot analysis
H4IIE cells were treated with Tm and Tg for various times and then harvested in lysis buffer [50 mmol/l Tris-HCl (pH 8.0), 150 mmol/l NaCl, 1 mmol/l EDTA, 1% Nonidet P-40, 0.25% Na- dexoycholate] containing proteinase inhibitors. The proteins were resolved by SDS-PAGE and then transferred electrophoreti- cally to a polyvinyl difluoride membrane (Millipore, Bedford, MA). The membrane was blocked by incubation in blocking buffer, incubated with anti-ATF6 antibody (Labprontier, Seoul, Korea), anti-ATF4 antibody (Santa Cruz Biotechnology, Santa Cruz, CA), and anti-CCAAT/enhancer-binding protein homol- ogous protein (CHOP) antibody (Santa Cruz), anti-FoxO1 an- tibody (Cell Signaling, Beverly, MA), and antiphosphorylated (p)-FoxO1 antibody (Cell Signaling), and was then developed using an ECL Western blot detection kit (Amersham Bio- sciences). The membrane was reblotted with antiactin antibody to verify equal loading of protein in each lane. Densitometry was used to quantitate the results, using the digitalized scientific soft- ware program UN-SCAN-IT (Skik Scientific Corp., Orem, UT).
Analysis of XBP-1 mRNA splicing
Total RNA was obtained from H4IIE cells using Trizol re- agent (Invitrogen). cDNA was synthesized using a first-strand cDNA synthesis kit (Fermentas, Hanover, MD) and 2g of total RNA, according to the manufacturer’s instructions. PCR was carried out under the following conditions using Taq polymerase (Takara, Tokyo, Japan): 92 C for 3 min for 40 cycles, 92 C for 45 sec, 52 C for 45 sec, and 72 C for 45 sec. The following primers were used: XBP-1, 5⬘-AAA CAG AGT AGC AGC GCA GAC TGC-3⬘ (forward) and 5⬘-GGA TCT CTA AAA CTA GAG GCT TGG TG-3⬘ (reverse); and-actin, 5⬘-GGC ATC GTC ACC AAC TGG GAC-3⬘ (forward), and 5⬘-CGA TTT CCC GCT CCG TGG-3⬘ (reverse). The purified PCR products were di- gested by PstI for 5 h at 37 C, then separated by 2% agarose gel electrophoresis.
In vitro transient transfection and gene reporter assays
HepG2 cells were plated at a density of 7⫻ 104cell/well in a 12-well plate and cultured for 1 d in culture medium. Cells were transiently transfected with the indicated promoter constructs (200 ng/well) and other cDNAs using Lipofectamine 2000 trans- fection reagent (Invitrogen). Cells were cotransfected with a plas- mid encoding-galactosidase as an internal control. Cells were transfected for 4 h, serum-starved for 16 h, and treated with forskolin (30M) for an additional 8 h. Cells were harvested and assayed for luciferase and-galactosidase activity. Twenty mi- croliters of cell lysate containing 15g of protein were analyzed using the luciferase assay system, according to the manufactur- er’s instructions (Promega, Madison, WI). Luciferase activity was measured using a SIRUS luminometer (Berthold, Pforzheim, Germany) and was normalized to-galactosidase activity. Re- porter plasmids encoding the human G6Pase promoter (⫺1227/
⫹57) and the rat PEPCK promoter (⫺2000/⫹73) were gener- ously provided by D. Schmoll (22) and R. W. Hanson (23), respectively.
EMSA
Nuclear extracts were prepared from HepG2 cells using the NucBuster protein extraction kit (Calbiochem, La Jolla, CA), according to the manufacturer’s instructions. Nuclear ex- tracts (6g) were incubated at room temperature with 60,000 cpm of a32P-labeled double-stranded oligonucleotide encoding the PEPCK CRE1 sequence (promoter positions⫺99 to ⫺76) 5⬘- CCGGCCCCTTACGTCAGAGGCG-3⬘ as a probe (24, 25).
Competition experiments were performed with 10⫻ unlabeled oligonucleotide sequences for PEPCK CRE1. Supershift exper- iments were performed by incubating the binding reaction with 0.4g of supershifting antibody (anti-CREB antibody; Santa Cruz). Samples were separated in 4% acrylamide, 0.5⫻ TBE [0.045MTris, 0.045Mboric acid, 1.0 mMEDTA (pH 8.0)] gels run at 150 V constant voltage (26).
Animals
In vivo experiments were conducted using 8- to 9-wk-old male C57BL/6 mice (Samtako, Korea). All animal procedures were carried out in accordance with institutional guidelines for animal research. ER stress was induced in C57Bl/6 mouse livers by Tm (0.1 mg) injection into the tail vein. Mice were fasted for 16 h and killed for liver collection. Exogenous overexpression of ATF6 or GFP was induced in the livers of C57Bl/6 mice via injection of 1⫻ 109pfu/200l of adenovirus into the tail vein.
After 3 d, mice were fasted for 16 h and killed for blood and liver collection. Nine mice per group were used in this experiment.
Blood glucose levels were measured using glucose reagent strips and a glucometer (Abbott, Bedford, MA).
Statistical analysis
Data are the means⫾SE. ANOVA was used to determine significant differences in multiple comparisons and was per- formed using the Duncan test. P⬍ 0.05 was considered statis- tically significant. All experiments were performed at least three times.
Results
Chemical-induced ER stress decreases PEPCK and G6Pase gene expression
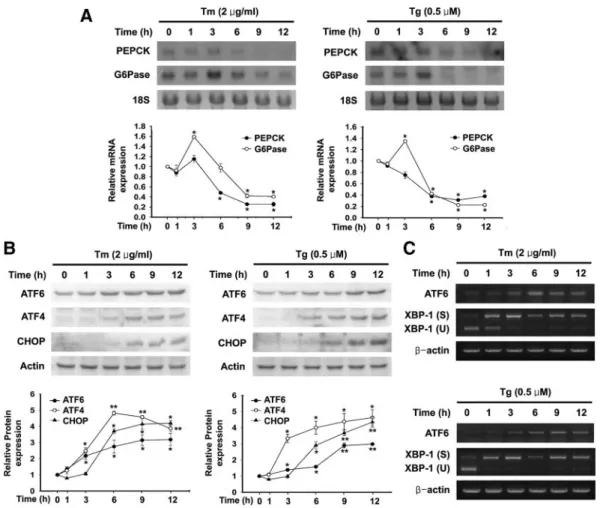
To determine whether experimental induction of ER stress regulates gluconeogenic gene expression, we used Northern blot analysis to examine the effects of Tm and Tg on PEPCK and G6Pase mRNA expression. Tm and Tg each decreased PEPCK mRNA expression with 6 –12 h of exposure (Fig. 1A). The level of G6Pase increased slightly after 3 h of exposure to Tm and Tg, but it then decreased upon longer exposure (6 –12 h) (Fig. 1A). The induction of ER stress was confirmed by determining the expression of various genes implicated in the unfolded protein response:
The activated form of ATF6 (50-kDa, cytosolic N-termi-
nal portion of ATF6), ATF4, and CHOP were expressed
at low levels under basal conditions, and exposure to Tm
and Tg increased their expression in a time-dependent
manner (Fig. 1B). Splicing of XBP-1 was induced after 1 h
of Tm and Tg exposure (Fig. 1C).
To determine whether ER stress-induced inhibition of hepatic gluconeogenesis involves a cAMP signaling pathway, we examined the effects of ER stress on the expression of PEPCK and G6Pase in 8-br-AMP- and forskolin-stimulated cells, because forskolin is a known activator of cAMP function. As shown in Fig. 2, H4IIE cells treated with forskolin or 8-br-cAMP for 12 h re- sulted in an increase in PEPCK and G6Pase mRNA ex- pression, but cotreatment with Tm or Tg repressed the forskolin or 8-br-cAMP-stimulated PEPCK and G6Pase gene expression in a dose-dependent manner.
ER stress-induced inhibition of PEPCK and G6Pase expression is mediated by ATF6
We next examined which of the three different signal- ing arms of the ER stress response (PERK, IRE1, or ATF6) mediates the inhibition of gluconeogenic gene expression.
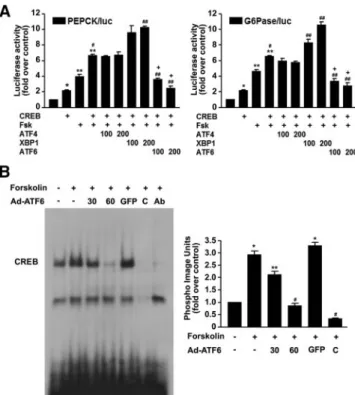
As shown in Fig. 3A, transient expression of the active form of ATF6 in HepG2 cells significantly inhibited for- skolin-stimulated PEPCK and G6Pase promoter activity.
In contrast, although the expression of ATF4, a key com- ponent of the PERK pathway, tended to decrease forsko- lin-stimulated G6Pase promoter activity, the effect of ATF4 was much less than that of ATF6. Moreover, ATF4 had no effect on forskolin-stimulated PEPCK promoter activity. Quite unexpectedly, the expression of the spliced form of XBP-1, which functions downstream of IRE1, further increased the forskolin-stimulated PEPCK and G6Pase promoter activity. The transfection efficiency was determined by Western blot analysis (supplemental Fig. S1, published as supplemental data on The Endocrine Society’s Journals Online web site at http://mend.endojournals.org).
Based on the results of the transient transfection assay, we were interested in determining the physiological role of ATF6 in gluconeogenic gene expression in H4IIE cells. To determine the effect of ATF6 on the expression of the PEPCK and G6Pase genes, H4IIE cells were infected with an adenovirus encoding a constitutively active form of ATF6 (Ad-ATF6) at a multiplicity of infection (MOI) of 30
FIG. 1. ER stress inhibits PEPCK and G6Pase gene expression. A, Representative Northern blot analysis of PEPCK and G6Pase mRNA expression in H4IIE cells treated with 2g/ml Tm and 0.5 MTg for the time periods shown. 18S rRNA levels were analyzed as an internal control. Data in the line graph are the means⫾SEof three independent measurements. *, P⬍ 0.01, compared with 0 h. B, Representative Western blot analysis of ATF6 (50 kDa, active form of ATF6), ATF4, and CHOP in the presence of Tm and Tg for the time periods shown.
Data in the line graph are the means⫾SEof three independent measurements. *, P⬍ 0.05; **, P ⬍ 0.01 compared with 0 h. C,
Representative RT-PCR analysis of ATF6 and XBP-1 splicing in the presence of Tm and Tg for various time periods, with mRNA levels assessed at each time point. S, spliced form; U, unspliced form.-Actin mRNA levels were analyzed as an internal control.
or 60 after 12 h of pretreatment with forskolin. Con- sistent with the effect of ATF6 on PEPCK and G6Pase promoter activity, Ad-ATF6 significantly repressed for- skolin-stimulated PEPCK and G6Pase gene expression in a dose-dependent manner (Fig. 3B). To further con- firm whether suppression of PEPCK and G6Pase gene expression was mediated by ATF6, we down-regulated endogenous ATF6 expression by transfecting H4IIE cells with siRNA-ATF6 and incubated the cells in Tm- containing media. The siRNA-ATF6 significantly in- hibited Tm-induced ATF6 expression (Fig. 3C) and restored the Tm-induced suppression of PEPCK and G6Pase gene expression (Fig. 3D).
ATF6 decreases CREB DNA-binding activity
Because the transcriptional activity of gluconeogenic gene expression is primarily regulated by the transcrip- tion factor CREB (27), we examined whether ATF6 in- hibits the transactivation activity of CREB on the PEPCK and G6Pase promoters. Transient expression of CREB slightly increased PEPCK and G6Pase promoter activity, and in the presence of forskolin, CREB mark- edly increased PEPCK and G6Pase promoter activity (Fig. 4A). ATF6 repressed the CREB-stimulated PEPCK
FIG. 2. ER stress inhibits forskolin- or 8-br-cAMP-stimulated PEPCK and G6Pase gene expression. A, Representative Northern blot analysis showing the effect of ER stress on forskolin-stimulated PEPCK and G6Pase mRNA expression. H4IIE cells were incubated with forskolin (30M) for 12 h and with Tm and Tg at various doses for 12 h. 18S rRNA levels were analyzed as an internal control.
Data in the bar graph are the means⫾SEof three independent measurements. *, P⬍ 0.001 compared with control; **, P ⬍ 0.01;
#, P⬍ 0.001 compared with forskolin alone. B, Representative Northern blot analysis showing the effect of ER stress on 8-br- cAMP-stimulated PEPCK and G6Pase mRNA expression. H4IIE cells were incubated with 8-br-cAMP (500M), Tm (various doses), and Tg (various doses) for 12 h. The 18S rRNA levels were analyzed as an internal control. Data in the bar graph are the means⫾SEof three independent measurements. *, P⬍ 0.01 compared with control; **, P⬍ 0.05; #, P ⬍ 0.01 compared with 8-br-cAMP alone.
FIG. 3. ATF6 inhibits forskolin-stimulated PEPCK and G6Pase expression. Panel A, Effect of ATF4, the spliced form of XBP-1 and the active from of ATF6 on forskolin-stimulated PEPCK and G6Pase promoter activity. HepG2 cells were cotransfected with the PEPCK and G6Pase promoters (200 ng/well) and the indicated amounts of an expression vector for ATF4, XBP-1, or ATF6. Cells were then serum-starved for 16 h and treated with forskolin (Fsk) (30M) for an additional 8 h. Luciferase (luc) activity was normalized to
-galactosidase activity as an internal control. Data represent the means⫾SEof three independent measurements. *, P⬍ 0.01 compared with control; **, P⬍ 0.05; #, P ⬍ 0.01 compared with forskolin alone; ##, P⬍ 0.05 compared with forskolin/ATF4.
Panel B, Representative Northern blot analysis showing the effect of overexpression of ATF6 on forskolin-stimulated PEPCK and G6Pase mRNA expression. H4IIE cells were infected with the indicated doses (MOI) of Ad-ATF6 or Ad-GFP for 24 h and treated with forskolin (30M). 18S rRNA levels were analyzed as an internal control. Data in the bar graph are the means⫾SEof three independent measurements. *, P⬍ 0.01 compared with control; #, P⬍ 0.01 compared with forskolin alone. Panel C, H4IIE cells were transfected with 100 nMsiRNA-ATF6 or control siRNA (Con) and then treated with forskolin and Tm. RNA levels were normalized using
-actin. Panel D, Representative Northern blot analysis of the effect of siRNA-ATF6 on the Tm-decreased forskolin-stimulated PEPCK and G6Pase gene expression. 18S rRNA levels were analyzed as an internal control.
and G6Pase promoter activity (Fig. 4A). In contrast, expression of ATF4 tended to decrease the CREB-stim- ulated G6Pase promoter activity, but had no effect on CREB-stimulated PEPCK promoter activity (Fig. 4A).
The expression of the spliced form of XBP-1 addition- ally increased the CREB-stimulated PEPCK and G6Pase promoter activity (Fig. 4A). These findings prompted us to investigate whether ATF6 inhibited the ability of CREB to bind to the CRE region. To test whether ATF6 reduces CREB’s DNA-binding activity, gel shift analyses were conducted with the CRE oligonucleotide. CREB’s DNA-binding activity was stimulated by forskolin, and cells infected with Ad-ATF6 decreased this forskolin-stim- ulated CREB DNA-binding activity in a dose-dependent manner (Fig. 4B). These results suggest that ATF6-induced
inhibition of gluconeogenic gene expression is mediated by suppression of CREB activity on the PEPCK and G6Pase promoters.
Overexpression of ATF6 decreases blood glucose levels and expression of the PEPCK and G6Pase genes in the livers of C57BL/6 mice
We next wanted to determine whether ER stress induction and ATF6 influence blood glucose levels and hepatic glu- coneogenic gene expression in a CREB-stimulated condition in vivo. Hepatic glucose production under fasting conditions (see Materials and Methods) was analyzed in the livers of C57BL/6 mice treated with Tm or infected with ATF-encod- ing adenoviruses by tail vein injection. Treatment with Tm induced ATF6 expression in vivo (Fig. 5A). Tm treatment and adenovirus-mediated ATF6 overexpression decreased fasting-induced hepatic PEPCK and G6Pase gene expression (Fig. 5, B and C). Moreover, blood glucose levels in mice from the fasting condition were significantly decreased after overexpression of ATF6 compared with those in the livers of Ad-GFP-infected mice (Fig. 5D). Additionally, we checked whether ATF6 influenced PGC-1 ␣ expression and FoxO1 phosphorylation, which regulate gluconeogenic gene expres- sion. PGC-1 ␣ expression and FoxO1 phosphorylation were not changed by ATF6, suggesting that the ATF6-mediated inhibition of gluconeogenic gene expression is not related to PGC-1 and FoxO1 (supplemental Fig. S2).
FIG. 5. ATF6 overexpression reduced fasting blood glucose levels, PEPCK, and G6Pase gene expression in C57BL/6 mice. A, Representative Western blot analysis of ATF6 (50 kDa, active form) expression in C57BL/6 mouse livers after tail vein injection with Tm (0.1 mg). Protein was extracted from liver tissues following a 16-h fast, and was analyzed by Western blot analysis. B, Representative Northern blot analysis of PEPCK and G6Pase mRNA expression in C57BL/6 mouse livers after tail vein injection with Tm (0.1 mg). Total RNA was extracted from liver tissues after a 16-h fast and was analyzed by Northern blot analysis. C, Representative Northern blot analysis of PEPCK and G6Pase mRNA expression in the livers of C57BL/6 mice after tail vein injection with Ad-ATF6 or Ad-GFP for 3 d. Total RNA was extracted from liver tissues in the 16-h fasting condition and was analyzed via Northern blot analysis. D, Fasting blood glucose levels of C57BL/6 mice were measured after tail vein injection with Ad- GFP or Ad-ATF6. Data represent the means⫾SEof three independent measurements (n⫽ 9 in each group). *, P ⬍ 0.05 compared with Ad-GFP.
FIG. 4. ATF6 inhibits CREB DNA-binding activity. A, HepG2 cells were cotransfected with 200 ng each of the PEPCK and G6Pase reporter genes, CREB, and indicated amounts of an expression vector for ATF4, XBP-1, and ATF6. Cells were then serum-starved for 16 h and treated with forskolin (Fsk; 30M) for an additional 8 h. Luciferase (luc) activity was normalized to-galactosidase activity as an internal control. Data represent the means⫾SEof three independent measurements. *, P⬍ 0.05; **, P ⬍ 0.01 compared with control; #, P⬍ 0.01 compared with CREB or forskolin alone; ##, P⬍ 0.01 compared with CREB/forskolin; ⫹, P⬍ 0.01 compared with CREB/forskolin/ATF4. B, The effect of ATF6 on forskolin-stimulated CREB DNA-binding activity. HepG2 cells were infected with the indicated doses (MOI) of Ad-ATF6 or Ad-GFP for 24 h and treated with forskolin (30M) for 3 h. Competition experiments (C) were performed with 10⫻ unlabeled
oligonucleotide sequences for CRE. Supershift experiments (Ab) were performed by incubating the binding reaction with anti-CREB antibody. Data represent the means⫾SEof three independent measurements. *, P⬍ 0.01 compared with control; **, P ⬍ 0.05;
#, P⬍ 0.01 compared with forskolin alone.
Discussion
We have shown that chemical-induced ER stress decreases PEPCK and G6Pase gene expression and that adenovirus- mediated overexpression of ATF6 decreases hepatic glu- coneogenic gene expression and blood glucose levels both in vivo and in vitro. Transient transfection and gel shift assays suggest that ATF6 inhibits PEPCK and G6Pase gene expression via repression of CREB activity.
The ER stress response results in obesity, the deterio- ration of insulin action, and the development of type 2 diabetes (28). It has been suggested that increased ER stress in the liver induces hepatic insulin resistance and impairs hepatic glucose metabolism (29, 30). However, the direct effect of ER stress on hepatic gluconeogensis is still not clear. A recent study showed that experimental induction of ER stress by treatment with Tm or Tg for 2 or 4 h increases G6Pase expression via increased tran- scription (31). More recently, Gonzales et al. (32) dem- onstrated that short-term, chemically induced ER stress in the liver increases glucose production via mechanisms that involve increased glycogenolysis and liver phosphorylase activity. Consistent with a previous study by Wang et al.
(31), we showed that short-term induction of ER stress increased G6Pase mRNA expression. However, long-term exposure (6 –12 h) to Tm and to Tg decreased the expres- sion of G6Pase mRNA. In addition, PEPCK mRNA ex- pression gradually decreased after exposure to Tm and Tg without an initial increase, as was seen for G6Pase mRNA expression. Furthermore, we showed that treatment of Tm and Tg repressed forskolin- or 8-br-cAMP-stimulated PEPCK and G6Pase promoter activity and mRNA expres- sion. Collectively, these results raise the possibility that, although the early phase of ER stress increases hepatic gluconeogenesis, consequent unfolded protein response suppresses hepatic gluconeogenesis in response to long- term induction of ER stress.
The ER stress response involves the functioning of three molecular components: PERK, IRE-1/XBP-1, and ATF-6.
Among these, we found that ER stress-induced suppres- sion of PEPCK and G6Pase promoter activity was medi- ated by the activation of ATF6 and that the other ER stress response pathways, such as those involving IRE1-XBP1 and PERK-eIF2 ␣-ATF4, were less likely to be involved.
Adenovirus-mediated ATF6 overexpression in H4IIE cells significantly repressed forskolin-stimulated PEPCK and G6Pase gene expression, and the inhibition of endogenous AFT6 expression by siRNA restored the ER stress-induced suppression of PEPCK and G6Pase gene expression.
Moreover, fasting-induced PEPCK and G6Pase gene ex- pression and blood glucose levels were decreased in C57BL/6 mice infected with adenoviruses encoding ATF6.
These results suggest that ER stress-induced activation of ATF6 decreases PEPCK and G6Pase gene expression.
Hepatic gluconeogenesis is strongly stimulated during fasting by augmenting glucagon-dependent activation of CREB-mediated gene induction (27). The binding of CREB to the CRE, TGACGTCA, which is present in the regulatory sequences of many eukaryotic genes, results in stimulation or repression of the target genes (33, 34). This consensus binding site for CRE is identical to the ATF consensus (TGACGT[C/A][G/A]) (20), suggesting that ATF6 may influence CRE binding activity on the PEPCK and G6Pase promoters. Thus, we investigated whether ATF6 represses CREB-mediated transcription. Transient transfection and gel shift assays showed that ATF6 re- pressed CREB-stimulated PEPCK and G6Pase promoter activities and the CREB DNA-binding activity without the binding of ATF6 to the CRE. Additional studies are needed to elucidate the mechanism by which ATF6 inhib- its the binding of CREB to the CRE. While we were pre- paring this manuscript, Wang et al. (35) reported that ER stress induced the dephosphorylation and nuclear entry of the CREB coactivator CRTC2, which in turn promoted the expression of ER quality control genes through an association with ATF6. Furthermore, ATF6 also reduced PEPCK and G6Pase gene expression by disrupting the CREB-CRTC2 interaction. Thus, it is possible that the inhibition of CREB coactivators such as CRTC2 may in- fluence the CREB DNA-binding activity, although the mechanism of repression of CREB DNA-binding by ATF6 is currently not clear. Collectively, these results suggest that ATF6-induced inhibition of gluconeogenic gene ex- pression is mediated by the suppression of CREB activity on the PEPCK and G6Pase promoters.
In conclusion, ER stress-induced activation of ATF6 decreases PEPCK and G6Pase gene expression as well as blood glucose levels. These data extend our understanding of ER stress and ATF6 regulation of liver gluconeogenesis.
Acknowledgments
Address all correspondence and requests for reprints to: Keun- Gyu Park, M.D., Ph.D., Department of Internal Medicine, Ke- imyung University School of Medicine, 194 Dongsan-dong, Jung-gu, Daegu, 700-712, South Korea. E-mail: kgpark@dsmc.
or.kr; or In-Kyu Lee, M.D., Ph.D., Department of Internal Med- icine, Kyungpook National University School of Medicine, 50 Samduk-2ga, Jung-gu, Daegu, 700-721, South Korea. E-mail:
This work was supported by Grants A08-4335-AA2004- 08N1-00020B from the Korea Healthcare Technology R&D Project, Ministry for Health, Welfare, and Family Affairs, Republic of Korea.
Disclosure Summary: The authors have nothing to disclose.
References
1. Nordlie RC, Foster JD, Lange AJ 1999 Regulation of glucose pro- duction by the liver. Annu Rev Nutr 19:379 – 406
2. Eckel RH, Grundy SM, Zimmet PZ 2005 The metabolic syndrome.
Lancet 365:1415–1428
3. Jiang G, Zhang BB 2003 Glucagon and regulation of glucose me- tabolism. Am J Physiol Endocrinol Metab 284:671– 678
4. Hall RK, Granner DK 1999 Insulin regulates expression of meta- bolic genes through divergent signaling pathways. J Basic Clin Physiol Pharmacol 10:119 –133
5. Postic C, Dentin R, Girard J 2004 Role of the liver in the control of carbohydrate and lipid homeostasis. Diabetes Metab 30:398 – 408 6. Thiel G, Al Sarraj J, Stefano L 2005 cAMP response element binding protein (CREB) activates transcription via two distinct genetic ele- ments of the human glucose-6-phosphatase gene. BMC Mol Biol 6:2 7. Koo SH, Flechner L, Qi L, Zhang X, Screaton RA, Jeffries S, Hedrick S, Xu W, Boussouar F, Brindle P, Takemori H, Montminy M 2005 The CREB coactivator TORC2 is a key regulator of fasting glucose metabolism. Nature 437:1109 –1111
8. Herzig S, Long F, Jhala US, Hedrick S, Quinn R, Bauer A, Rudolph D, Schutz G, Yoon C, Puigserver P, Spiegelman B, Montminy M 2001 CREB regulates hepatic gluconeogenesis through the coacti- vator PGC-1. Nature 413:179 –183
9. Park MJ, Kong HJ, Kim HY, Kim HH, Kim JH, Cheong JH 2007 Transcriptional repression of the gluconeogenic gene PEPCK by the orphan nuclear receptor SHP through inhibitory interaction with C/EBP␣. Biochem J 15:567–574
10. Alberts AS, Arias J, Hagiwara M, Montminy MR, Feramisco JR 1994 Recombinant cyclic AMP response element binding protein (CREB) phosphorylated on Ser-133 is transcriptionally active upon its introduction into fibroblast nuclei. J Biol Chem 269:7623–7630 11. Das C, Lucia MS, Hansen KC, Tyler JK 2009 CBP/p300-mediated
acetylation of histone H3 on lysine 56. Nature 459:113–117 12. Liu Y, Dentin R, Chen D, Hedrick S, Ravnskjaer K, Schenk S, Milne
J, Meyers DJ, Cole P, Yates 3rd J, Olefsky J, Guarente L, Montminy M 2008 A fasting inducible switch modulates gluconeogenesis via activator/coactivator exchange. Nature 456:269 –273
13. Kaplowitz N, Than TA, Shinohara M, Ji C 2007 Endoplasmic re- ticulum stress and liver injury. Semin Liver Dis 27:367–377 14. Ji C, Kaplowitz N 2006 ER stress: can the liver cope? J Hepatol
45:321–333
15. Ji C 2008 Dissection of endoplasmic reticulum stress signaling in alcoholic and non-alcoholic liver injury. J Gastroenterol Hepatol 23:16 –24
16. Shen X, Zhang K, Kaufman RJ 2004 The unfolded protein response–
a stress signaling pathway of the endoplasmic reticulum. J Chem Neuroanat 28:79 –92
17. Persengiev SP, Green MR 2003 The role of ATF/CREB family mem- bers in cell growth, survival and apoptosis. Apoptosis 8:225–228 18. Green TA, Alibhai IN, Unterberg S, Neve RL, Ghose S, Tamminga
CA, Nestler EJ 2008 Induction of activating transcription factors (ATFs) ATF2, ATF3, and ATF4 in the nucleus accumbens and their regulation of emotional behavior. J Neurosci 28:2025–2032 19. Zhu C, Johansen FE, Prywes R 1997 Interaction of ATF6 and serum
response factor. Mol Cell Biol 17:4957– 4966
20. Lin YS, Green MR 1988 Interaction of a common transcription
factor, ATF, with regulatory elements in both E1a- and cyclic AMP- inducible promoters. Proc Natl Acad Sci USA 85:3396 –3400 21. Deutsch PJ, Hoeffler JP, Jameson JL, Lin JC, Habener, JF 1988
Structural determinants for transcriptional activation by cAMP- responsive DNA elements. J Biol Chem 263:18466 –18472 22. Schmoll D, Walker KS, Alessi DR, Grempler R, Burchell A, Guo S,
Walther R, Unterman TG 2000 Regulation of glucose-6-phospha- tase gene expression by protein kinase B␣ and the forkhead tran- scription factor FKHR: evidence for insulin response unit-dependent and -independent effects of insulin on promoter activity. J Biol Chem 275:36324 –36333
23. Lechner PS, Croniger CM, Hakimi P, Millward C, Fekter C, Yun JS, Hanson RW 2001 The use of transgenic mice to analyze the role of accessory factor two in the regulation of phosphoenolpyruvate car- boxykinase (GTP) gene transcription during diabetes. J Biol Chem 276:22675–22679
24. Park MJ, Kong HJ, Kim HY, Kim HH, Kim JH, Cheong JH 2007 Transcriptional repression of the gluconeogenic gene PEPCK by the orphan nuclear receptor SHP through inhibitory interaction with C/EBP␣. Biochem J 402:567–574
25. Croniger C, Leahy P, Reshef L, Hanson RW 1998 C/EBP and the control of phosphoenolpyruvate carboxykinase gene transcription in the liver. J Biol Chem 273:31629 –31632
26. Seol W, Hanstein B, Brown M, Moore DD 1998 Inhibition of es- trogen receptor action by the orphan receptor SHP (short het- erodimer partner). Mol Endocrinol 12:1551–1557
27. Sheriff S, Chance WT, Fischer JE, Balasubramaniam A 1997 Neu- ropeptide Y treatment and food deprivation increase cyclic AMP response element-binding in rat hypothalamus. Mol Pharmacol 51:
597– 604
28. Ozcan U, Cao Q, Yilmaz E, Lee AH, Iwakoshi NN, Ozdelen E, Tuncman G, Go¨rgu¨n C, Glimcher LH, Hotamisligil GS 2004 En- doplasmic reticulum stress links obesity, insulin action and type 2 diabetes. Science 306:457– 461
29. Harding HP, Zeng H, Zhang Y, Jungries R, Chung P, Plesken H, Sabatini DD, Ron D 2001 Diabetes mellitus and exocrine pancreatic dysfunction in Perk⫺/⫺ mice reveals a role for translational control in secretory cell survival. Mol Cell 7:1153–1163
30. Shi Y, Taylor SI, Tan SL, Sonenberg N 2003 When translation meets metabolism: multiple links to diabetes. Endocr Rev 24:91–101 31. Wang D, Wei Y, Schmoll D, Maclean KN, Pagliassotti MJ 2006
Endoplasmic reticulum stress increases glucose-6-phosphatase and glucose cycling in liver cells. Endocrinology 147:350 –358 32. Gonzales JC, Gentile CL, Pfaffenbach KT, Wei Y, Wang D, Pagliassotti
MJ 2008 Chemical induction of the unfolded protein response in the liver increases glucose production and is activated during insulin-in- duced hypoglycaemia in rats. Diabetologia 51:1920–1929
33. Sheng M, McFadden G, Greenberg ME 1990 Membrane depolar- ization and calcium induce c-fos transcription via phosphorylation of transcription factor CREB. Neuron 4:571–582
34. Foulkes NS, Laoide BM, Schlotter F, Sassone-Corsi P 1991 Transcrip- tional antagonist cAMP-responsive element modulator (CREM) down regulates c-fos cAMP induced expression. Proc Natl Acad Sci USA 88:5448–5452
35. Wang Y, Vera L, Fischer WH, Montminy M 2009 The CREB co- activator CRTC2 links hepatic ER stress and fasting glucogenesis.
Nature 23:534 –537