383
Copyright © 2014 The Korean Society of Fisheries and Aquatic Science pISSN:0374-8111, eISSN:2287-8815
서 론
배합사료가격은사료원료비용의
50-70%
를차지하기때문에경제적이고효율적인사료를생산하기위해서는사료원료 의 가격에대비한 품질평가가 필수적이다
(Jafri and Hassan,
1999).
사료원료의품질평가방법중에서그원료의영양소소화율을측정하는것이가장기본적인방법중의하나이다
.
일반 적으로사료원료들의영양소소화율평가는기초사료와평가 하고자하는사료원료를7:3
비율로혼합하여제조한사료를실 험어에게공급하여이루어지는데,
이것은평가하고자하는사 료원료가다른사료원료에의해받는영향을최소화시키기위 함이다(Yoo et al., 2006).
또한,
원료의소화율측정은경제적인 실용사료설계,
영양연구의기초자료및원료의영양학적가치를결정하는데매우필수적인자료가된다
.
일반적으로어류는탄수화물에대한이용성이낮아다른육상 동물에비해사료내단백질이차지하는비율이높고
,
어류의성 장에있어서양어사료원료비용중단백질원의비용이약60%
이상을차지하기때문에양어사료에서양질의단백질원료의 선택은매우중요하다
.
양어사료에서어분은영양소함량이높 고,
어류의기호성이좋아가장많이사용되고있는사료원료이 다.
하지만,
최근에어획량의감소에따른수급불균형및가격 상승등으로안정적인단백질원의공급이위협받고있는실정 이다.
따라서양어사료영양학자들은어분대체품으로식물성 단백질원및동물성부산물단백질원을이용하여값비싼어분 대신값싸고공급이안정적인사료원을부분적또는완전히대 체하기위한노력을계속하고있다.
단백질원료를연구하는데단백질원료의 종류에 따른 황복(Takifugu obscurus) 치어의 소화율 및 성장 평가
유광열·배승철
1*
충청남도수산연구소, 1부경대학교 해양바이오신소재학과/사료영양연구소
Effects of Different Dietary Protein Sources on Apparent Digestibility and Growth in Juvenile River Puffer Takifugu obscurus
Gwangyeol Yoo and Sungchul C. Bai
1
*The Province of Chungcheongnam-do Fisheries Research Institute, Boryeng 355-851, Korea
1
Department of Marine Bio Materials & Aquaculture/Feeds and Foods Nutrition Research Center, Pukyong National University, Busan 608-737, Korea
An 8-week feeding trial was conducted to determine the apparent dry matter and protein digestibility of seven differ- ent dietary protein sources by juvenile river puffer Takifugu obscurus . Eight diets containing white fish meal (WFM), brown fish meal (BFM), squid liver powder (SLP), krill meal (KM), leather meal (LM), soybean meal (SM), or fermented soybean meal (FSM) were prepared by mixing a basal diet (BD) with one of the seven test ingredients at a ratio of 7 to 3. Fish averaging 10.8 ± 0.04 g were fed the experimental diets in triplicate groups. The apparent dry matter digestibilities of BFM, WFM, FSM, SLP, LM, SM, and KM were 80, 78, 72, 67, 56, 55, and 54%, respectively, while the corresponding apparent protein digestibilities were 96, 96, 93, 92, 89, 88, and 86. The weight gain of fish fed BFM was significantly greater than that of fish fed SM or LM ( P <0.05), while it was not significantly different from that of fish fed the BD, WFM, FSM, BFM, SLP, or KM. These results indicated that WFM, BFM, FSM, and SLP are potentially good protein sources for replacing fish meal in river puffer feed.
Key words: Digestibility, Protein sources, River puffer, Growth
This is an Open Access article distributed under the terms of the Creative Commons Attribution Non-Commercial Licens (http://creativecommons.org/licenses/by-nc/3.0/)which permits unrestricted non-commercial use, distribution, and reproduction in any medium, provided the original work is properly cited.
http://dx.doi.org/10.5657/KFAS.2014.0383 Kor J Fish Aquat Sci 47(4) 383-389, August 2014
Received 8 July 2014; Revised 28 July 2014; Accepted 5 August 2014
*Corresponding author: Tel: +82. 51 .629 .5916 Fax: +82. 51 .629 .7063
E-mail address: [email protected]
소화율실험은거의필수적으로
,
여러가지단백질원료에대한 영양소및에너지소화율은연어(Hajen et al., 1993),
넙치(Lee et al., 2008),
돌돔(Ko et al., 2008),
조피볼락(Lee, 2002)
및이 스라엘잉어(Kim et al., 1997)
등다양한양식어류에서보고된 바있으나,
황복을대상으로수행한연구는보고되지않았다.
그러므로본실험은치어기황복을대상으로동
·
식물성단백 질사료원료들의이용성을평가하여경제성있는황복의배합 사료개발을위한기초자료를제공하고자실시하였다.
재료 및 방법
실험어 사육관리
사육실험에앞서황복
(Takifugu obscurus)
치어를유사한크기로선별하여
3,000 L
수조에입식한후실험환경에적응할수있도록기초사료를
2
주간 동일하게공급하면서 예비사육 을하였다.
예비사육후,
평균무게10.8±0.04 g
인황복치어 를40 L
사각수조에각각20
마리씩수용하여각실험구당3
반 복으로실험어를무작위배치하였으며,
사육수는모래여과기 에의해여과된해수를사용하였다.
각실험수조는유수식으로유수량은
1 L/min
로조절하였으며,
각수조에충분한산소공급을위하여에어스톤을설치하였다
.
실험기간동안평균수온은
23.3±2.24℃
였으며,
전실험기간동안에자연수온에의존하였다
.
사육수의염분은27.5±1.85 psu
였고,
용존산소(DO)
는5.1-5.9 mg/L
의범위였다.
일일사료공급량은어체중의4%
(DM)
로1
일2
회(09:00, 16:00)
공급하였으며,
주사육실험기간 은8
주간실시하였다.
실험사료 설계
실험에서사용한기초사료
(basal diet, BD)
의성분은Table 1
에나타내었다.
기초사료는단백질원으로갈색어분과황복근 육분을,
탄수화물원으로는밀가루를사용하였고,
어유를지질 원으로사용하였다.
황복근육분은중량400 g
내외의황복으로 부터근육을뼈와분리한후동결건조하여분말로만들어사용 하였다.
단백질원료들의소화율평가를위한실험사료는기초 사료70%
와7
가지의동·
식물성단백질원을30%
비로혼합하 여제조하였다.
본실험에사용된7
가지단백질원은백색어분(white fish meal, WFM),
갈색어분(brown fish meal, BFM),
오 징어간분(squid liver powder, SLP),
크릴분말(krill meal, KM),
수지박(leather meal, LM),
대두박(soybean meal, SM)
및발효 대두박(fermented soybean meal, FSM)
이며,
실험사료의각원 료및기초사료를포함한8
가지실험사료의성분조성은Table 2
및3
에나타내었다.
모든사료는실험사료원들의소화율평가 를위하여소화율지시제로이용되고있는Cr
2O
3를0.5%
첨가 하여원료를혼합후펠렛제조기로압출·
성형하였다.
실험사료 의입자크기는sieve
로고르게친후,
밀봉하여–20℃
에냉동보 관하면서사용하였다.
어체측정
어체측정은
2
주 간격으로 실시하였으며,
성장률을 측정하 기위하여24
시간절식시킨후MS-222 (100 ppm)
로마취시켜 전체무게를 측정하였다.
실험종료 후,
증체율(percent weight gain, %),
일간성장률(specific growth rate, %/day),
단백질전 환효율(protein efficiency ratio),
사료효율(feed efficiency, %),
비만도(condition factor),
간중량지수(hepatosomatic index),
내장중량지수(visceralsomatic index)
및생존율(survival rate,
%)
을조사하였다.
간중량지수및내장중량지수측정을위해각 수조별로5
마리씩실험어를포획하여간및내장의무게를측 정하였다.
성분분석
실험사료와각수조별로
5
마리씩무작위로추출한실험어를 분쇄한전어체의일반성분은AOAC (Association of Official Analytical Chemists, 2000)
방법에따라수분은상압가열건조 법(135℃, 2
시간),
조단백질은kjeldahl
질소정량법(N×6.25),
조회분은직접회화법으로분석하였다.
조지방은샘플을12
시 Table 1. Composition of the basal dietIngredients %
Brown fish meal1 65
Yellow puffer muscle powder2 6
Wheat flour3 18
Fish oil4 4.5
Vitamin premix5 3
Mineral premix6 3
Cr2O3 0.5
Proximate composition (%, DM)
Moisture 10.0
Crude protein 51.7
Crude lipid 12.0
Crude ash 20.9
1Rom Co., LTD. Goseong, Korea.
2Prepared by lyophilized muscle from adult fish.
3Young Nam Flourmills Co., Busan, Korea.
4Ewha Oil Company, Busan, Korea.
5Contains (as mg/kg in diets) : Ascorbic acid, 300; dl-Calcium pantothenate, 150; Choline bitatrate, 3000; Inositol, 150; Menadi- one, 6; Niacin, 150; Pyridoxine.HCl, 15; Riboflavin, 30; Thiamine mononitrate, 15; dl-α-Tocopherol acetate, 201; Retinyl acetate, 6;
Biotin, 1.5; Folic acid, 5.4; B12,0.06.
6Contains (as mg/kg in diets) : NaCl, 437.4; MgSO4.7H2O.1379.8;
ZnSO4.7H2O,226.4; Fe-Citrate,299; MnSO4,0.016; FeSO4,0.0378;
CuSO4,0.00033; Calciumiodate,0.0006; MgO,0.00135; NaS- eO3,0.00025.
간동결건조한후
, soxtec system 1046 (Tacator AB, Sweden)
을사용하여soxhlet
추출법으로분석하였다.
실험종료후,
혈액 성분분석을위하여실험어를각수조당3
마리씩무작위로추 출한후일회용주사기를이용하여실험어의미부정맥에서혈 액을채혈하고micro-hematocrit
방법으로 헤마토크리트(he- matocrit, PCV)
를측정하였으며,
동시에Drabkin's
용액을사 용하여cyan-methemoglobin
방법(Sigma Chemical, St. Louis MO; total hemoglobin procedure No. 525)
으로헤모글로빈(hemoglobin, Hb)
을측정하였다.
소화율측정
성장실험종료 후
,
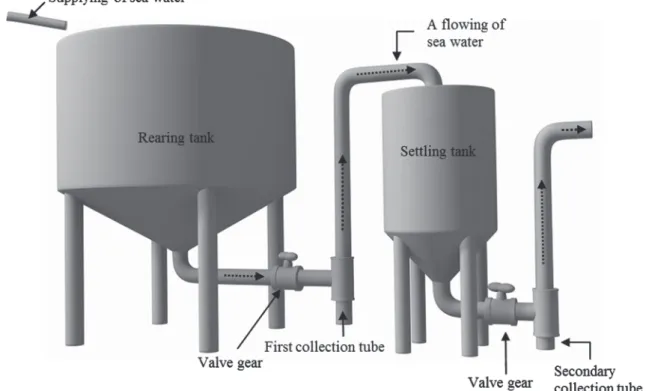
실험어류를자체제작한분수집장치로 이동시켜소화율측정에이용하였다(Fig. 1).
사료공급은매일10
시와16
시에하였으며,
최종사료공급후1
시간뒤에사료 찌꺼기를제거하였다.
분은다음날8
시에분수집장치에모인분을수거하였다
.
이와같은방법으로10
일동안분을수집하 였으며,
회수된분은동결건조시킨후분쇄하여분석전까지-20℃
에보관하였다.
실험사료와분의소화율지시제인Cr
3O
3 함량은ICP (Inductively Coupled Plasma, Perkinelmer ICP- OES 2000DV, USA)
를이용하여분석하였으며, Sugiura et al.
(1998)
에의한공식으로다음과같이소화율을계산하였다.
Apparent digestibility coefficients of dry matter (ADCs of DM, %) = 100×[1- Cr
2O
3in diet (%) / Cr
2O
3in feces (%)]
ADCs of nutrients (%) = 100 - [{nutrient in feces (%) × Cr
2O
3in diet (%)} ÷ {nutrient in diet (%) × Cr
2O
3in feces (%)}×100]
ADCs of the test ingredient (%) = 100/30×(ADCs in test diet - 0.7×ADCs of basal diet)
통계처리
모든 자료의 통계처리는
Computer Program Statistix 3.1 (Analytical Software, St. Paul MN. USA)
로분산분석(ANO- VA test)
을실시하여최소유의차검정(LSD: Least Significant Difference)
으로평균간의유의성(P<0.05)
을검정하였다.
결과 및 고찰
소화율평가는양식어류의배합사료에사용할사료원료를선 정하기위해그원료의가치를평가하는데가장중요한방법이 다
(Kim et al., 2010).
사료원료의소화율에대한정보는영양소 이용가능양을대략적으로공급하기때문에어류의성장을최 대화시킬수있는사료의제작뿐만아니라사료허실에따른오 염을줄일수있어매우유용하게활용된다(Zhou et al., 2004).
사료이용률은단백질원료에따라차이를나타내며
,
어분은높 은단백질함량,
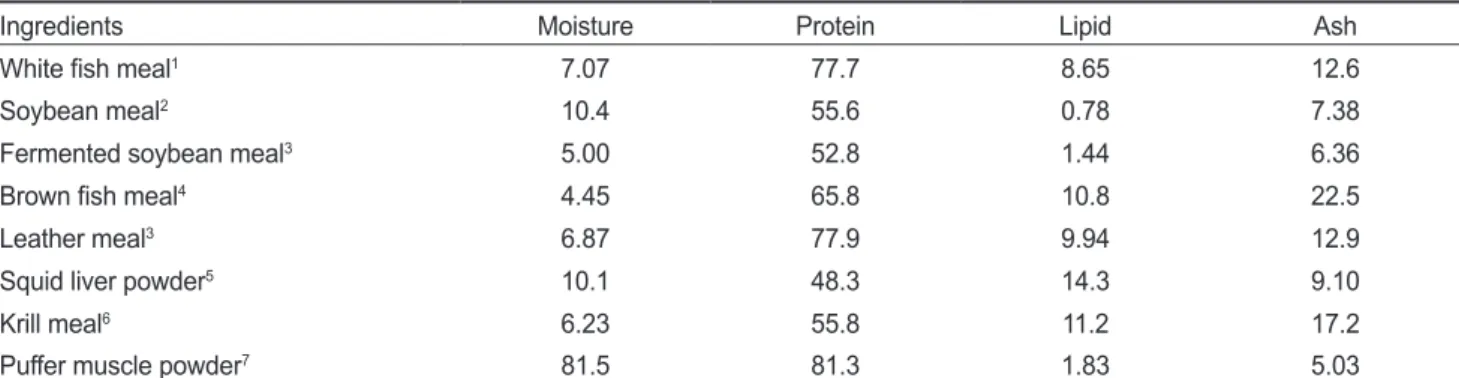
아미노산조성의균형및높은기호성으로어류 Table 2. Proximate composition of dietary protein sources (%, DM)Ingredients Moisture Protein Lipid Ash
White fish meal1 7.07 77.7 8.65 12.6
Soybean meal2 10.4 55.6 0.78 7.38
Fermented soybean meal3 5.00 52.8 1.44 6.36
Brown fish meal4 4.45 65.8 10.8 22.5
Leather meal3 6.87 77.9 9.94 12.9
Squid liver powder5 10.1 48.3 14.3 9.10
Krill meal6 6.23 55.8 11.2 17.2
Puffer muscle powder7 81.5 81.3 1.83 5.03
1From Alaska supplied by Rom Co., Ltd. Goseong, Korea. 2American Soybean Association/Korea. 3CJ Cheiljedang corp. Seoul, Korea.
4From Chile supplied by Rom Co., Ltd. Goseong, Korea. 5Woosungfeed Co. Ltd. Daejeon, Korea. 6Rom Co., Ltd. Goseong, Korea. 7Pre- pared by lyophilized muscle from adult fish.
Table 3. Chemical composition of reference and test diets (%, DM)
Diets1 Moisture Protein Lipid Ash
BD 10.0 52.7 11.5 20.9
WFM 14.8 60.3 10.8 18.0
SM 13.3 52.4 9.08 16.3
FSM 13.4 54.4 9.12 16.2
BFM 15.8 55.7 11.9 20.7
LM 11.3 60.4 11.1 17.6
SLP 12.9 50.9 12.5 16.9
KM 14.7 54.6 12.2 20.0
1BD = basal diet, WFM = BD (70%) + WFM (white fish meal, 30%), SM = BD (70%) + SM (soybean meal, 30%), FSM = BD (70%) + FSM (fermented soybean meal, 30%), BFM = BD (70%) + BFM (brown fish meal, 30%), LM = BD (70%) + LM (leather meal, 30%), SLP = BD (70%) + SLP (squid liver powder, 30%), KM = BD (70%) + KM (krill meal, 30%).
를위한최적의단백질원으로여러어종에서이미잘알려져있 다
(Zhou et al., 2004; Jang et al., 2005; Kikuchi and Furuta,
2009).
황복치어를대상으로한본연구에서도단백질사료원료의소화율평가결과갈색어분
(WFM)
및백색어분(BFM)
실험구가다른동
·
식물성단백질원료(
수지박; LM,
오징어간분; SLP,
크릴분말; KM,
대두박; SM
및발효대두박; FSM)
에비하 여건물소화율및단백질소화율이유의한차이로높게나타났 다(Table 4). Kim et al. (2010)
은넙치를대상으로어분의종류 및품질에따른소화율을평가하기위하여단백질원료로백색 어분,
청어분,
연어분,
멸치어분을이용하여실험한결과각원 료의건물소화율및단백질소화율이백색어분(79%, 95%),
연 어분(77%, 94%),
멸치분(76%, 92%)
및청어분(77%, 94%)
로 유의한차이가나타나지않는다고보고하였다.
이러한결과는 본실험에서단백질함량이77%
인백색어분(WFM)
과66%
인갈색어분
(BFM)
을실험구로하여비교분석한결과,
두실험구간증체율
(69.2%, 82.3%),
건물소화율(78.1%, 80.5%)
및단백질소화율
(95.7%, 96.0%)
에있어서유의한차이가나타나지않은것과유사하였다
.
한편,
발효대두박및오징어간분의건물소 화율및단백질소화율은백색어분및갈색어분과유의한차이 가나타나지않았으나,
대두박,
수지박및크릴분말실험구보 다유의한차이로높게나타났다.
육성기넙치에있어서백색 어분의건물소화율과단백질소화율이각각79%
와95%
인반 면,
오징어간분의건물소화율및단백질소화율이각각72%
및 Fig. 1. Digestibility tank system used in this study.Table 4. Apparent digestibility of dry matter and protein of seven different protein sources1
Diets2 Digestibility (%)3
Dry matter Crude protein
WFM 78.1a 95.7a
SM 54.7c 86.3c
FSM 71.7ab 93.1ab
BFM 80.5a 96.0a
LM 56.2c 88.0bc
SLP 66.6b 91.8abc
KM 53.8c 89.1c
Pooled SEM4 2.41 1.02
1Values are means from triplicate groups, values in the same col- umn not sharing a common superscript are significantly different (P<0.05).
2BD = basal diet, WFM = BD (70%) + WFM (white fish meal, 30%), SM = BD (70%) + SM (soybean meal, 30%), FSM = BD (70%) + FSM (fermented soybean meal, 30%), BFM = BD (70%) + BFM (brown fish meal, 30%), LM = BD (70%) + LM (leather meal, 30%), SLP = BD (70%) + SLP (squid liver powder, 30%), KM = BD (70%) + KM (krill meal, 30%).
3Apparent digestibility values were calculated as previously de- scribed by Sugiura et al. (1998).
4Pooled standard error of mean: SD/√n.
89%
로낮게나타났으며(Kim et al., 2010),
황복을대상으로수 행한본연구에서도오징어간분의건물소화율및단백질소화 율은각각66.6%
및91.8%
로백색어분보다유의한차이로낮 게나타났다. Zhou et al. (2004)
는cobia
를대상으로단백질원 료로어분과,
수지박을이용하여소화율을평가한결과어분의 건물소화율및단백질소화율이각각87.7%
및96.3%
인것에 비하여,
수지박의건물소화율및단백질소화율이각각60.4%
및
87.2%
로수지박이어분에비하여유의한차이로낮게나타났다고보고하였다
.
이러한결과는본실험에서수지박의건물 소화율및단백질소화율이각각56.2%
및88%
로어분실험 구에비하여유의한차이로낮게나타난것과유사하였다.
또 한,
넙치를대상으로수행한실험(Yoo et al., 2006)
에서도백색어분의단백질소화율
86%
에비하여수지박의단백질소화 율이72%
로유의한차이로낮게나타난결과와도유사하였다. Laining et al. (2003)
은humpback grouper
를대상으로어분과 새우분말을단백질원료로이용하여소화율을평가한결과어 분의건물소화율및단백질소화율이각각59%
및82%
이며,
새 우분말의건물소화율및단백질소화율은각각58%
및78%
로 두원료간에유의한차이가나타나지않는다고보고하였다.
그 러나본실험에서는크릴분말의건물소화율및단백질소화율 이각각53.8%
및89.1%
로실험에사용된동물성단백질원료 중가장낮았다.
이러한결과는본실험에사용하기위하여구 입한크릴분말이미세하게분쇄되지않아크릴의갑각이원료 에다량으로포함되어있었고,
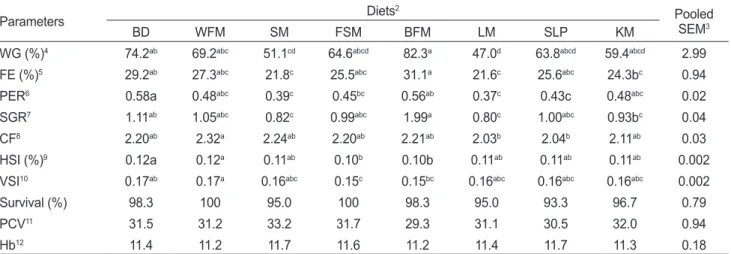
분수집시에도실험어가소화시Table 5. Growth performance of juvenile river puffer Takifugu obscurus fed eight experiment diets for 8 weeks1
Parameters Diets2 Pooled
SEM3
BD WFM SM FSM BFM LM SLP KM
WG (%)4 74.2ab 69.2abc 51.1cd 64.6abcd 82.3a 47.0d 63.8abcd 59.4abcd 2.99
FE (%)5 29.2ab 27.3abc 21.8c 25.5abc 31.1a 21.6c 25.6abc 24.3bc 0.94
PER6 0.58a 0.48abc 0.39c 0.45bc 0.56ab 0.37c 0.43c 0.48abc 0.02
SGR7 1.11ab 1.05abc 0.82c 0.99abc 1.99a 0.80c 1.00abc 0.93bc 0.04
CF8 2.20ab 2.32a 2.24ab 2.20ab 2.21ab 2.03b 2.04b 2.11ab 0.03
HSI (%)9 0.12a 0.12a 0.11ab 0.10b 0.10b 0.11ab 0.11ab 0.11ab 0.002
VSI10 0.17ab 0.17a 0.16abc 0.15c 0.15bc 0.16abc 0.16abc 0.16abc 0.002
Survival (%) 98.3 100 95.0 100 98.3 95.0 93.3 96.7 0.79
PCV11 31.5 31.2 33.2 31.7 29.3 31.1 30.5 32.0 0.94
Hb12 11.4 11.2 11.7 11.6 11.2 11.4 11.7 11.3 0.18
1Values are means from triplicate groups, values in the same row not sharing a common superscript are significantly different (P<0.05).
2BD = basal diet, WFM = BD (70%) + WFM (white fish meal, 30%), SM = BD (70%) + SM (soybean meal, 30%), FSM = BD (70%) + FSM (fermented soybean meal, 30%), BFM = BD (70%) + BFM (brown fish meal, 30%), LM = BD (70%) + LM (leather meal, 30%), SLP = BD (70%) + SLP (squid liver powder, 30%), KM = BD (70%) + KM (krill meal, 30%). 3Pooled standard error of mean: SD/√n. 4Weight gain (%): (final wt. - initial wt.) × 100 / initial wt. 5Feed efficiency (%): (wet weight gain / dry feed intake) × 100. 6Protein efficiency ratio: wet weight gain / protein intake. 7Specific growth rate: (loge final wt. - loge initial wt.) / days. 8Condition factor:[fish wt. (g) / fish length (cm)3]×
100. 9Hepatosomatic index: (liver weight / body weight) × 100. 10Visceralsomatic index: (viscera weight / body weight) × 100. 11PCV (%)
= hematocrit. 12Hb (g/dL) = hemoglobin.
Table 6. Whole body composition (%, DM) of juvenile river puffer Takifugu obscurus fed eight experiment diets for 8 weeks1
Parameters Diets2 Pooled
SEM3
Initial BD WFM SM FSM BFM LM SLP KM
Moisture 76.2±0.24 72.5 74.0 74.0 73.5 74.1 74.6 74.9 73.4 0.26
Crude protein 51.8±0.02 55.5c 56.9bc 58.5ab 59.6a 58.0ab 57.4abc 57.2abc 58.4ab 0.32 Crude lipid 29.5±0.05 30.6a 29.9ab 28.5ab 27.0b 27.8ab 28.7ab 29.2ab 28.3ab 0.35 Ash 10.6±0.02 11.8ab 12.6a 11.1bc 11.2bc 11.0bc 10.4bc 9.80c 10.2c 0.22
1Values are means from triplicate groups, values in the same row not sharing a common superscript are significantly different (P<0.05).
2BD = basal diet, WFM = BD (70%) + WFM (white fish meal, 30%), SM = BD (70%) + SM (soybean meal, 30%), FSM = BD (70%) + FSM (fermented soybean meal, 30%), BFM = BD (70%) + BFM (brown fish meal, 30%), LM = BD (70%) + LM (leather meal, 30%), SLP
= BD (70%) + SLP (squid liver powder, 30%), KM = BD (70%) + KM (krill meal, 30%).
3Pooled standard error of mean: SD/√n.
키지못해분으로배출된것을확인할수있었는데
,
이러한이 유로본실험에서크릴분말의소화율이낮게나타난것으로판 단된다.
식물성단백질원료인대두박의건물소화율(54.7%)
및 단백질소화율(86.3%)
은다른단백질원료에비하여가장낮게 나타났으며,
자주복(Kikuchi and Furuta, 2009),
조피볼락(Lee, 2002), seabass (Tantikitti et al., 2005), hadddock (Tibbetts et al., 2004)
및무지개송어(Cheng and Hardy, 2003)
의결과와유 사하였다.
식물성단백질원료의소화율이낮게나타나는이유 는식물성원료에탄수화물의함량이높은데반하여황복을포 함한잡식성어류는탄수화물이용성이낮기때문이라고알려 져있다(Chong et al., 2003; Bonaldo et al., 2006).
한편,
본실 험에서대두박을발효가공처리함으로써건물소화율(71.7%)
및단백질소화율(93.1%)
이확연하게개선되는효과를나타냈 다.
이러한결과는효모등미생물을이용하여전처리한대두박 을공급한결과European sea bass (Tibaldi et al., 2006)
와조피 볼락(Yoo et al., 2005)
의대두박이용성을향상시킨다고보고 된것과유사하였다.
8
주간의성장평가 결과는단백질원료의건물소화율및단 백질소화율의결과와유사한경향을나타내었다(Table 4).
증 체율,
사료효율 및 일간성장률은 갈색어분 실험구가 대두박 및 수지박실험구에 비하여유의한차이로 높게나타났으며(P<0.05),
백색어분,
발효대두박,
갈색어분,
오징어간분및크릴 분말실험구간에는유의한차이가나타나지않았다.
사료효율 및일간성장률은갈색어분실험구가대두박,
수지박및크릴분 말실험구에비하여유의한차이로높게나타났으며(P<0.05),
기초사료,
백색어분,
발효대두박,
갈색어분및오징어간분실 험구간에는유의한차이가나타나지않았다.
단백질전환효율 은기초사료구가대두박,
수지박및오징어간분실험구에비하 여유의한차이로높게나타났으며(P<0.05),
기초사료,
백색어 분,
발효대두박,
갈색어분 및오징어간분 실험구간에는 유의 한차이가나타나지않았다.
비만도는백색어분실험구가수지 박및오징어간분실험구에비하여유의한차이로높게나타났 으며(P<0.05),
다른실험구간에는유의한차이가나타나지않 았다.
간중량지수는기초사료및백색어분실험구가발효대두 박,
갈색어분실험구에비하여유의한차이로높게나타났으며(P<0.05),
다른실험구간에는유의한차이가나타나지않았다.
내장중량지수는백색어분실험구가발효대두박및갈색어분실 험구에비하여유의한차이로높게나타났으며(P<0.05),
다른 실험구간에는유의한차이가나타나지않았다.
따라서
,
본연구의소화율및성장평가결과를통하여볼때,
황복배합사료의단백질원료로백색어분,
갈색어분,
발효대두 박및오징어간분이활용가능할것으로판단되며,
이러한결과 는경제적이면서영양학적으로적합한황복배합사료를설계하 는데기초자료로활용할수있을것이다.
사 사
본연구는해양수산부수산실용화기술개발사업
(
황복의친환 경양식및산업화기술개발, 311045-03-1-SB010)
에의해이루 어진것임.
References
AOAC. 2000. Official methods of analysis. 16th ed. Associaion of Official Analytical Chemists. Arlington,Virginia, U.S.A.
Bonaldo A, Roem AJ, Pecchini A, Grilli E and Gatta PP. 2006.
Influence of dietary soybean meal levels on growth, feed utilization, gut histology of Egyptian sole (Solea aegyp-
tiaca) Juveniles. Aquaculture 261, 580-586. http://dx.doi.
org/10.1016/j.aquaculture.2006.08.013.
Cheng ZJ and Hardy RW. 2003. Effects of extrusion and ex- pelling processing, and microbial phytase supplementation on apparent digestibility coefficients of nutrients in full-fat soybeans for rainbow trout (Oncorhynchus mykiss). Aqua- culture 218, 501-514.
Chong A, Hashim R and Ali A, 2003. Assessment of soy- bean meal in diets for discus (Symphysodon aequifasciata HECKEL) farming through a fishmeal replacement study.
Aquaculture Research 34, 913-922.
Hajen WE, Higgs DA, Beames RM and Dosanjh BS. 1993.
Digestibility of various feedstuffs by post-juvenile Chinook salmon (Oncorhynchus tshawytscha) in seawater. 2. Mea- surement of digestibility. Aquaculture 112, 333-348.
Jafri AK and Hassan MA. 1999. Energy digestibility coeffi- cients of commonly used feedstuffs in different size class of Indian major carps, Labeo rohita (Hamilton) and Cirrhinus
mrigala (Hamilton). Asian Fish Sci 12, 155-163.
Jang HS, Kim KD and Lee SM. 2005. Effect of various com- mercial fish meals as dietary protein sources on growth and body composition of juvenile flounder, Paralich-
thys olivaceus. J Aquaculture 18, 267-271. http://dx.doi.
org/10.1111/j.1749-7345.2000.tb00882.x.
Kikuchi K and Furuta T. 2009. Use of defatted soybean meal and blue mussel meat as substitute for fish meal in the diet of tiger puffer, Takifugu rubripes. J World Aquac Soc 40, 472-482.
Kim KD, Kim DG, Kim KW, Son MH, Kang YJ, Baek JM and Lee SM. 2010. Effect of dietary wheat flour content on the growth and body composition of the snail, Semisulcospira
gottschei. Kor J fish Aquat Sci 43, 747-750.
Kim JD, Kim KS, Lee SB and Jeong KS. 1997. Nutrients and energy digestibilities of various feedstuffs fed to Israeli strain of growing common carp (Cyprinus carpio). J Aqua- culture 10, 327-334.
Kim KD, Kim DG, Kim SK, Kim KW, Son MH and Lee SM.
2010. Apparent digestibility coefficients of various feed in- gredients for olive flounder, Paralichthys olivaceus. Kor J Aquat Sci 43, 325-330.
Ko GY, Lim SJ, Kim SS, Oh DH and Lee KJ. 2008. Effects
of dietary supplementation of scoria on growth and protein digestibility in juvenile parrot fish Oplegnathus fasciatus and olive flounder Paralichthy olivaceus. J Aquaculture 21, 199-138.
Laining A, Rachmansyah C, Ahmad T and Williams K. 2003.
Apparent digestibility of selected feed ingredient for hump- back grouper Cromileptes altivelis. Aquaculture 218, 529- Lee SM. 2002. Apparent digestibility coefficients of various 538.
feed ingredients for juvenile and grower rockfish (Sebastes
schlegeli). Aquaculture 207, 79-95.
Lee SM, Seo JY, Choi KH and Kim KD. 2008. Apparent amino acid and energy digestibilities of common feed ingredients for flounder, Paralichthys olivaceus. J Aquaculture 21, 89- Sugiura SH, Dong FM, Rathbone CK and Hardy RW. 1998. Ap-95.
parent protein digestibility and mineral availabilities in vari- ous feed ingredients for salmonid feeds. Aquaculture 159, 177-202.
Tantikitti C, Sangpong W and Chiavareesajja S. 2005. Effects of defatted soybean protein levels on growth performance and nitrogen and phosphorus excretion in Acian seabass (Lates
calcarifer). Aquaculture 248, 41-50.
Tibaldi T, Kissil GWM, Sklan D and Pfeffer E. 2006. Apparent digestibility coefficients of feed ingredients and their pre- dictability in compound diets for European sea bass, Sparus
aurata L. Aquacult Nutr 3, 81-89.
Tibbetts SM, Lall SP and Milley JE. 2004. Apparent digestibility of common feed ingredients by juvenile haddock, Melano-
grammus aeglefinnus L. Aquaculture Research 35, 643-651.
Tibbetts SM, Milley JE and Lall SP. 2006. Apparent protein and energy digestibility of common and alternative feed ingre- dients by Atlantic cod, Gadus morhua (Linnaeus, 1758).
Aquaculture 261, 1314-1327.
Yoo GY, SM Choi, Kim KW and Bai SC. 2006. Apparent pro- tein and phosphorus digestibilities of nine different dietary protein source and their effects on growth of juvenile olive flounder, Paralichthys olivaseus. J Aquaculture 19, 254-260.
Yoo GY, Wang XJ, Choi SM, Han KM, Kang YJ and Bai SC.
2005. Dietary microbial phytase increased the phosphorus digestibility in juvenile Korean rockfish Sebastes schlegeli fed diets containing soybean meal. Aquaculture 243, 315- Zhou QC, Tan BP, Mai KS and Liu YJ. 2004. Apparent digest-322.
ibility of selected feed ingredients for juvenile cobia Rachy-