Print ISSN: 1738-3110 / Online ISSN 2093-7717 JDS website: http://kodisa.jams.or.kr/
http://dx.doi.org/10.15722/jds.18.8.202008.89
A Comparison between Korean and Chinese Consumers in Service Quality Evaluation: Focused on the Multiplex Cinema
Seung-In LEE1, Yoonseo PARK2, Yanchun JIN3, Yan ZHANG4
Received: May 31, 2020. Revised: July 24, 2020. Accepted: August 05, 2020
Abstract
Purpose: Our purpose in this study is to compare the SERVQUAL, SERVPERF, and non-difference score measures and to find out which one is better for measuring the service quality of the multiplex cinema service. We also aim to analyze the structural relationships between service quality, customer satisfaction and customer loyalty. Methodology: For the study, we collected data from respondents who have used the multiplex cinema services and conducted an empirical test. SPSS 18.0 was used for descriptive frequency analysis, reliability analysis, and multiple regression analysis, AMOS 18.0 was used for structural equation modeling analysis of causal relationships among variables introduced in research hypotheses. Results: The main results of this study are as follows. First, we found that the non-difference score measure provided a much better model than did other service-measuring models (SERVQUAL, SERVPERF) in Korean and Chinese multiplex cinema. Second, two service-quality factors (Korea-tangibles and assurance vs. China- tangibles and empathy) between the multiplex cinema service quality factors significantly influenced customer satisfaction, which had a significant effect on customer loyalty in Korean and Chinese multiplex cinema. Conclusions: Based on the results, the authors discuss the implications and limitations of this study and future research directions at the end of the paper.
Keywords : Multiplex Cinema, Service Quality, Service Quality Measurement Model, Customer Satisfaction, Customer Loyalty
JEL Classification Code : L82, M31, N25
1. Introduction12
With the accelerated development of the economy and the rise of leisure time, companies in various industries have initiated a great effort to deliver customer-oriented services
1 First Author, Post-Doctor, Rural Development Administration, Jeonju, Korea. Email: [email protected]
2 Corresponding Author, Professor, Department of Business Administration, Jeonbuk National University, Jeonju, Korea.
Email: [email protected]
3 Co-Author, Professor, School of Geography and Tourism, Huizhou University, Huizhou, China
Email:[email protected]
4 Co-Author, Master, Tianjin Dingsheng Wireless Technology Network Company, Tianjin, China.
Email: [email protected]
ⓒ Copyright: The Author(s)
This is an Open Access article distributed under the terms of the Creative Commons Attribution Non-Commercial License (http://Creativecommons.org/licenses/by-nc/4.0/) which permits unrestricted noncommercial use, distribution, and reproduction in any medium, provided the original work is properly cited.
to face up to the intensifying competition and declining profitability. Between those, the film industry, especially the multiplex cinema service industry, has shown an increasingly rapid growth by providing customers with a wide variety of entertainment services and convenient facilities besides a greater choice of available movies. A multiplex is an all-in-one complex building with movie screens, shopping mall, and restaurants together, which was developed by United States' cinema in the 1970s and 1980s with the intent to take back their customers from other media such as video. Meanwhile, a multiplex cinema, identical to multiplex, is a multi-purpose complex building.
Multiplex cinemas in South Korea are growing in places like shopping malls, electronics stores and terminals with a large transient population, and each of them is trying to retain and entertain more customers than do the competitors with high-tech equipment and differentiated services. In the last few years, multiplex cinema has reached its maximum with the growth of movie industry in South Korea, and CGV,
Lotte Cinema, Megabox, called the Big 3 multiplex cinema companies, have been in tough competition to secure their market shares. As of the end of 2013, the number of multiplex cinemas was 278 in South Korea, which took up around 87% of the total number of theaters, and the number of screens was 2,072 which constituted around 95% of the overall screens (Encyclopedia of Korean Culture). As for China, the number of movie theaters and screen shows constant growth, which was 2000 and 6256, respectively, in 2010, and increased to 10176 and 50,776 respectively in 2017, and the revenue increased by five times in the last eight years (from 1.53 billion in 2010 to 8.01 billion in 2017). Compared to Korea, where cinemas with more than seven screens or those run by multiplex franchises are generally regarded as multiplex (Park & Ham, 2016), for China there is no explicit definition or statistics on multiplex cinemas. However, for the types of cinema, the ones with a single screen in China took only 4.30%, and multi-cinemas with more than two screens took 95.2%, which was the largest percentage in 2017 (Film industry in China).
To increase customer satisfaction and loyalty, the multiplex cinema industry in South Korea and China has been interested in measuring and managing the multiplex cinema service quality. Especially, it is essential to measure service quality by valid measuring methods, since excellent service quality improves customer satisfaction and customer loyalty, which is also a socio-economic and development issue (Whyte & Bytheway, 2017). However, the existing studies on service-quality measurement models have been intermittent and also limited to certain services, such as web site service, higher education, public transportation, and supermarket check-out service (Carlson & O’Cass, 2010;
Ledden, Kalafatis, & Mathioudakis, 2011; Randheer, Al- Motawa, & Vijay, 2011; Orel & Kara, 2014). Furthermore, there have been no objective studies on service-quality measurement of the current multiplex cinema industry, which makes it hard for these companies to establish effective marketing strategies, especially when being up against fierce competition. The multiplex cinema industry is a service-driven business, which is the center of a cultural space equipped with shopping, dining, and cultural facilities as well as a movie theater. Since the recent cinema industry tends to grow in a service-driven multiplex cinema, various studies related to cinema service have been conducted. Most of the previous studies investigated relationships between service quality, customer satisfaction, behavior intention of cinema, and the service-quality measurement methods they employed were certain methods such as SERVPERF.
In this study, we aim to measure the service quality of multiplex cinemas objectively in South Korea and China from the perspective of perceived customer quality. That is, targeting multiplex cinemas in South Korea and China, multiplex cinema service quality is to be measured using
SERVQUAL (difference score), SERVPERF (measuring performance only), and non-difference model (measuring expectation and performance at the same time). These have been the most representative service-quality measurement models in recent years. Then we will investigate which measurement model is the most appropriate one for measuring multiplex cinema service quality. We also aim to suggest ways to employ the methods for measuring multiplex cinema service quality in relation to marketing by conducting a comparative study on service-quality measurement methods between customers in South Korea and China.
The other main purpose of this research is to examine the causal relationships between service quality, customer satisfaction, and customer loyalty in multiplex cinemas in South Korea and China. We will investigate the way that multiplex cinema service quality has the effect on customer satisfaction and customer satisfaction on loyalty. The results of this study will provide constructive suggestions for multiplex cinema marketing managers to establish strategies for improving service quality and customer satisfaction. This study is a comparative study on multiplex cinema service between South Korea and China, so the implications will be provided for the multiplex cinema industry in these two countries and others concerned.
2. Theoretical Background and Research Aims 2.1. Service Quality and Service-Quality Measurement Models
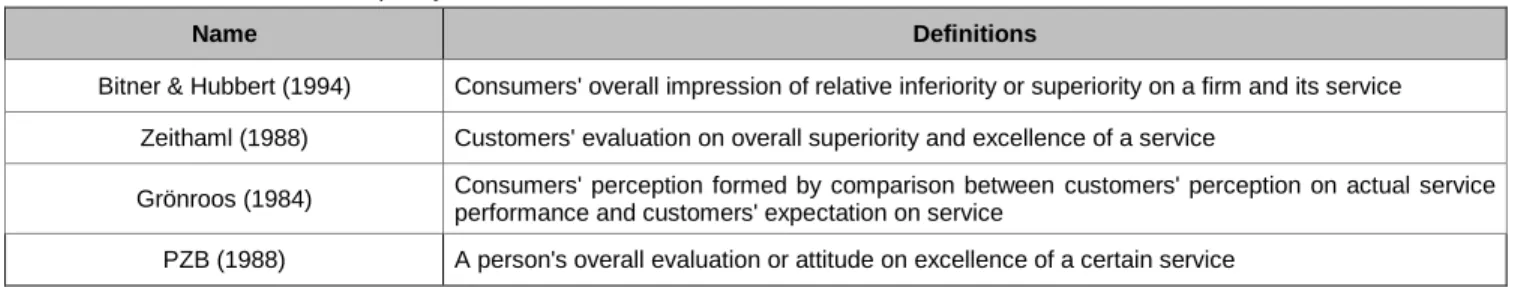
Since the conceptual model of perceived service quality proposed by Parasuraman, Zeithaml, and Berry (1985, hereafter referred to as PZB), studies on service quality have attracted increasing interests and attentions. There are a variety of definitions of service quality, and between them, the ones defined by Grönroos (1984) and PZB (1988) were widely used. Table 1 summarizes the various definitions of service quality. It is imperative to identify the factors and methods for measuring service quality. The most widely used factors are the SERVQUAL questionnaire put forward by PZB, and SERVQUAL, SERVPERF, and a non- difference score measures have been also used for service- quality measurement methods by many researchers (Yarimoglu, 2014).
2.1.1. SERVQUAL
The SERVQUAL (difference score) model developed by PZB is used mostly for measuring service quality. The concept of disconfirmation of expectation and performance presented by Oliver formed the basis of the SERVQUAL (difference score) model. Many studies have been conducted on PZB's SERVQUAL (difference score) model
since 1988. It consisted of ten factors of service quality that were initially suggested by PZB; these are reliability, responsiveness, competence, accessibility, courtesy, communication, credibility, security, understanding the customer, and tangibles. PZB refined the above ten factors to five dimensions (tangibles, reliability, responsiveness, assurance, and empathy) and 22 items by means of empirical studies in 1988 and suggested a revised SERVQUAL with wording adjustments based on empirical analysis of five service companies. Subsequently, studies were published for supporting the evidence of the validity of SERVQUAL by PZB (Bitner, 1990; Bolton & Drew, 1991a, 1991b; PZB, 1991).
Henceforth, Cronin, and Taylor (1992, hereafter, C&T) presented limitations of the SERVQUAL (difference score) model and illustrated the needs of a new service-quality measurement model. Against the critiques on SERVQUAL made by C&T and other scholars, PZB (1994) attempted a refutation by suggesting their related study results. For the assertion proposed by C&T that service quality can be measured better by performance evaluation only without
measuring service quality separately, PZB suggested, by referring to Bolton and Drew (1991a, 1991b), that perception of service quality depends on the difference between performance and expectation, and the difference between performance and expectation explains more service-quality differences than does performance itself.
Additionally, they criticized the method that compares service quality solely by performance of service-quality factors according to Helson (1964) and Kahneman and Miller (1986). PZB also asserted that SERVPER is less useful than SERVQUAL, which provides much more diagnostic information for understanding problems of service quality, and SERVQUAL model’s low conformance results were because C&T disregarded the correlations of the SERVQUAL's five dimensions. Since then, there have been disputes between scholars about the two models for measurement of service quality. However, there are still controversial views between investigators who admit the superiority of SERVQUAL and those who prefer SERVPERF.
Table 1: Definitions of service quality
Name Definitions
Bitner & Hubbert (1994) Consumers' overall impression of relative inferiority or superiority on a firm and its service Zeithaml (1988) Customers' evaluation on overall superiority and excellence of a service
Grönroos (1984) Consumers' perception formed by comparison between customers' perception on actual service performance and customers' expectation on service
PZB (1988) A person's overall evaluation or attitude on excellence of a certain service
2.1.2. SERVPERF
C&T (1992) made the first attempt to measure service quality by using only "performance", replacing PZB's SERVQUAL (difference score) model, which conceptualized "performance" and "expectation" (Lee &
Kim, 1999). C&T adopted a perspective that service quality should be conceptualized and measured by attitude and also perceived that service quality equals performance. Based on that, C&T developed a performance-only model, SERVPERF (which measures performance only) and attempted a criticism of the SERVQUAL (difference score) model, a byword of service-quality measurement. That is, C&T argued that there are difficulties in measuring service quality using expectation-performance disconfirmation even if it can be measured arithmetically (Carman, 1990).
In other words, it failed to confirm using SERVQUAL, even though confirmatory factor analysis was conducted to identify PZB's five service-quality factors. In addition, C&T concluded that the SERVQUAL model was valid in only two industries (banking and fast-food) out of all four (banking, pest control, dry cleaning, and fast-food). On the
other hand, SERVPERF was valid on four industries in their comparative study of SERVPERF and the established SERVQUAL models using five dimensions (22 items).
They also asserted the superiority of the SERVPERF model based on the fact that it showed higher explanatory power than did SERVQUAL by comparing adjusted R2 values in a regression analysis. Since then, researchers such as Boulding, Kalra, Staelin, and Zeithaml(1993), and Carman (1990), also pointed out the flaws of SERVQUAL models (Martà nez & Martà nez, 2010; Lee & Kim, 1999).
2.1.3. Non-difference Score
Both of the aforementioned arguments about SERVQUAL models (PZB 1988, 1991, 1994) and SERVPERF models (C&T 1992, 1994), have their own limitations. Hence, Brown, Churchill, and Peter (1993) suggested that it is more relevant to use a non-difference score obtained by asking participants directly about the performance degree (+ or -) of what they expected rather than measure the difference between performance and expectation (performance - expectation).
SERVQUAL and the revised-SERVQUAL measure expectation and performance simultaneously using one questionnaire, but many scholars brought up an issue about the measurement method using different scores between expectation and performance from one questionnaire (Brown, Churchill, & Peter 1993; Spreng & Mackoy 1996).
In traditional satisfaction/dissatisfaction studies (e.g., Cardozo, 1965; Churchill & Surprenant, 1982; Oliver 1977, 1980; Oliver & Desarbo, 1988; Olshavsky & Miller, 1972;
Olson & Dover, 1979; Tse & Wilton, 1988), first expectation level is measured, then performance achieved, and finally performance level is measured. However, since SERVQUAL measures expectation and performance at the same time using one questionnaire, the performance level experienced by customers becomes a reference point (Helson, 1964), and it is possible that it had an effect on answers about expectation level. Cronin and Taylor (1992) also found that their measure of service performance (SERVPERF) produced better results and consequently less bias than did the SERVQUAL.
In this case, it had problems with measuring expectation and performance simultaneously using the same questionnaire. On this, Brown, Churchil, and Peter (1993) criticized that SERVQUAL is the most popular method for measuring service quality, but it has problems with its conceptualization of the difference-score in assessing service quality, and this assertion was also brought up by many other scholars (Babakus & Mangold, 1989; Carman, 1990; C&T, 1992). Accordingly, Brown, Churchill, and Peter (1993) suggested that it is more desirable to use the non-difference score obtained by questioning the performance on expectation (+ or -) to participants than using the difference-score of "performance-expectation"
obtained by measuring expectation and performance. In addition, Bitner (1990) and Bolton and Drew (1991b) also measured inconsistency without measuring expectation, and Lee and Kim (1999) approved the superiority of the non- difference score as the most appropriate instrument in their studies obtained by questioning the performance on expectation (+ or -) over that of SERVQUAL or SERVPERF on measuring service quality in hotels, mobile internet, and gas stations.
There have still been controversial issues about which of these three models is superior until now. In fact, none of the models currently satisfies all the objectives of service improvement; so future research is needed on the service- quality measurement model (Seth, Deshmukh, & Vrat, 2005). The studies have been done on comparing the performance of measurement models of service quality across a variety of service industries. Lee and Kim (1999) delivered a research result indicating that the non-difference model was more adequate than were the SERVQUAL and SERVPERF models in an empirical analysis on the hotel
industry, and Moisescu and Gica (2013) showed that the SERVPERF model is the most appropriate for measuring the effect of service quality on satisfaction, repurchase and recommend intention. Nevertheless, no study has been conducted to compare service-quality models for a multiplex cinema service targeting South Korea and China. Therefore, as the first specific research aim, we attempt to identify which one of the SERVQUAL, SERVPERF and non- difference models would be best suited for measuring multiplex cinema service-quality in South Korea and China.
2.2. Service Quality, Customer Satisfaction and Customer Loyalty
In this study, our research spotlight is to formulate a targeted strategy for improving the multiplex cinema service by a comparative analysis of relationships between service quality, customer satisfaction and customer loyalty between South Korea and China.
It has been proven by some researchers that service quality is related to customer satisfaction, and service- quality dimensions were used to measure customer satisfaction in some previous studies. However, there is a definite conceptual difference between the two. Service quality is a concept focusing on a long-term and overall assessment, whereas customer satisfaction concentrates on a moment and a decision scale in a specific context.
Furthermore, customers’ perception of service quality reflects assessment of service employee at a crucial moment, whereas customer satisfaction can be likened to an individual pursuit, a goal to be attained by consuming and patronizing of services (Oliver, 2014).
However, it has been demonstrated that service quality is a preceding variable of a customer satisfaction in recent studies. Grönroos (1984) reported that service quality has an effect as a preceding variable on customer satisfaction.
Woodside, Frey, and Daly (1989) also advocated that customer satisfaction plays a role as a mediator between service quality and intend to purchase. On the other hand, C&T (1992) argued that service quality is a preceding factor of customer satisfaction based on empirical survey results on a variety of industries. This relationship is also indicated in the research undertaken in Korea. Yi, Kim, and Kim(1996) concluded that service quality shows a positive effect on customer satisfaction in their research on ten national service industries, and Lee and Kim (1999), Han (2004) reported the same conclusion that service quality is the preceding variable of customer satisfaction.
We thus hypothesize that the service quality of a multiplex cinema has a positive effect on customer satisfaction (H1). The five factors of service quality that will have positive effects on customer satisfaction in the detailed hypotheses suggested by PZB.
H1: The service quality of a multiplex cinema in South Korea and China has a positive effect on customer satisfaction.
H1-1: Tangibles in South Korea and China have a positive effect on customer satisfaction.
H1-2: Reliability in South Korea and China has a positive effect on customer satisfaction.
H1-3: Responsiveness in South Korea and China has a positive effect on customer satisfaction.
H1-4: Assurance in South Korea and China has a positive effect on customer satisfaction.
H1-5: Empathy in South Korea and China has a positive effect on customer satisfaction.
Furthermore, it has been confirmed that customer satisfaction shows an obvious effect on corporate performance in many studies. Also, customer satisfaction could improve customer loyalty, which intensified the customer relationship and thereby created new customers (Fornell & Wernerfelt, 1988; Reichheld & Sasser, 1990).
We thus established the hypothesis (H2) that customer satisfaction will have a positive effect on customer loyalty as put forward in previous studies.
H2: Customer satisfaction of with a multiplex cinema in South Korea and China will have a positive effect on customer loyalty.
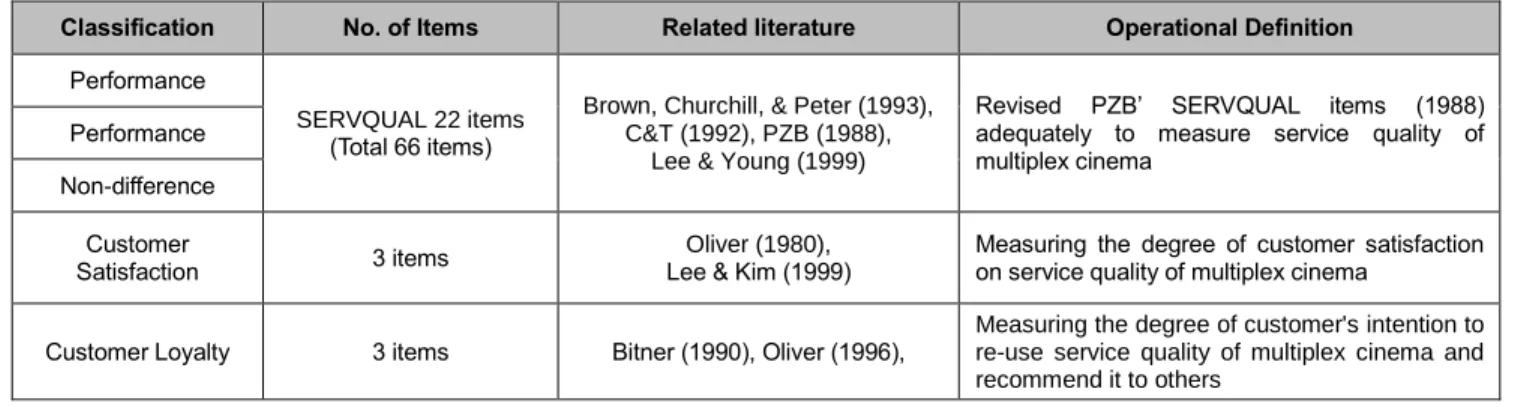
Table 2: Operational definition of variables
Classification No. of Items Related literature Operational Definition
Performance
SERVQUAL 22 items (Total 66 items)
Brown, Churchill, & Peter (1993), C&T (1992), PZB (1988),
Lee & Young (1999)
Revised PZB’ SERVQUAL items (1988) adequately to measure service quality of multiplex cinema
Performance Non-difference
Customer
Satisfaction 3 items Oliver (1980),
Lee & Kim (1999)
Measuring the degree of customer satisfaction on service quality of multiplex cinema
Customer Loyalty 3 items Bitner (1990), Oliver (1996), Measuring the degree of customer's intention to re-use service quality of multiplex cinema and recommend it to others
3. Measures and Methods
Variables in this research, which have already shown reliability and validity in prior studies, consist of the measurement questionnaire items. These items were modified adequately for measuring multiplex theater service quality including customer satisfaction, customer loyalty and SERVQUAL, with 22 items each (a total of 66 items). The survey questionnaire consists of 22 items measuring the degree of expectation, 22 items measuring the degree of performance, and 22 items measuring the differences between expectation and performance. Of them, the 22 SERVQUAL items were proposed by PZB, as were the other three customer satisfaction dimensions, three customer loyalty dimensions, and additional items for investigating general properties of samples (Table 2).
SPSS 18.0 and AMOS 18.0 are statistical analysis software used for empirical analysis. SPSS 18.0 was used for descriptive frequency analysis, reliability analysis, and multiple regression analysis, AMOS 18.0 was used for structural equation modeling analysis of causal relationships among variables introduced in research hypotheses.
4. Results
4.1. Comparison of Service-quality Measurement Models
4.1.1. Verification of Reliability
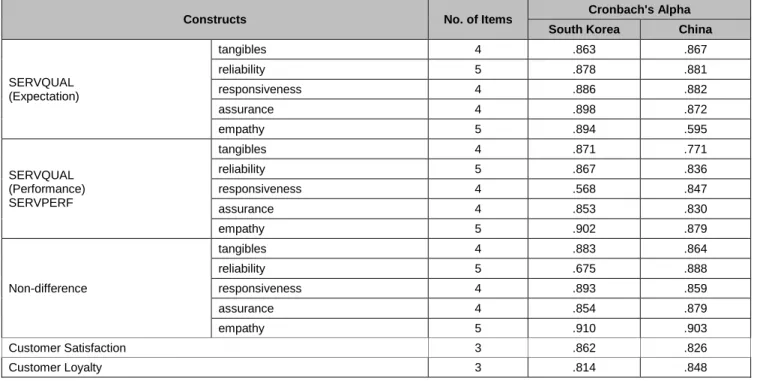
To identify an appropriate measurement method for assessing service quality of the multiplex cinema in South Korea and China, the first task is the analysis of reliability and validity. When a factor analysis is done for assessing validity, one item might be excluded for its similarity with other construct items and thus not be suitable for comparing the three service measurement models. In this research, however, the construct items were all assessed as having validity to a certain extent for the three measurement methods. Furthermore, the construct items for the three measurement methods can be considered acquiring validity already to a certain extent. Thus, we did not need an exploratory factor analysis in this study in order to see how to compare the explanatory powers of the three scales, as done in Lee and Kim (1999). For each measurement model, Cronbach's alpha was computed as did in previous studies for reliability analysis. All the items were retained unless the value was lower than it has been in a previous
measurement. The results of the reliability analysis are shown in Table 3; most of the Cronbach's alpha are greater than the average of Korea marketing research of .7685, so reliability of measurement items was achieved (Lee & Kim, 1999).
4.1.2. Comparison of Service-quality Measurement Models using R2
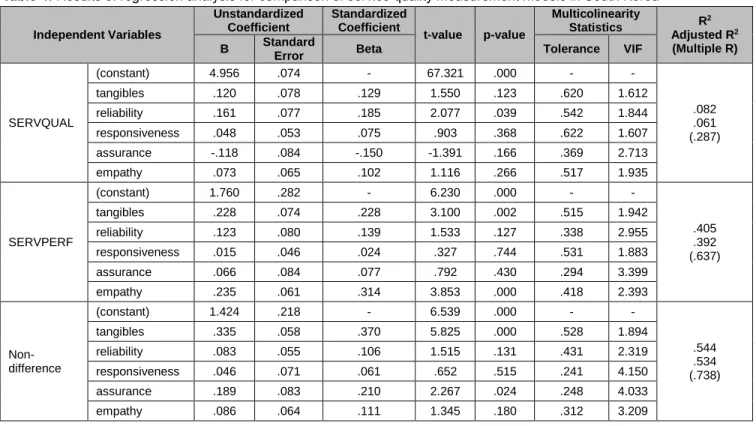
We carried out a regression analysis, which used customer satisfaction as a response variable and five dimensions as independent variables, to find the most adequate measurement model for the service quality of multiplex cinemas. Because the five dimensions of service quality and customer satisfaction were measured using
multiple items, their average values were used in the analysis.
We used R2 to compare the measurement models of service quality in this study. Tables 4 and 5 show the results of regression analysis for each of the three measurement methods. For South Korea, non-difference model (R2= .544) asking directly the difference between expectation and performance is superior to both SERVQUAL (R2= .082) and SERVPERF (R2= .405) as shown in Table 4. Thus, if the non-difference model is used for measuring the service quality of multiplex cinemas, it will explain the degree of customer satisfaction better than SERVQUAL and SERVPERF do.
Table 3: Results of reliability analysis
Constructs No. of Items Cronbach's Alpha
South Korea China
SERVQUAL (Expectation)
tangibles 4 .863 .867
reliability 5 .878 .881
responsiveness 4 .886 .882
assurance 4 .898 .872
empathy 5 .894 .595
SERVQUAL (Performance) SERVPERF
tangibles 4 .871 .771
reliability 5 .867 .836
responsiveness 4 .568 .847
assurance 4 .853 .830
empathy 5 .902 .879
Non-difference
tangibles 4 .883 .864
reliability 5 .675 .888
responsiveness 4 .893 .859
assurance 4 .854 .879
empathy 5 .910 .903
Customer Satisfaction 3 .862 .826
Customer Loyalty 3 .814 .848
In addition, we did a further analysis to test the significance of difference by comparing multiple R of two independent regression lines by Fisher's Z transformation (Cohen & Cohen, 1983). We found that Z values were 4.769 (p< .01) for comparing SERQUAL to SERVPERF and 2.010 (p<.05) for comparing SERVPERF to the non- difference model, which turns out to be statistically significant.
Likewise, the non-difference model asking directly for the difference between expectation and performance (R2= .463) for China is superior to both SERVQUAL (R2= .134) and SERVPERF (R2= .431) as shown in Table 5.
Also, if the non-difference model is used for the service quality of multiplex cinemas, it can explain the degree of
customer satisfaction better than does SERVQUAL or SERVPERF.
Meanwhile, to test the significance of difference between R2 of the three measurement models, the analysis compares the multiple R of two independent regression lines by Fisher's Z transformation. We found that the Z value for comparing SERVQUAL with SERVPERF was 4.037 (p< .01), that SERVPERF has a higher value than does SERVQUAL, as in the South Korean data, and that the difference is significant statistically. In contrast, the z-value for comparing SERVPERF with the non-difference model was 0.416 (p> .05), which was not as significant as in the South Korean study but also confirmed that the non- difference model is superior to SERVPERF.
Collectively, as a measurement model of service quality, SERVPERF has more explanatory power than does
SERVQUAL, and the non-difference model’s explanatory power is proved to be more adequate.
Table 4: Results of regression analysis for comparison of service quality measurement models in South Korea Independent Variables
Unstandardized Coefficient
Standardized Coefficient
t-value p-value
Multicolinearity
Statistics R2
Adjusted R2 (Multiple R) B Standard
Error Beta Tolerance VIF
SERVQUAL
(constant) 4.956 .074 - 67.321 .000 - -
.082 .061 (.287)
tangibles .120 .078 .129 1.550 .123 .620 1.612
reliability .161 .077 .185 2.077 .039 .542 1.844
responsiveness .048 .053 .075 .903 .368 .622 1.607
assurance -.118 .084 -.150 -1.391 .166 .369 2.713
empathy .073 .065 .102 1.116 .266 .517 1.935
SERVPERF
(constant) 1.760 .282 - 6.230 .000 - -
.405 .392 (.637)
tangibles .228 .074 .228 3.100 .002 .515 1.942
reliability .123 .080 .139 1.533 .127 .338 2.955
responsiveness .015 .046 .024 .327 .744 .531 1.883
assurance .066 .084 .077 .792 .430 .294 3.399
empathy .235 .061 .314 3.853 .000 .418 2.393
Non- difference
(constant) 1.424 .218 - 6.539 .000 - -
.544 .534 (.738)
tangibles .335 .058 .370 5.825 .000 .528 1.894
reliability .083 .055 .106 1.515 .131 .431 2.319
responsiveness .046 .071 .061 .652 .515 .241 4.150
assurance .189 .083 .210 2.267 .024 .248 4.033
empathy .086 .064 .111 1.345 .180 .312 3.209
Table 5: Results of regression analysis for comparison of service quality measurement models in China Independent Variables
Unstandardized Coefficient
Standardized Coefficient
t-value p-value
Multicolinearity
Statistics R2
Adjusted R2 (Multiple R) B Standard
Error Beta Tolerance VIF
SERVQUAL
(constant) 4.943 .097 - 51.145 .000 - -
. 134 .112 (.366)
tangibles -.079 .070 -.103 -1.121 .264 .525 1.906
reliability .184 .106 .221 1.740 .083 .272 3.674
responsiveness .003 .083 .004 .038 .970 .341 2.936
assurance .183 .088 .238 2.092 .038 .341 2.932
empathy -.006 .056 -.009 -.104 .917 .531 1.885
SERVPERF
(constant) 1.373 .287 - 4.786 .000 - -
.431 .417 (.657)
tangibles .006 .080 .006 .078 .938 .433 2.308
reliability .155 .109 .161 1.421 .157 .226 4.431
responsiveness .092 .105 .100 .879 .381 .223 4.480
assurance .323 .092 .328 3.501 .001 .329 3.037
empathy .121 .079 .130 1.534 .127 .400 2.499
Non-difference
(constant) 1.519 .251 - 6.044 .000 - -
.463 .449 (.680)
tangibles .175 .075 .193 2.331 .021 .398 2.515
reliability .152 .094 .163 1.607 .110 .265 3.780
responsiveness .007 .112 .007 .059 .953 .188 5.326
assurance .066 .089 .072 .744 .458 .293 3.417
empathy .290 .090 .322 3.232 .001 .274 3.649
Table 6: Comparison of R2 for respective service quality measurement model Models
Target
SERVQUAL (performance-expectation)
SERVPERF
(performance) Non-difference
South Korea .082 .405 .544
China .134 .431 .463
4.2. Analysis on Relationships between Service Quality, Customer Satisfaction and Customer Loyalty
We built a research model to test hypotheses 1 and 2 about causal relationships between service quality factors, customer satisfaction, and customer loyalty in South Korea and China. We did the data analysis using AMOS 18.0. As the service-quality factor, we used the five quality factors of the non-difference model, which were identified to be
mostly adequate for assessing the service quality of multiplex cinemas in research aim 1, both in Korea and China.
4.2.1. Confirmatory Factor and Reliability Analysis In this study, exploratory factor analysis was omitted in the process of checking the validity of the construct items.
This was because the construct items used in this study have been sufficiently validated in prior studies (Kline, 2005).
Table 7: Confirmatory factor analysis and reliability analysis in South Korea
Factor Items Estimate Standardized
Estimate S.E. t-value Construct
Reliability AVE
tangibles
tangibles 1 1.268 .841 .094 13.475
.776 .660
tangibles 2 1.264 .874 .090 14.083
tangibles 3 .977 .743 .084 11.574
tangibles 4 1.000 .785 - -
reliability
reliability 1 1.043 .766 .096 10.883
.758 .502
reliability 2 1.109 .322 .244 4.549
reliability 3 1.214 .848 .101 12.020
reliability 4 1.070 .763 .099 10.833
reliability 5 1.000 .719 - -
assurance
assurance 1 1.044 .814 .081 12.889
.784 .594
assurance 2 1.038 .804 .082 12.696
assurance 3 .885 .684 .084 10.479
assurance 4 1.000 .773 - -
empathy
empathy 1 1.068 .814 .078 13.697
.832 .677
empathy 2 .978 .743 .081 12.889
empathy 3 1.211 .896 .077 15.658
empathy 4 1.123 .850 .077 14.552
empathy 5 1.000 .802 - -
customer satisfaction
Satisfaction 1 1.000 .841 - -
.774 .681
Satisfaction 2 1.128 .844 .077 14.692
Satisfaction 3 1.012 .790 .075 13.420
customer loyalty
loyalty 1 1.000 .712 - -
.671 .619
loyalty 2 1.063 .899 .096 11.056
loyalty 3 .930 .737 .093 10.014
X2=532.959, df=237, p<.001, X2/df=2.249, GFI=.828, AGFI=.782, CFI=.918, TLI=.904, RMSEA=.076 t-value marked with '-' means set a path coefficient of 1 for a measurement item of a latent variable (theoretical variable)
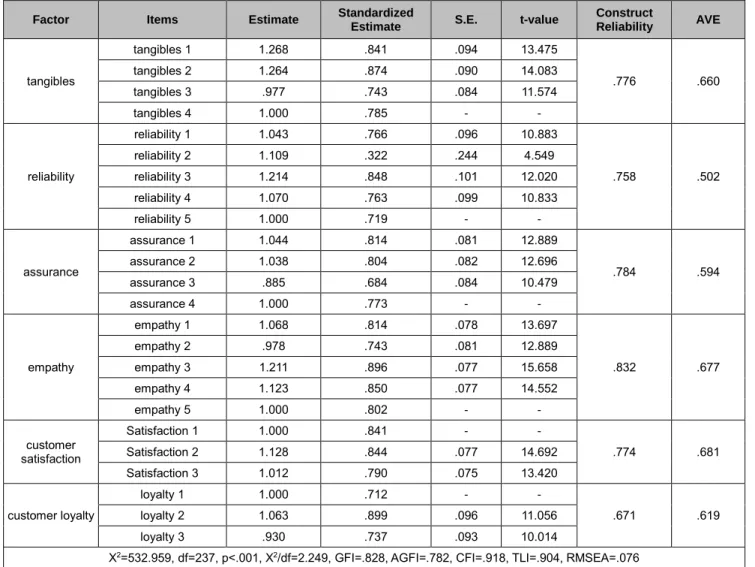
And we did a confirmatory factor analysis to confirm the validity of the theoretical measurement models and so tested convergent and discriminant validity. Because the confirmatory analysis revealed that the reaction dimension damages the validity, we did the analysis after excluding reaction-related items. Table 7 shows the results of the confirmatory analysis of the measurement models in South Korea. First, the goodness-of-fit index of the measurement model was GFI= .828, AGFI= .782, CFI= .918, TLI= .904, and RMSEA= .076, which satisfy the evaluation criteria for goodness of fit. It is presumed that there would be no significant obstacle in an analysis of the measurement model.
On the other hand, the X2 of the measurement model used in this study was 532.959 and thus did not confirm the superiority of the measurement model. However, one needs to be careful in interpreting the X2 value because X2 statistics depend on the number of parameters and sample size. If many parameters are being estimated, one should use X2/df, called Normed Chi-square (Hair, Black, Babin, Anderson, & Tatham, 2006). The value of X2/df of a current measurement model is 2.249 (recommended to be
less than 5.0; when a sample size is large, the generally recommended value is from 2.0 to 3.0), which showed the superiority of the measurement model used in this study. In addition, all factor loadings had statistically significant t- values, implying that convergent validity and a single dimensionality were achieved between individual construct concepts. On the other hand, another measurement of the convergent validity is average variance extract (AVE), which is a magnitude of variance of a latent concept explained by indices, and it should be greater than 0.5 to achieve reliability. In this study, AVEs of all factors were greater than 0.5, so we concluded that convergent validity was achieved.
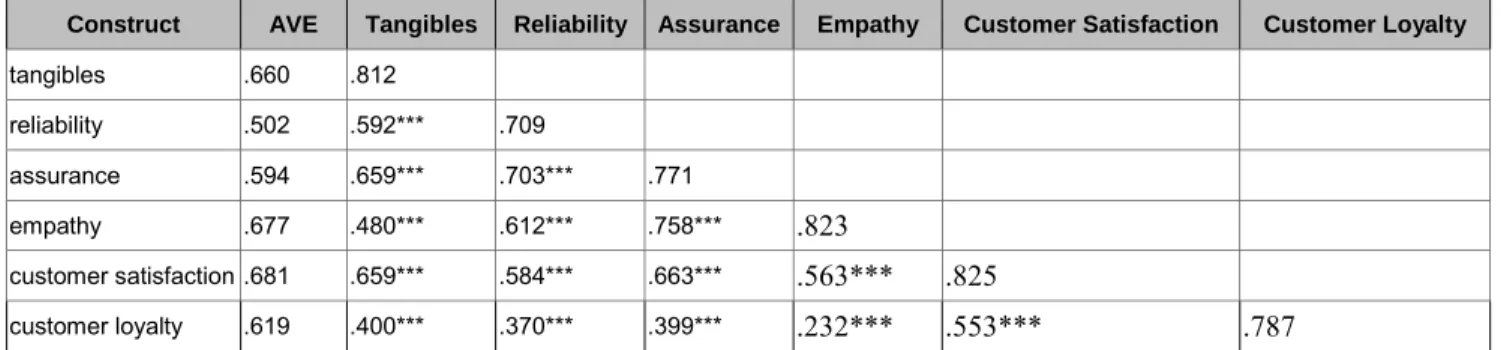
Next, we did an analysis for discriminant validity. Out of the various methods for analyzing discriminant validity, we employed a method of checking if AVE exceeded squared correlation coefficients between concepts (Fornell
& Lacker, 1981). As shown in Table 8, squared correlation coefficients across all study variables did not excess AVEs, we concluded that discriminant validity among all construct concepts were achieved.
Table 8: Correlative concept and average variance extraction in South Korea
Construct AVE Tangibles Reliability Assurance Empathy Customer Satisfaction Customer Loyalty
tangibles .660 .812
reliability .502 .592*** .709
assurance .594 .659*** .703*** .771
empathy .677 .480*** .612*** .758*** .823
customer satisfaction .681 .659*** .584*** .663*** .563*** .825
customer loyalty .619 .400*** .370*** .399*** .232*** .553*** .787
***: significant at a significance level of 0.01, diagonal line: square root value of AVE
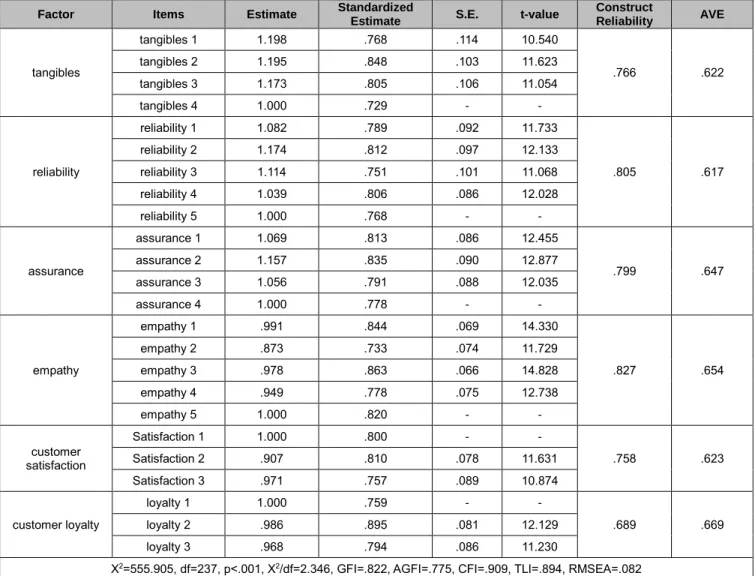
Table 9 shows the result of a confirmative factor analysis of a measurement model for China. The goodness of fit index of the measurement model was GFI= .822, AGFI= .775, CFI= .909, TLI= .894, and RMSEA= .082, and satisfied the evaluation criteria for goodness of fit. We concluded that there would be no significant obstacle to an analysis of the measurement model. Additionally, the X2 value of a measurement model used in the current study was 555.905 (df= 237, p<.001); so that a superiority of the measurement model was not confirmed. However, X2/df, called Normed Chi-square, was 2.346 (recommended to be less than 5.0 when a sample size is large, and a generally recommended value is from 2.0 to 3.0), less than the recommended criterion, thus confirming the superiority of the measurement model used in this study.
In addition, all factor loadings’ t-value were statistically significant, implying that a convergent validity and a single
dimensionality were achieved between individual construct concepts. On the other hand, another measurement of the convergent validity is average variance extract (AVE), which is a magnitude of variance of a latent concept explained by indices, and it should be greater than 0.5 to achieve reliability. In this study, the AVEs of all factors were greater than 0.5, and we concluded that convergent validity was achieved.
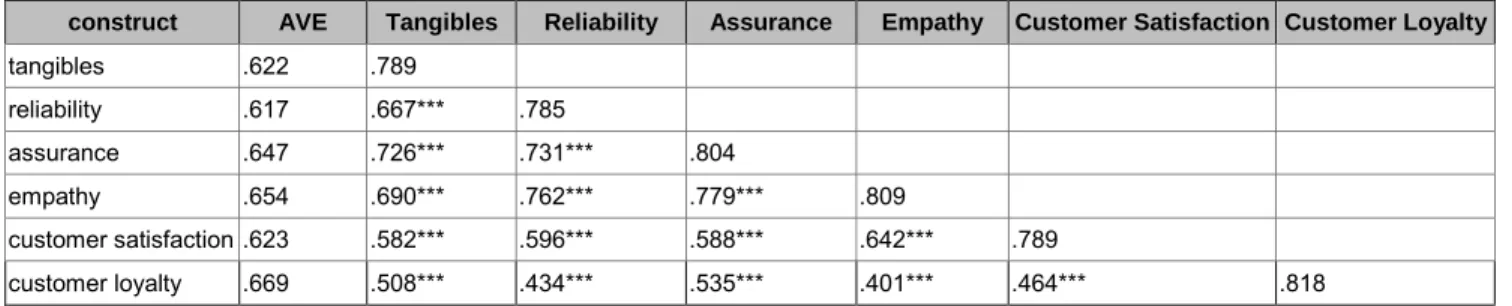
Next, we did an analysis for discriminant validity. Out of various methods for analyzing discriminant validity, we employed a method of checking if AVE exceeds the squared correlation coefficients between concepts (Fornell
& Lacker, 1981). As shown in Table 10, since the squared correlation coefficients did not exceed the AVEs across all study variables, we concluded that discriminant validity between all construct concepts was achieved.
Table 9: Confirmatory factor analysis and reliability analysis in China
Factor Items Estimate Standardized
Estimate S.E. t-value Construct
Reliability AVE
tangibles
tangibles 1 1.198 .768 .114 10.540
.766 .622
tangibles 2 1.195 .848 .103 11.623
tangibles 3 1.173 .805 .106 11.054
tangibles 4 1.000 .729 - -
reliability
reliability 1 1.082 .789 .092 11.733
.805 .617
reliability 2 1.174 .812 .097 12.133
reliability 3 1.114 .751 .101 11.068
reliability 4 1.039 .806 .086 12.028
reliability 5 1.000 .768 - -
assurance
assurance 1 1.069 .813 .086 12.455
.799 .647
assurance 2 1.157 .835 .090 12.877
assurance 3 1.056 .791 .088 12.035
assurance 4 1.000 .778 - -
empathy
empathy 1 .991 .844 .069 14.330
.827 .654
empathy 2 .873 .733 .074 11.729
empathy 3 .978 .863 .066 14.828
empathy 4 .949 .778 .075 12.738
empathy 5 1.000 .820 - -
customer satisfaction
Satisfaction 1 1.000 .800 - -
.758 .623
Satisfaction 2 .907 .810 .078 11.631
Satisfaction 3 .971 .757 .089 10.874
customer loyalty
loyalty 1 1.000 .759 - -
.689 .669
loyalty 2 .986 .895 .081 12.129
loyalty 3 .968 .794 .086 11.230
X2=555.905, df=237, p<.001, X2/df=2.346, GFI=.822, AGFI=.775, CFI=.909, TLI=.894, RMSEA=.082 t-value marked with '-' means set a path coefficient of 1 for a measurement item of a latent variable (theoretical variable)
4.2.2. Hypothesis Test
Overall goodness of fit of the research models was examined prior to testing hypotheses in a structural equation model. Goodness-of-fit indices of the current research models for South Korea are X2= 545.938(df= 241, p< .001), X2/df= 2.265, GFI= .824, AGFI= .781, CFI= .915, TLI= .903, RMSEA= .076 and those for China are X2= 582.156 (df= 241, p< .001), X2/df= 2.416, GFI= .815, AGFI= .769, CFI= .902, TLI= .888, RMSEA= .084, which suggests that most indices were acceptable (Marsh & Hau, 1996). Thus, we concluded that there was no significant lack of fit of the research models for either South Korea or China and did the hypothesis tests. Figures 1 and 2 showed the results of analyzing the current research models.
For South Korea, H1 was accepted partially (accept H1-1;
path coefficient= .373, t-value= 3.683; accept H1-4: path coefficient= .423, t-value= 1.962), and H2 was also
accepted, since customer satisfaction significantly affects customer loyalty (path coefficient= .789, t-value= 7.636).
For China, H1 was partially accepted (accept H1-1; path coefficient= .263, t-value= 1.929; accept H1-5: path coefficient= .294, t-value= 1.874), and H2 was also accepted, since customer satisfaction significantly affects customer loyalty (path coefficient= .760, t-value= 6.781).
5. Summary and Conclusion 5.1. Summary and Discussion
Managing service quality has drawn increasingly more attention, as it provides a new opportunity for companies to increase profits and cultivate a core ability to secure their
competitiveness. Likewise, for the service industry of cinema, the necessity of managing and measuring the service quality of multiplex cinemas as perceived by customers is emphasized as the qualitative growth strategy coming into the picture along with a quantitative growth strategy. Thus, we did a study objectively to measure the service quality of multiplex cinemas in South Korea and China in terms of perceived customer quality. We investigated the most adequate service-quality measuring models, targeting customer service of multiplex cinemas in South Korea and China. In addition, we also probed the causal relationships between service quality, customer satisfaction, and customer loyalty.
We fo und that the non-difference model is more adequate than are the SERVPERF or SERVQUAL models in measuring the perceived quality of multiplex cinema service both in South Korea and China, which corresponds with those of Brown, Churchill and Peter (1993), and Lee and Kim (1999). For multiplex cinema service, we argue
that t h e non-difference model resolves problems in measuring expectation and performance at the same time using one questionnaire and reflects the Oliver' traditional expectation discrepancy model (1980), which is the reason that it is more appropriate than t h e SERVQUAL o r SERVPERF model. In addition, for the results of causal relationships b e t w e e n service quality, tangibles and assurance of multiplex cinema, service quality has a positive effect on customer satisfaction, and customer satisfaction has a positive influence on customer loyalty in South Korea. F or China, tangibles and empathy of multiplex cinema service quality exercise a positive effect on customer satisfaction, which then has a positive effect on customer loyalty. These results support the existing studies on the relationship b e t w e e n service quality, customer satisfaction and customer (Andreassen &
Lindestad, 1998; Dabholkar, Thorpe, & Rentz, 1996; Oliver, 1980; PZB, 1988; Mosahab, Mohamad, & Ramayah, 2010).
Table 10: Correlative concept and average variance extraction in China
construct AVE Tangibles Reliability Assurance Empathy Customer Satisfaction Customer Loyalty
tangibles .622 .789
reliability .617 .667*** .785
assurance .647 .726*** .731*** .804
empathy .654 .690*** .762*** .779*** .809
customer satisfaction .623 .582*** .596*** .588*** .642*** .789
customer loyalty .669 .508*** .434*** .535*** .401*** .464*** .818
***: significant at a significance level of 0.01, diagonal line: square root value of AVE
Figure 1: Results (South Korea) Figure 2: Results (China)
5.2. Theoretical and Practical Suggestions
Looking at controversies about service-quality measurement models, this study has significance for
measuring service quality using SERVQUAL, SERVPERF, and non-difference models. We targeted the service quality of multiplex cinemas in South Korea and China and compared the explanatory power of the measuring model.