미세조직 정량 분석을 통한 고체산화물연료전지용 NiO-YSZ 연료극 지지체의 기계적/전기적 성능 예측
완디 와휴디1,2⋅무하마드 샤질 칸1,2⋅송락현1,2⋅이종원1,2⋅임탁형1,2⋅박석주1,2⋅이승복1,2,†
1한국에너지기술연구원 연료전지연구실, 2과학기술연합대학원
Prediction of Mechanical and Electrical Properties of NiO-YSZ Anode Support for SOFC from Quantitative Analysis of Its Microstructure
WANDI WAHYUDI1,2, MUHAMMAD SHIRJEEL KHAN1,2, RAK-HYUN SONG1,2, JONG-WON LEE1,2, TAK-HYOUNG LIM1,2, SEOK-JOO PARK1,2, SEUNG-BOK LEE1,2,†
1Fuel Cell Research Center, KIER, 152 Gajeong-ro, Yuseong-gu, Daejeon 34129, Korea
2Department of Advanced Energy Technology, UST, 217 Gajeong-ro, Yuseong-gu, Daejeon 34113, Korea
†Corresponding author : [email protected]
Received 8 September, 2017 Revised 25 September, 2017 Accepted 30 October, 2017
Abstract >> Improving the microstructure of NiO/YSZ is one of several ap- proaches used to enhance the electrical and mechanical properties of an anode support in Solid Oxide Fuel Cells (SOFCs). The aim of the work reported in this pa- per was to predict the relationship between these microstructural changes and the resulting properties. To this end, modification of the anode microstructure was carried out using different sizes of Poly (Methyl Methacrylate) (PMMA) beads as a pore former. The electrical conductivity and mechanical strength of these samples were measured using four-probe DC, and three-point bend-test meth- ods, respectively. Thermal etching followed by high resolution SEM imaging was performed for sintered samples to distinguish between the three phases (NiO, YSZ, and pores). Recently developed image analysis techniques were modified and used to calculate the porosity and the contiguity of different phases of the anode support. Image analysis results were verified by comparison with the po- rosity values determined from mercury porosimetry measurements. Contiguity of the three phases was then compared with data from electrical and mechanical measurements. A linear relationship was obtained between the contiguity data determined from image analysis, and the electrical and mechanical properties found experimentally. Based upon these relationships we can predict the elec- trical and mechanical properties of SOFC support from the SEM images.
Key words : Fuel cells(연료전지), Electrical property(전기적 특성), Mechanical property (기계적 특성), Image analysis(이미지 분석), SOFC(고체산화물연료전지)
DOI: https://doi.org/10.7316/KHNES.2017.28.5.521 pISSN 1738-7264•eISSN 2288-7407
1. Introduction
Most commonly used anode support in SOFCs is a porous cermet composed of nickel and YSZ, which is inexpensive but electro-catalytically active enough for hydrogen oxidation at the SOFCs operating temperatures. These characteristics, as established in, are not only influenced by macroscopic parameters such as composition of starting materials, but are also critically controlled by microscopic features such as grain size, anode porosity, number of Triple Phase Boundaries (TPBs), and contiguity of the constituent phases (NiO, YSZ, and pores). However, the number of TPBs, gas permeability, and contiguity of different phases are in turn, dependent on the porosity of the anode support. Therefore, the use of different pore formers such as PMMA, carbon black, and graphite is a common practice to induce additional porosity in the supports. Similarly, a single pore former that forms pores of different sizes, or in different num- bers, could also be used to alter the pore structure of the anode support, which in turn would affect its electrical and mechanical properties. Pore formers thus help us to achieve the desired porosity and pore-size distribution, so as to produce pathways for gas diffusion and hence a better electrochemical per- formance1-8).
During recent years, a great deal of research has been carried out to assess the performance of anodes used in SOFCs, using quantitative microstructural analysis. This approach makes it possible to predict the performance of an SOFC anode under specified operating conditions. Lee et al.6) and Lee et al.7) illus- trated the relationship between Ni-YSZ anode micro- structure and its electrical properties using an image analysis method. In some other studies by Simwonis et al9). and Pihlatie et al.10), the coarsening rate of the Ni particles in a Ni-based anode was predicted using
similar methods. However, the work done in is fo- cused on managing the properties of a Ni-YSZ anode without pore formers. Therefore, to represent the real situation of the anode microstructure, it is necessary to introduce some pore former into the anode support. These modified supports should then be fur- ther studied to determine the relationship between their electrical and mechanical properties and their microstructure, using quantitative microstructural analysis6-10).
In this paper, therefore, we report a more in-depth study on the relationship between mechanical strength, electrical conductivity, and microstructural condition of the anode. The anode condition has been described by the term, ‘contiguity’, which is actually the connectivity of different phases of anode (NiO, YSZ, pores). Based on our consideration that the con- tiguity of the constituent phases of the anode micro- structure is significantly affected by pore-related pa- rameters, we modified the pore structure of an anode support using various sizes of poly(methyl meth- acrylate) (PMMA) particles. Porosity of the samples was determined by mercury porosimetry measurements.
Four-probe DC and three-point bend-test methods were used to determine the electrical conductivity and flexural strength of the samples, respectively. After- wards, the contiguity of the anode constituent phases was calculated using image analysis and subsequently, the relationship between the contiguity of the con- stituent phases and their corresponding properties was determined.
2. Experimental procedure
2.1 Sample preparation
Anode slurries were prepared by ball milling nick- el oxide (J.T. Baker, USA), yttria-stabilized zirconia
(Tosoh, Japan), and PMMA (Sekisui, Japan) powders in ethanol for 24 hours. The microstructure of the anode was controlled by varying the size of the PMMA beads used as pore formers. The slurries were then dried, sieved and uni-axially pressed at 250 MPa to produce rectangular samples (2.8×6.1×24 mm).
These samples were then pre-heated at 350 °C to re- move the pore-former and subsequently sintered at 1,400°C for 5 hours in air. Several numbers of the sintered samples were reduced to Ni-YSZ in hydro- gen atmosphere at 700°C for 14 hours. The hydrogen supply was maintained during the whole experiment (i.e., from room temperature to 700°C, and then back to room temperature), so that the oxidation of Ni back to NiO could be prevented. These samples were then used for electrical conductivity measurements.
However, for mechanical strength measurements, sin- tered samples were used directly after grinding and polishing.
2.2 Characterization
The properties of the anode support were de- termined using several different techniques. The po- rosity of the samples was measured using Mercury Intrusion Porosimetry. Electrical conductivity of the reduced samples was measured with a four-probe DC measurement technique in N2 (100 mL/min) and H2
(70 mL/min), and the temperature during this meas- urement was varied between 500 and 900°C.
For electrical conductivity measurements, the sam- ples were wrapped with platinum (Pt) wire and the contact resistance between the samples and the Pt wire was further reduced by applying a non-fluxed Pt paste. Current was supplied and the voltage drop across the probe was measured with a digital source-meter (Keithley 2400, USA).
The flexural strength of the samples was de-
termined by the three-point bend-test method (Instron, USA). Prior to the bend test, the surface flaws of a sample were removed by grinding it on SiC paper. The test was then performed with a fix- ture having a 20 mm span, at a constant cross-head speed of 5 mm/min at room temperature.
In order to meet the requirements of a proper 2D SEM image for quantitative analysis, it is necessary to produce well-distinguished constituent phases in flat, cross-sectional specimens. For this purpose, the samples were first cold mounted using a polymer res- in and then ground and polished with SiC paper and diamond suspension, so as to attain a mirror-like surface. The samples were then thermally etched at the sintering temperature (1,400°C) for 10 min to highlight the NiO-YSZ grain boundaries. A 10 kV scanning electron microscope (SEM) equipped with a back-scattered electron detector was used to generate digital micrographs of these samples. Finally, the mi- crographs were analyzed with Image-Pro Plus 6 (Media Cybernetics, USA) for microstructural quanti- fication, as detailed in the next section.
2.3 Quantification of microstructure con- stituent phases
The characteristics of the back-scattered NiO-YSZ micrographs were quantitatively analyzed with image processing software (Image-Pro Plus 6). The in- formation obtained from the two-dimensional image was then transformed into three-dimensional struc- tural information based on quantitative stereological theory. Two important steps should be followed in order to obtain valuable information from the image processing software.
The micrographs must be calibrated using the available calibration feature (spatial calibration) in the image processing software package. This step was
completed by matching the scale line of the program with the scale line of the SEM image.
The different phases must be separable on the ba- sis of their color. Image analysis requires consistent segmentation of different phases within a given micrograph. This step has been demonstrated in Fig.
1(a), where the three constituent phases (NiO, YSZ and pores) can be clearly distinguished by gray, bright, and black areas. The segmentation process was completed by determination of a constant grey- scale value for each phase as demonstrated in Fig.
1(b)–(d).
Using the imaging software, the porosity of the anode support was calculated as the ratio of pore area to the total area of a given image. The porosity val- ues for the different samples obtained by this method were then compared with experimental data obtained from mercury porosimetry measurement to confirm the validity of the imaging analysis process. The ex- perimental values, and those determined from image analysis, are both shown in Fig. 4(a). Based on the validity of the results obtained for porosity, the rela- tionship between the several anode properties and its microstructural characteristics was then studied in re- lation to the term ‘contiguity’ (Ci). Contiguity is de- fined as the fraction of the contact areas () of phase i relative to the total inner surface. Contiguity of a given phase was calculated on the basis of a study presented by Simwonis et al.9). They proposed that the 3-D contiguity (Ci) of phase i in a mixture of two phases could be calculated using the following equation:
∑
(1)
Therefore, the contiguity of each phase in an anode substrate containing three phases can be ex- pressed as:
(2)
where α, β, and γ represent NiO, YSZ, and pores, respectively.
Considering the relationship between volume-sur- face area (Vα/) and intercept length (lα) of phase α,
(3)
and substituting equation (3) for each correspond- ing phase in equation (2), will result in a general equation for the three-dimensional contiguity of NiO, YSZ, and pores, as described below:
(4)
The volume and intercept length of the anode con- stituent phases were calculated through the image analysis software. The 3-D contiguity of the con- stituent phases of the anode microstructure was then calculated using equation (4).
3. Results and discussion
3.1 Microstructure evaluation
A quantitative analysis of the anode microstructure is essential to assess its electrical and mechanical properties. In various studies, both direct and indirect techniques have been reported to distinguish the con- stituent phases in a Ni-YSZ substrate (Ni, YSZ, and pores)9-13). However, they further reported that this differentiation is not an easy task. This is because of some structural features of the anode, such as particle size and backscattered coefficients of Ni and YSZ
Fig. 1. Image processing with Image Pro Plus 6: (a) Three constituent phases of an anode. YSZ, NiO, and pores are rep- resented by bright, grey and dark color, respectively.
Segmentation of three phases as shown in (b) pore (green);
(c) NiO (red); and (d) YSZ (blue)
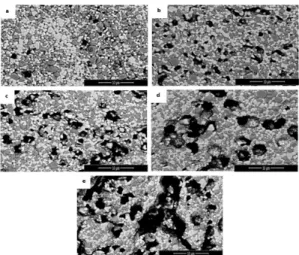
Fig. 2. SEM micrographs of NiO-YSZ composite having po- rosity values of (a) 6.1%; (b) 21.1%; (c) 21.8%; (d) 28.2%; and (e) 30.0% induced by various amounts of PMMA. The images were generated by 10 kV SEM in back-scattered electron mode. Three phases as shown in (b) pore (black); (c) NiO (grey); and (d) YSZ (white)
phases (which are almost identical), are quite complicated. Therefore, it has always been very diffi- cult to characterize the correlation between the anode microstructure and its properties.
In our study, we introduced a very simple and via- ble method to differentiate each constituent phase in the anode microstructure. The method involves the thermal etching of the polished cross-sections of sin-
tered specimens. As a result, clear boundaries be- tween the anode constituent phases were obtained`
which could easily be seen in the SEM micrographs.
These micrographs were obtained with an SEM equipped with a back-scattered electron (BSE) de- tector, as explained in the previous section. The qual- ity of the generated NiO-YSZ micrographs was found to be much higher than those used in previous stud- ies6,7). These micrographs (Fig. 2) clearly show well-defined interfaces of the anode constituent phas- es (YSZ, NiO, and pores). All three of the phases in Fig. 2 were then differentiated via EDAX analysis and it was found that the bright areas in the micro- structure are of YSZ, the grey area is of NiO, while the black area corresponds to pores.
The open porosity of the NiO-YSZ specimens was determined using mercury porosimetry, in order to determine the optimum microstructural characteristics, as well as to validate the image analysis results. The pore-size distribution and the porosity values ob- tained for various anode substrates are shown in Fig.
3. The samples were named in the sequence of in- duced porosity values (i.e., S1 6.1%; S2 21.1%; S3 21.8%; S4 28.2%; and S5 30.0% porosity). From Fig.
3, it is quite clear that pore characteristics such as pore size and pore distribution, are strongly affected by the characteristics of the PMMA powder that was used as a pore former. Utilization of the pore formers in the anode supports is necessary to produce addi- tional porosity in order to meet the criteria of mini- mum required porosity. This additional porosity is obtained when the pore formers are removed during the pre-heating stage of the anode support, which is usually carried out at 350°C in air. The porosity val- ue increased and the pore size distribution became broader with increase in PMMA size. Specimens S2, S3, and S4 offered appropriate initial anode porosity (20 to 30%). This value is expected to increase to the
Fig. 3. Pore size distribution for NiO-YSZ anodes measured using mercury porosimetry: Correlation between anode po- rosity and its pore size distribution. This shows that higher po- rosity results in broader pore size distribution in the anode
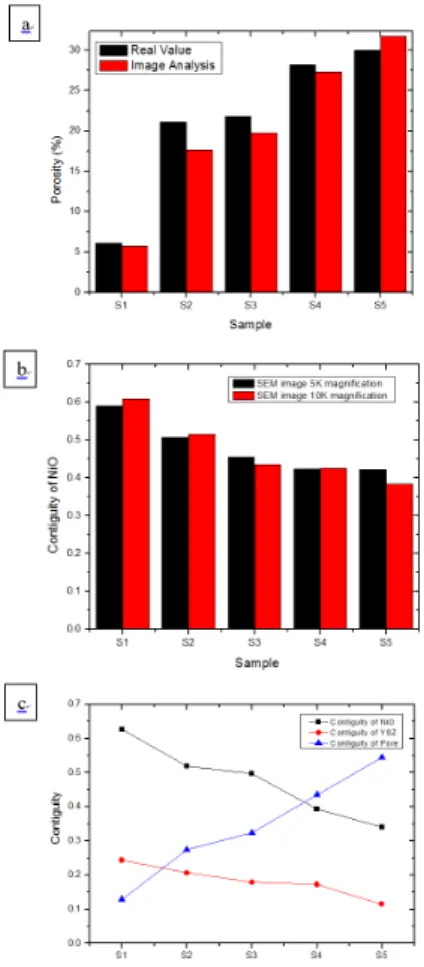
Fig. 4. (a) Comparison of NiO contiguity quantified from 5 and 10 k magnification of micrographs: Reliability assessment of the quantification process with different magnification (less than 10% deviation); (b) Porosity of the NiO-YSZ anode ob- tained from image analysis vs real values of porosity; and (c) Contiguity of NiO, YSZ, and pores of anode quantitatively measured by imaging software
required levels (35-40%) after the reduction process, where the initial volume of nickel oxide contributes to increased porosity when it is reduced to nickel metal5,6).
3.2 Assessment of image analysis in relation to experimental data
In order to verify the reliability of our micro- structural quantification process using the imaging software, contiguity values for NiO from 5 and 10 k SEM micrographs have been compared. The results are very interesting and have been presented in Fig.
4(a). This figure demonstrates that the contiguity val- ues obtained from the 5 and 10-k magnified SEM images were almost equal. The maximum deviation of the analysis was less than 10%. Therefore, it can be deduced that the contiguity values obtained are re- liable and show reproducibility.
Similarly, the estimated porosity values obtained from the image analysis were compared with the vol- ume fraction of pores obtained via mercury porosimetry. These results have also been presented in Fig. 4(b). The figure shows that the estimated vol- ume fraction of pores obtained by both these methods is almost identical, hence again confirming the val- idity of our image analysis method. A slight differ- ence between the two values might be due to the lim- itations of mercury porosimetry, which can only de- termine the open porosity values, while both open and closed porosities can be determined using the im- age analysis technique.
The above two examples clearly indicate that our image analysis process is reliable and acceptable for representing information about the characteristics of the anode substrate. Furthermore, we also compared the contiguity values of the anode constituent phases as shown in Fig. 4(c). The figure reveals that the
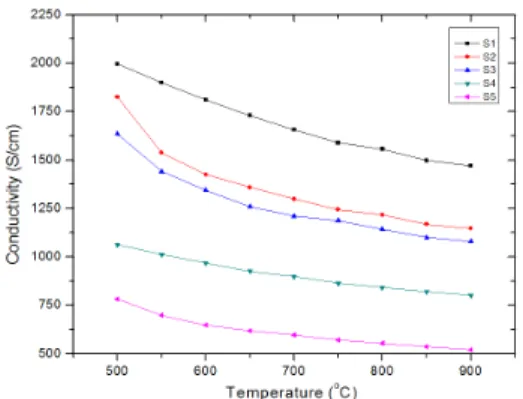
Fig. 5. Temperature-dependent electrical conductivity of the anode: Electrical behavior of metallic materials
Fig. 6. Electrical conductivity of anode at 600, 700, 800, and 900 °C: Effect of electron conducting phase (NiO) contiguity, calculated by image analysis
contiguity of NiO and YSZ decreases with increasing contiguity of pores. Similarly, the electrical con- ductivity and mechanical strength of the anode sub- strate were observed to decrease when anode porosity increased. Hence, it is clear that the microstructural information is very important in understanding and estimating the various properties of an SOFC anode.
To elucidate the important role of contiguity, we dis- cuss its effect on the electrical and mechanical prop- erties of the anode in the next section.
3.3 Nickel oxide contiguity vs electrical conductivity
High electrical conductivity of the anode is one of
the main factors that must be considered to achieve the best performance in SOFCs. The anode used for SOFCs contain the NiO phase which is converted to nickel under a reducing atmosphere at higher temperatures. The resultant nickel phase is an active medium that is highly electrically conductive and cat- alytically active for hydrogen oxidation. However, there remain some problems associated with the use of Ni as an anode material. The most important of these is the agglomeration of Ni at higher temperatures. Such agglomeration leads to instability of the anode microstructure, which ultimately results in decreased electrochemical activity and mechanical strength. Furthermore, the conversion of NiO to Ni under the reducing conditions of the anode results in the formation of greater porosity. The higher porosity in turn results in discontinuity within the conducting network phase (Ni).
Therefore, it is necessary to define an optimum Ni content in the anode to achieve the best performance.
N. Vivet et al. suggested the use of higher Ni content (54, 56, and 61 wt%)2). Usually, it is reported that the Ni content in the anode should be adjusted so as to obtain a Ni:YSZ ratio of 40:60 vol%14). A higher vol- ume percent of nickel results in a TEC mismatch be- tween Ni and YSZ and mechanical instability, while a lower volume percent results in lower conductivity and increased ohmic losses at the anode.
Conductivity data plotted for the different anode specimens has been presented in Fig. 5. This figure demonstrates that the electrical conductivity for all of the specimens ranged between 102 and 103 S/cm.
Furthermore, the electrical conductivity decreases with increasing temperature. This behavior is similar to the particular behavior of metallic solids (i.e., an increase in temperature causes a decrease in the con- ductivity of the material). This observation makes it clear that the electrical conduction in the anode oc-
curs due to the presence of metallic phase Ni. Fig. 5 also explains the effect of porosity on the con- ductivity of the anode substrate. As shown in the fig- ure, there is a gradual decrease in electrical con- ductivity with increasing sample porosity. Therefore, we take into account that the pore structure has a strong influence on the properties of the anode substrate. The pore structure affects the contiguity of the constituent phases (Ni in this case), which in turn affects the electrical properties of the anode substrate.
Higher porosity can reduce the contiguity of Ni, which in turn leads to decreased electrical con- ductivity and vice versa. This relationship between these two variables is also shown in Fig. 6, which clearly describes that the contiguity of Ni is respon- sible for the electrical properties of the anode substrate. A linear relation exists between the two quantities. Therefore, on the basis of these ex- perimental results, we can predict the electrical con- ductivity of a certain sample by knowing the con- tiguity of Ni in the anode microstructure and vice versa.
3.4 YSZ contiguity vs mechanical strength
The flexural strength of a sample is defined as the highest stress experienced within the material at the moment of rupture. The flexural strength data for the different anode samples was collected and analyzed using the Weibull statistics15):
exp
m ax
(5) Where Pf is the probability of failure in the Weibull distribution, σmax is the maximum strength before the failure occurs, σc is the Weibull strength in the reference sample or characteristic strength,and m represents the Weibull modulus. The Weibull modulus m is a shape parameter for the Weibull dis- tribution, which maps the failure probability of a component under varying stress. A larger value of m, indicates higher component reliability, and vice versa16).
Fig. 7 presents the Weibull plots for the fracture strengths of the different specimens. The best Weibull distribution for the flexural strength among the differ- ent specimens was shown by Specimen S2. This specimen had great fracture strength as well as a high Weibull modulus value, representing high component reliability. This phenomenon might be attributed to the well-distributed and homogenously sized pores that were produced by PMMA particles of identical size. A uniform distribution of pores allows the stress to be distributed uniformly throughout the micro- structure, thus relaxing local stresses. Such relaxation helps to increase the fracture strength of the compo- nent as well as its reliability. On the other hand, al- though Specimen S1 had higher mechanical strength than S2, this substrate possessed a rough fracture dis- tribution plot; hence lower component reliability m.
Therefore, such a result might lead us to the wrong interpretation about the specific mechanical strength of a material.
Data in Fig. 7 also imply that the mechanical strength of the anode substrate increased as its poros- ity decreased. This behavior follows the proposed re- lationship between strength (σ) and porosity (p):
exp (6)
where σo is the strength of the non-porous struc- ture and b is a pre-exponential coefficient related to the pore structure17).
Similarly, the relation between the characteristic strength of the anode substrate and YSZ contiguity
Fig. 7. Weibull plots for the corresponding fracture strength of the NiO-YSZ anode: This was measured on a bar specimen using a 3-point bending test with 20-mm span at a constant cross-head speed of 5 mm/min
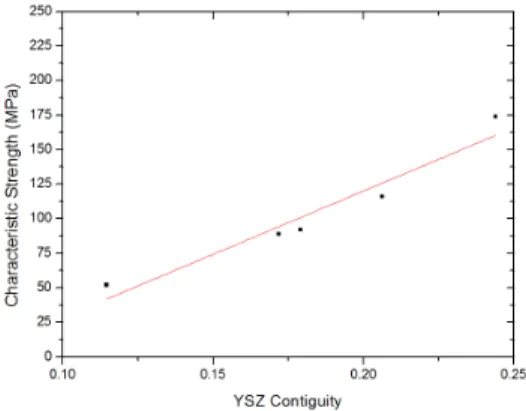
Fig. 8. Characteristic strength of the anode substrate as a function of YSZ contiguity: Linear relationship between YSZ contiguity of the anode and its mechanical strength
has been presented in Fig. 8. The terminology “char- acteristic strength” has been used in order to describe the engineering strength of a given material. We de- termined the characteristic strength of the substrate from the Weibull plot presented in Fig. 7, when lnln (1/(1-Pf)) is equal to zero. Fig. 8 shows that the specimens with higher YSZ contiguity show a higher characteristic strength than the samples with lower YSZ contiguity values. This is because of the lower connectivity of the concrete skeleton of the YSZ phase, with increasing porosity. Therefore, it can easily be deduced that a lower YSZ contiguity im-
plies a lower connectivity of the ceramic skeleton in the YSZ phase. As a result, the mechanical strength of the substrate cannot be maintained at higher flexu- ral forces and the samples break readily, even under relatively lower stresses.
4. Conclusions
Contiguity of the SOFC anode constituent phases (i.e., NiO, YSZ, and pores) is strongly influenced by its pore structure, which was changed by varying the size of the PMMA used as the pore former. The changing contiguity values, with changing anode po- rosity for all the three constituent phases, were de- termined using image analysis techniques. Electrical conductivity and fracture strength of the samples were measured and then compared with contiguity values determined using the image analysis technique. It was found that as the contiguity of the pores and the porosity increased, a decrease in the contiguity of NiO and YSZ was observed. This is be- cause the pores hinder the connectivity of these phases. Moreover, the contiguity of NiO linearly cor- responds to the anode’s electrical conductivity, while the contiguity of the ceramic skeleton YSZ phase has a strong correlation with the mechanical strength of the anode. In order to attain the best performance of an SOFC anode, the combination of contiguities for all the three phases should be optimized. The opti- mization of pore contiguity will result in the for- mation of well-defined pathways for gas diffusion, while the optimized contiguity of NiO and YSZ will help to attain the best electrical and mechanical properties.
Acknowledgement
This work was supported by the New & Renewable
Energy R&D Program under the Ministry of Know- ledge Economy (MKE). Moreover, this work was con- ducted under the framework of the research and de- velopment program of the Korea Institute of Energy Research (B7-2422).
References
1. T. Talebi, M. H. Sarrafi, M. Haji, B. Raissi, and A.
Maghsoudipour, “Investigation on microstructures of NiO-YSZ composite and Ni-YSZ cermet for SOFCs“, Int. J.
Hydrogen Energy, Vol. 35, 2010, pp. 9440-9447.
2. N. Vivet, S. Chupin, E. Estrade, A. Richard, S. Bonnamy, D.
Rochais, and E. Bruneton, “Effect of Ni content in SOFC Ni-YSZ cermet: A three-dimensional study by FIB-SEM to- mography”, J. Power Sources, Vol. 196, 2011, pp.
9989-9997.
3. W. Wahyud, B. Ahmed, S. B. Lee, R. H. Song, J. W. Lee, T. H.
Lim, and S. J. Park, "Quantitative Microstructure Analysis to Predict Electrical Property of NiO-YSZ Anode Support for SOFCs", Trans. of the Korean Hydrogen and New Energy Society, Vol. 24, 2013, pp. 237-241.
4. B. R. Roy, N. M. Sammes, T. Suzuki, Y. Funahashi, and M.
Awano, “Mechanical properties of micro-tubular solid ox- ide fuel cell anodes”, J. Power Sources, Vol. 188, 2009, pp.
220-224.
5. L. Mingyi, Y. Bo, X. Jingming, and C. Jing, “Influence of pore formers on physical properties and microstructures of supporting cathodes of solid oxide electrolysis cells”, Int. J.
Hydrogen Energy, Vol. 35, 2010, pp. 2670-2674.
6. J. H. Lee, H. Moon, H.W. Lee, J. Kim, J. D. Kim, and K. H.
Yoon, “Quantitative analysis of microstructure and its re- lated electrical property of SOFC anode, Ni-YSZ cermet”, Solid State Ionics, Vol. 148, 2002, pp. 15-26.
7. K. R. Lee, S. H. Choi, J. Kim, H. W. Lee, and J. H. Lee, “Viable image analyzing method to characterize the microstructure and the properties of the Ni/YSZ cermet anode of SOFC”,
J. Power Sources, Vol. 140, 2005, pp. 226-234.
8. J. Y. Hu, Z. Lv, K. F. Chena, X. Q. Huang, N. Ai, X. B. Du, C.
Fu, J. Wang, and W. Su, “Effect of composite pore-former on the fabrication and performance of anode-supported membranes for SOFCs”, J. Membr. Sci., Vol. 318, 2008, pp.
445-451.
9. D. Simwonis, F. Tietz, and D. Stover, “Nickel coarsening in annealed Ni-8YSZ anode substrate for solid oxide fuel cells”, Solid State Ionics, Vol. 132, 2000, pp. 241-251.
10. M. H. Pihlatie, A. Kaiser, M. Mogensen, and M. Chen,
“Electrical conductivity of Ni-YSZ composite: Degradation due to Ni particle growth”, Solid State Ionics, Vol. 189, 2011, pp. 82-90.
11. P. Plonczak, M. Gazda, B. Kusz, and P. Jasinski, “Fabrication of solid oxide fuel cell supported on specially performed ferrite-based perovskite cathode”, J. Power Sources, Vol.
181, 2008, pp. 1-7.
12. D. S. Lee, J. H. Lee, J. Kim, H.W Lee, and H. S. Song, “Tuning of the microstructure and electrical properties of SOFC anode via compaction pressure control during forming”, Solid State Ionics, Vol. 166, 2004, p. 13.
13. J. H. Lee, J. W. Heo, D. S. Lee, J. Kim, G. H. Kim, H. W. Lee, H. S. Song, and J. H. Moon, “The impact of anode micro- structure on the power generating characteristic of SOFC”, Solid State Ionics, Vol. 158, 2003, pp. 225-232.
14. S. Singhal and K. Kendall, “High-Temperature Solid Oxide Fuel Cells: Fundamentals, Design and Applications”, Elsevier Advanced Technology, Oxford, UK, 2003.
15. W. Weibull, “A statistical theory of the strength of materi- als”, IVB-Handl., 1939.
16. T. Hatae, Y. Matsuzaki, S. Yamashita, and Y. Yamazaki,
“Current density dependence of change in the micro- structure of SOFC anodes during electrochemical oxida- tion”, Solid State Ionics. Vol. 180, 2009, pp. 1305-1310.
17. J. M. Villora, P. Callejas, M. F. Barba, and C. Baudin,
“Statistical analysis of the fracture behavior of porous ce- ramic Rasching rings”, J. Eur. Ceram. Soc., Vol. 24, 2004, pp. 589-594.