• 검색 결과가 없습니다.

A Study on a Development of Automated Measurement Sensor for Forest Fire Surface Fuel Moistures

N/A
N/A
Protected

Academic year: 2021

Share "A Study on a Development of Automated Measurement Sensor for Forest Fire Surface Fuel Moistures"

Copied!
19
0
0

로드 중.... (전체 텍스트 보기)

전체 글

(1)

A Study on a Development of Automated Measurement Sensor for Forest Fire Surface Fuel Moistures 1 KOR APP

Chan-Ho YEOM 2 ⋅Si-Young LEE 2,† ⋅Houng-Sek PARK 3 ⋅Myoung-Soo WON 4

ABSTRACT

1)

In this study, an automated sensor to measure forest fire surface fuel moistures was developed to predict changes in the moisture content and risk of forest fire surface fuel, which was indicators of forest fire occurrence and spread risk. This measurement sensor was a method of automatically calculating the moisture content of forest fire surface fuel by electric resistance. The proxy of forest fire surface fuel used in this sensor is pine (50 cm long, 1.5 cm in diameter), and the relationship between moisture content and electrical resistance, R(R:Electrical resistance)

=2E(E:Exponent of 10)+13X(X:Moisture content)-9.705(R 2 =0.947) was developed. In addition, using this, the software and case of the automated measurement sensor for forest fire surface fuel moisture were designed to produce a prototype, and the suitability (R 2 =0.824) was confirmed by performing field monitoring verification in the forest. The results of this study would contribute to develop technologies that can predict the occurrence, spread and intensity of forest fires, and are expected to be used as basic data for advanced forest fire risk forecasting technologies.

Keywords: forest fires, forest fuel humidity, forest fire prediction, Surface fuel, electrical resistance

1. INTRODUCTION

The moisture content of forest fire surface fuel is an important factor that affects the occurrence and in- tensity of forest fires and the rate of spread. When the moisture content is high, the probability of occur- rence of forest fire decreases, whereas when the mois- ture content is low, the rate of occurrence of the fire is high. Thus moisture in forest fire surface fuel is an important factor affecting not only the occurrence of forest fires, but also their spread and intensity

(Kwon, 2009; 2014). Therefore, in the United States and Canada, there were studies on the relationship be- tween the moisture content of forest fire surface fuels and forest fires, and they tried to develop technologies to predict it (Anderson, 1983; 1990). In the United States and Canada, where research data on forest fires has been accumulated for a long time, various types of fuels in forests are classified, and the relationship between changes in moisture and weather has been an- alyzed and investigated. A forest fire risk forecasting system was developed based on the risk of ignition

1 Date Received July 28, 2020, Date Accepted November 6, 2020

2 Professional Graduate School of Disaster Prevention, Kangwon National University, Kangwon_Do, 25913, Republic of Korea

3 Graduate School of Forestry, Dongguk University, Seoul, 06420, Republic of Korea

4 Forest Resource Management and Restoration Division, National Institute of Forest Science, Seoul, 02455, Republic of Korea

† Corresponding author: Si-Young LEE (e-mail: [email protected], ORCID: 0000-0002-0643-5289)

Original Article

(2)

and spread (Stock, 1987; Van Wagner, 1975).

In Korea, the forest fire risk forecasting system was developed in 2003 and currently being operated by Korea Forest Service which has improved its accuracy through continuous improvement, but the underlying forest fire risk index was calculated by integrated anal- ysis of weather conditions, topography, and empirical data. As a result, unlike the cases in the United States and Canada, it does not properly reflect the character- istics of the change in the moisture content of forest fire surface fuel, which is an important factor in the occurrence and spread of forest fire. In this regard, according to Lee (2007; 2010) and Kwon (2011), the forest fire surface fuels that make up the indicators in the forest include leaves, litter, and ground shrubs etc., and their moisture content determines whether forest fire will spread or extinguish when it occurs.

The pine forest fuel (diameter less than 0.64 cm) among the forest fires that make up the indicators is very importantin estimating the spread of forest fire in the early stages, but it is not reflected in the forest fire forecasting system in Korea.

Due to the importance of the moisture content in the forest fire surface fuel, in the United States and Canada, a proxy for these fine forest fire fuel was es- tablished, and the proxy was designated as a forest fire fuel moisture stick which measured the change in moisture content of forest surface fire fuel, and this lead to a development of a system to predict the mois- ture change of fuelin the forest and forecastthe risk of forest fire. For example, the U.S. Forest Service has produced a standard forest fire fuel moisture stick and predicted the risk of forest fire occurrence and spread through the change in moisture content by measuring the change in weight (Theodore, 1965), and Forest fire moisture developed by Campbell Scientific, USA can be said to be an automated equipment using this concept. In Korea, there was a case in which this forest fire fuel moisture stick was used to forecast for-

est fires in terms of the changes in the weight of the forest fire fuel moisture stick due to the change in moisture content similar to the case of the United States. However, due to the lack of prior studies on the forest fire surface fuel and the lack of interest in automation technology, the forest fire fuel moisture is not used in the forest fire forecasting system in Korea.

However, like in the cases of the United States and Canada, as the change in moisture of the forest fire surface fuel plays an important role in the occurrence and spread of forest fires, it is necessary to introduce these technologies to improve the accuracy of forest fire forecasting systems currently in operation in Korea and to develop additional forest fire related systems. In addition, In case such a technology is in- troduced, its effect can be doubled only when auto- mated measurement technology is used in parallel.

There was no case in Korea in which the application of the technology was difficult because the automated measurement technology was not implemented.

Regarding the automated measurement sensor for predicting the risk of forest fires using the change in the moisture content of forest fire surface fuels, in the United States, measuring equipment using local spe- cies has been developed, but according to a study by William (1963), there wasa difference in the moisture content indicated by the resistance value depending on species, and accordingly, there is a possibility that the moisture content of forest fire fuels in domestic forest species may be underestimated or overestimated.

Therefore, in order to predict the moisture content of forest fire fuels in domestic forests, it wasnecessary to develop a technology that can automatically meas- ure the moisture content through experiments on do- mestic species.

In order to develop these technologies, the follow-

ing three things need to be analyzed. First of all, it

wasnecessary to select materials that could reflect the

domestic forest fire surface fuelenvironment, and de-

(3)

termine a measurement method that can measure the moisture change in the forest surface fire fuel, which can be measured continuously. In addition, it was nec- essary to know whether there was relationship be- tween the changes in the moisture content in the forest fire surface fuel and the forest fire related index.

This equipment issues could be resolved, if the ex- isting wood moisture content measurement equipment was used. However, since the moisture content of for- est fire fuels showed various patterns depending on the region, topography, forest and temperature (Han, 2019; Pang, 2019), samples were needed for each spe- cific region. In addition, long-term measurement and data accumulation were required to predict the risk of forest fires, and since measurements must be made within the forest to accurately measure forest fire fuels. In order to accurately measure moisture contents in forest fire surface fuels, it was necessary to measure it within the forest, but because an access and a power supply were limited, it was necessary to develop in- dependent equipment for this. Therefore, this study was conducted to develop an automated measurement sensor for forest fire surface fuel to predict changes in the moisture content and risk of forest fires, which was indicator of the occurrence and spread risk of for- est fires.

2. MATERIALS and METHODS 2.1. Materials and methods for measuring

moisture content in forest fire fuels 2.1.1. Selection of measurement methods In this study, the method of measuring the change of the moisture of wood was used instead of oven-dry- ing, extraction, or hygrometric method. Thismethod enables fast results but, not enable to continuous meas- urement without damaging the test subject. In addi- tion, with the electrical measurement method, there is

a resistance type measurement method that measures the moisture content by using the logarithm of the di- rect current and the specific resistance of wood in a linear relationship with the moisture content of wood, and another measurement method based on the fact that the Dielectric Permittivity of wood or the dielec- tric loss is in a Linear Relationship with the moisture content. The method of using Dielectric Permittivity has a measurement range of 0 to 30% and Kang Chunwon (2017) estimated Oven-Dry Density of wood using Dielectric Constant Type Moisture Meter, but the method using electric resistance was selected be- cause although the measurement range was 7 to 25%, it was possible to measure the range of risk of forest fire surface fuel and easy access to the electric resistor on site.

2.1.2. Selection of measuring materials For the selection of the materials, using the results in Yeom (2016), a rod shaped pine was selected with a diameter of 1.5 cm and length of 50 cm considering factors such as deformation, damage and stable amount of change in FMC (Fuel Moisture Content) of the measurement material for the fuel moisture measurement sensor.

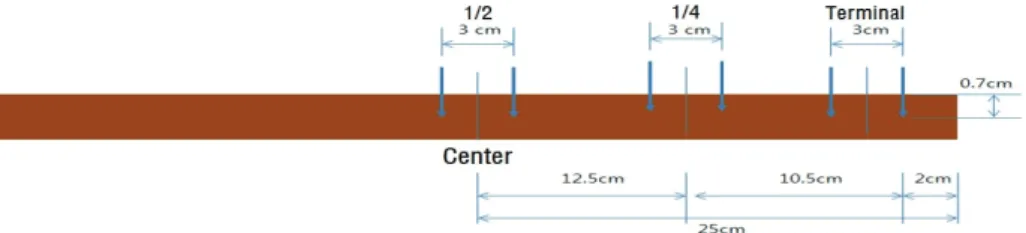
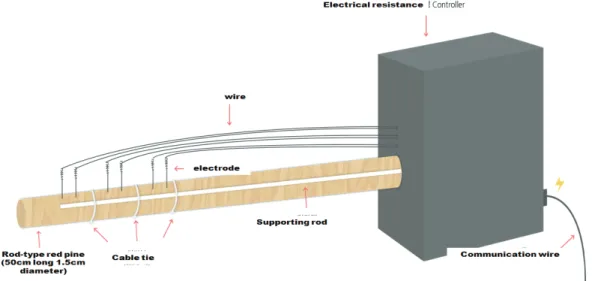
2.1.3. Production of measuring materials In order to measure the moisture content by elec- trical resistance, pointed electrodes must be inserted deeply to measure, and in this regard, the selection location and depth of the electrodes were determined by referring to the study of Lee (2005). The electrodes for measuring electric resistance, which was the meas- urement principle of measurement sensor for forest fire surface fuel moisture, were installed at one end, center, and 1/4 length point, respectively, and the end was installed from a point 2 cm away from the end, taking into account the space for electrode installation.

For the electrodes, they were made of steel and coated

(4)

Fig. 1. The standard of forest fire fuel proxy and the location of electrodes.

with chromium in order to protect them from rust as they would be exposed to air and moisture. The resist- ance of the electrode itself came out to a negligible level, and the both ends were coated with silicone in- sulation (NABAKEN's silicone insulation coating agent S-830) so that resistance could be measured at the electrode tip (Yeom, 2017). The following Fig. 1 shows the standard of forest fire fuel proxy and the location of electrodes.

2.1.4. On-site installation of forest fire fuel measuring materials

For the on-site installation of selected and elec- trode-equipped measuring materials for measuring the moisture content of forest fire fuels, they were in- stalled in Geombongsan AMOS (Automatic Meteoro- logical Observation System), which was installed and operated by Korea Forest Service, heliport AMOS and Samcheok AWS (Automatic Weather Station) currently operated by Korea Meteorological Administration.

For installation, it was installed 30 cm above the ground so that it would not be affected by the change in the weight and moisture due to foreign substances.

The equipment was installed according to Theodore (1965), as shown in Fig. 2.

2.2 Measurement procedure and period

In this study, it was necessary to establish the rela- tionship between the change in the moisture content and the electrical resistance in forest fire surface fuels.

To do that, the change in electrical resistance and weight of forest fire surface fuel was investigated in parallel. Since Stamm (1927) first proposed a method for measuring moisture content using electrical resist- ance, many researchers have analyzed the relationship between electrical resistance and wood moisture con- tent (Keane, 2015). However, thereare few studies on domestic species, particularly, on moisture content of 17% or less, which have a high risk of forest fire.

Thus, this study focused on this particular section to analyze the relationship involving moisture changes in an actual forest.

The measurement period was in spring (April) to

monitor the Geombongsan AMOS and heliport AMOS

operated by the Korea Forest Service. In fall (Septem-

ber), the measurement was taken at Samcheok 876

AWS which is operated by Korea Meteorological Ad-

ministration by using high voltage insulation/megameter

(Model: SM-8220) with total measurement number of

1,872 times; 3 times a day (3 repetition per 1 measure-

Fig. 2. An installed forest fire fuel proxy.

(5)

ment) at 1000, 1400 and 1600, respectively. Table 1 is the measurement period and location.

2.2.1. Electrical resistance meter

The electrical meter selected in this study was HIOKI's high voltage insulation/megameter (Model:

SM-8220). This equipment is capable of measuring from 5×10 4 ∼ 2×10 14 Ω which covers the target range of the pine wood rod’s electrical resistance, and meas- ured voltages of 10 V and 25 V were selected. Fig.

3 is a picture of the selected equipment.

To measure the electrical resistance, the reference voltage was measured by selecting voltages of 10 V and 25 V. The reason was that when installed in the AMOS of the weather network in the forest in the fu- ture, the AMOS would be powered by solar power, so the minimum voltage was selected in consideration of the environment in which the available power would be limited.

Fig. 3. The electrical resistance meter (HIOKI, SM- 8220).

2.2.2. Moisture content (Weight) measuring equipment

Oven-dry method was used after weighing the weight of the moisture content of the forest fire fuel, and an electronic scale (Model name: JW-1) of ACOM was used for weighing the proxy on-site; the scale can measure between 0-2,000 g with minimum unit of measurement of 0.1 g.

3. RESULTS and DISCUSSION 3.1. Relationship between moisture

content and electrical resistance in forest fire fuel

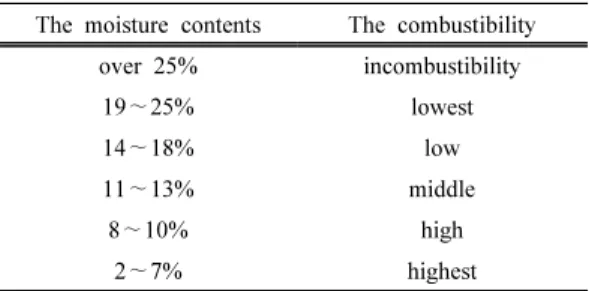
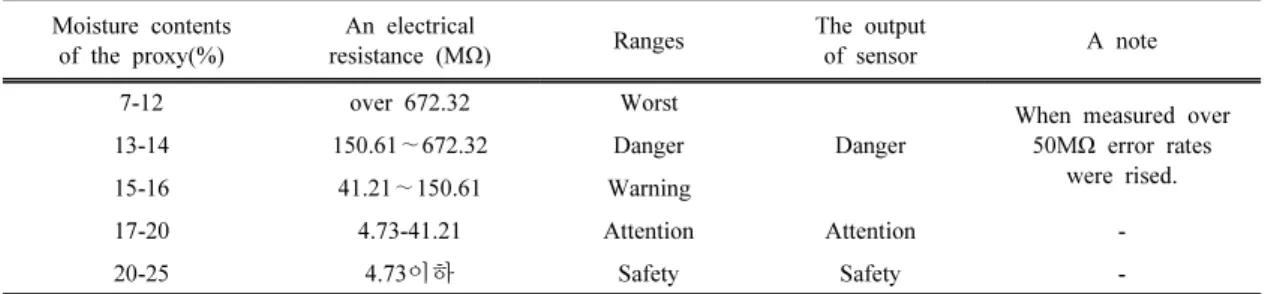
In order to develop equipmentthat predicts risk of forest fire by measuring the moisture content of forest fire fuel, which is the objective of this study, an analy- sis was conducted based on the classification of com- bustibility according to the moisture content of sedi- ments in the forest. Table 2 shows the classification of moisture content and combustibility of sediment in the forest.

The moisture contents The combustibility over 25% incombustibility

19 ∼25% lowest

14 ∼18% low

11 ∼13% middle

8 ∼10% high

2 ∼7% highest

Table 2. The relationship with the moisture of forest sediments and the combustibility

※ A reference: Forestry technique

3.1.1. Electrical resistance measurement result (10 V, 25 V)

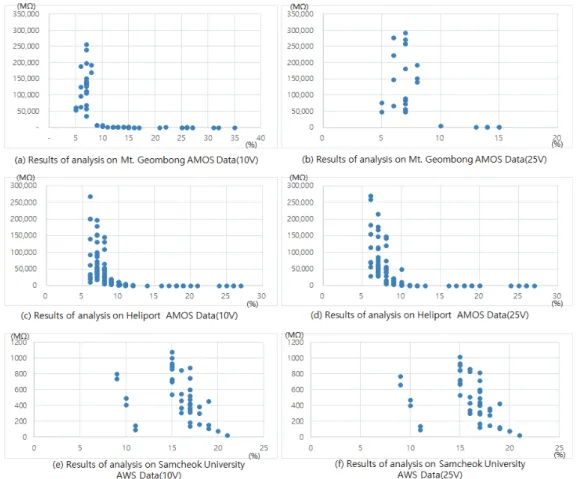
The measurements of the relationship between the electrical resistance and the moisture content in the forest fire surface fuel are shown in Fig. 4. As a result The period The Location

2017.4.3 ∼ 4.13 Mt. Geombong AMOS

2017.4.3 ∼ 4.28 Heliport AMOS

2017.9.12 ∼ 9.22 Samcheok University(876) AWS

Table 1. The period and the location of experiments

(6)

Fig. 4. The results of analysis of the relationships with forest fire fuel moisture contents and electrical resistances.

of the analysis, a conversion formula [electrical resist- ance = 2E+13(moisture content)-9.705] was derived (Yeom, 2018). According with this electric resistance conversion formula, the moisture content of the forest fire fuel was measured, which is the technology this study intends to develop. Then, to derive the forest fire risk, the electrical resistance values were analyzed according to the flammability classification that is based on the moisture content of forest fire surface fuel. As a result, the measured electrical resistance of 10V showed a distribution of resistance values of 376M Ω to 269,734MΩ at a moisture content of 2 to 7%, classified as ‘highest combustibility’, and the average resistance was 96,489M Ω. The distribution of

resistance values of 409M Ω to 192,3501MΩ was ob- served in the moisture content of 8-10%, which is the

‘high level’ category, and the average resistance was measured to be 28,820M Ω. In addition, the dis- tribution of 89 M Ω to 4,923 MΩ was shown in the moisture content of 11 to 13%, which is the ‘middle’

category, and the average resistance value was meas- ured to be 752 M Ω, and the distribution of 7 MΩ to 1,075 M Ω in the moisture content of 14 to 18%, which is the ‘low’ category, and the average resistance was measured to be 418M Ω. The distribution of 1M Ω to 458MΩ was found at a moisture content of 19%

or higher, which is classified as “lowest” to “incom-

bustibility,” and the average resistance was measured

(7)

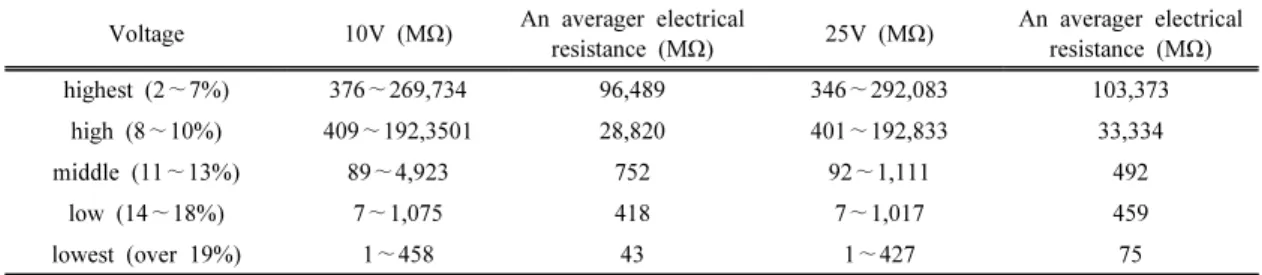
Voltage 10V (MΩ) An averager electrical

resistance (MΩ) 25V (MΩ) An averager electrical resistance (MΩ)

highest (2 ∼7%) 376 ∼269,734 96,489 346 ∼292,083 103,373

high (8 ∼10%) 409 ∼192,3501 28,820 401 ∼192,833 33,334

middle (11 ∼13%) 89 ∼4,923 752 92 ∼1,111 492

low (14 ∼18%) 7 ∼1,075 418 7 ∼1,017 459

lowest (over 19%) 1 ∼458 43 1 ∼427 75

Table 3. The results of an electrical resistance measurement according to voltage (10V, 25V)

to be 43M Ω.

The measured electrical resistance of 25V showed a resistance distribution of 346 M Ω to 292,083 MΩ at a moisture content of 2 to 7% classified as ‘highest combustibility’, and the average resistance was 103,373 M Ω. The resistance value distribution was measured to be 401M Ω to 192,833MΩ at a moisture content of 8 to 10%, which is classified as ‘high’, and the average resistance value was measured to be 33,334M Ω. In addition, the distribution of 92 MΩ to 1,111 M Ω at the moisture content of 11 to 13%, which is the ‘middle’ category, and the average resistance value was measured to be 492 M Ω, and the distribution of 7 M Ω to 1,017 MΩ in the moisture content of 14 to 18%, which is the ‘low’ category. And the average resistance was measured to be 459 M Ω. A distribution of 1 Ω∼427MΩ was shown at a moisture content of 19% or higher, which is classified as “lowest” to

“incombustibility,” and the average resistance was measured to be 75M Ω. Table 3 below is the result of classifying electrical resistance according to incom- bustibility. In addition, in consideration of the environ- ment in which the resulting measurement materials of this study can actually be installed, it is necessary to set the voltage value for measuring the electrical re- sistance to be used for the actual moisture content measurement, so the currently investigated 10 V and 20 V environments were analyzed. The results are shown in Fig. 5. As a result of comparing the voltages of 10 V and 25 V to select the voltage given when

Fig. 5. The relationships with moisture contents in forest fire fuel and electrical resistances of forest fire fuel according to voltage changes (10 V and 20 V).

measuring resistance, the measured values of electrical resistance of 10 V and 25 V have similar slopes, and when considering the electrical facilities and environ- mental factors of the installation site, 10 V would not have any issues. Since the mountain weather observation network is currently operated by solar power, the fuel moisture must be measured with a lowest voltage.

Therefore, the measurement voltage for the equipment to be developed in this study was selected to be 10 V.

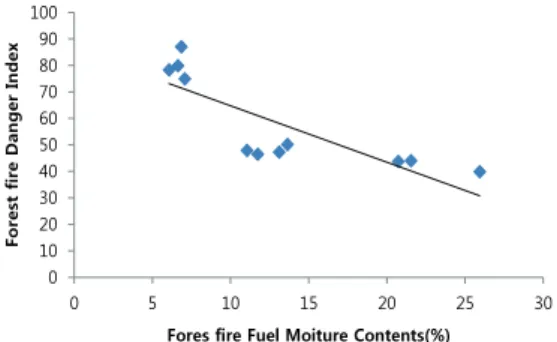
3.1.2. Verification of Forest fire fuel moisture estimated by electrical resistance The verification of the forest fire fuel moisture mea- sured by the change in electrical resistance was ana- lyzed by its correlation with the Forest Fire Danger Index of Korea Forest Service currently in operation.

As a result of applying the forest fire risk index of

the National Institute of Forest Science (NIFoS), the

average of the forest fire risk index in Wondeok-eup,

(8)

Samcheok-si, during the spring fire warning period was 47.11, which was a ‘low’ grade, and the maximum value was 87.50 (at 1300 and 1500 on April 4) and the minimum value was 20.70. The correlation between the forest fire fuel moisture (Gumbongsan AMOS, heli- port AMOS, pine forest on campus at Kangwon Natio- nal University Samcheok Campus) and the forest fire risk index (Wondeok-eup, Gyo-dong, Samcheok-si) investigated in this study is shown in Fig. 6. As a re- sult of the analysis, there was a negative correlation with 99% confidence level (R 2 =0.824). Therefore, the forest fire fuel moisturemeasured at the Geombongsan AMOS and the Heliport AMOS during the spring fire warning period and the forest fire fuel moisture meas- ured at the pine forest within Kangwon National Uni-

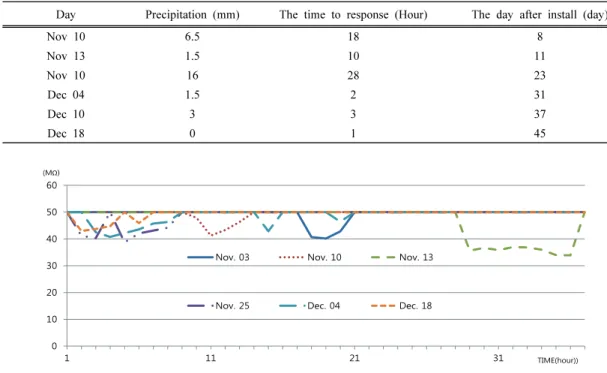
versity Samcheok Campus during the forest fire warn- ing period in the fall had a significant correlation with the forest fire risk index of the region (Wondeok-eup, Samcheok-si, Gyo-dong, Samcheok-si). This can be interpreted as having a correlation with the prediction of forest fire occurrence, which is the result of this study, and serve as basic data that can supplement the forest fire risk index in the future. In addition, the re- sults of direct comparison on whether the measured data of forest fuel moisture is related to hourly or daily changes in the actual forest fire risk index are shown in Fig. 7, Fig. 8, and Fig. 9. According to these results, the measured forest fire fuel moisture in the forest re- sponded similarly to the forest fire risk index of Korea Forest Service.

Fuel Moisture Contents (%)

5 10 15 20 25 30

F o res t F ire D a n ger I n dex

0 20 40 60 80 100

Fig. 6. The correlation with measured forest fire fuel moisture contents and forest fire danger indices.

0 10 20 30 40 50 60 70 80 90 100

0 5 10 15 20 25 30

For est fire Dan ger In dex

Fores fire Fuel Moiture Contents(%)

Fig. 7. The relationship between changes of moisture contents in forest fire fuel and the forest fire danger indices on Geombong mountain AMOS.

0 10 20 30 40 50 60 70 80 90 100

0 5 10 15 20 25 30

F o re st fire Da n g er I n d e x

Fores fire Fuel Moiture Contents(%)

Fig. 8. The relationship between changes of moisture contents in forest fire fuel and the forest fire danger indices on Sam-Cheok university AWS.

0 10 20 30 40 50 60 70 80 90 100

0 5 10 15 20 25 30

Forest fire D a ng e r Index

Fores fire Fuel Moiture Contents(%)

Fig. 9. The relationship between changes of moisture

contents in forest fire fuel and the forest fire danger

indices on Heliport AMOS.

(9)

3.2. Development of Automated Measurement Sensor for Forest Fire Surface Fuel Moistures

A prototype was developed based on the measure- ment results of electrical resistance for each voltage for automated measurement of forest fire surface fuel moisture. Fig. 10, Fig. 11. Fig. 12 and Fig. 13 show the process of manufacturing a prototype of an auto- mated sensor for measuring forest fire fuel moisture.

For the design of the case, first of all, the sensor must be placed 30 cm above from the ground so that it can be easily installed in the weather network in the forest,

and since it’s going to be exposed in the forest, the case was manufactured with water and dustproof fea- tures. In addition, the prototype of automated forest fire surface fuel moisture sensor measures at every hour to obtain reliable resistance values, and atend, 1/4 location, and 1/2 location, in that order, to reduce elec- trical resistance measurement errors. Also, the conver- sion formula [electrical resistance = 2E+13 (moisture content)-9.705)] (Yeom, 2018) was used in the model to estimate the moisture content for electrical resis- tance. The device was designed to measure 10 times for each part at 5-second intervals, and then output

Fig. 10. The prototype of automated forest fire fuel moisture sensor.

Fig. 11. The blueprint of case.

Fig. 12. The produced substrate in case.

(10)

Fig. 13. The prototype.

Fig. 14. The installed sensor in National institute of forest science.

Moisture contents of the proxy(%)

An electrical

resistance (MΩ) Ranges The output

of sensor A note

7-12 over 672.32 Worst

Danger

When measured over 50MΩ error rates

were rised.

13-14 150.61 ∼672.32 Danger

15-16 41.21 ∼150.61 Warning

17-20 4.73-41.21 Attention Attention -

20-25 4.73 이하 Safety Safety -

Table 4. The decision of threshold for an automated forest fire fuel moisture sensor

the average value which was calculated after the max- imum and minimum values were discarded. In addi- tion, for future linkage with the forecast system, a for- est fire risk threshold was set and used for this output.

For this, the range and threshold of forest fire risk were set (Table 4) based onthe ‘A Study on the Analysis of Forest Fire Hazards and Combustion Expansion Factors’ by Lee (1995). However, due to the limited time and cost associated with manufacturing the proto- type performed in this study, the development of a prototype capable of stably measuring resistance at high resistance was not reached, but a board that can measure the resistance value under 50 MΩ with stabil- ity and accuracy was developed. Therefore, for the ap- plication of the sensor proposed in this study, the soft- ware was designed so that when the forest fire fuel moisture is 16% (41.21 MΩ) or higher, the risk of for- est fire would come out as “dangerous.”. Table 4

shows the threshold value of the sensor for automated measurement of forest fire surface fuel moisture, and Fig. 14 shows a picture of the sensor installed at the National Institute of Forest Science in Hongneung, Seoul.

3.3. Automated prototype monitoring results

3.3.1. Monitoring results of prototypes installed

by National Institute of Forest Science

For verification of the prototype produced in this

study, the prototype was installed at the automatic

weather station in Hongneung Forest within the National

Institute of Forest Science and measured changes from

November 3, 2017 to December 20, 2017 which are

shown in Fig. 15. In other words, there were a total

of 7 precipitations during the monitoring period, and

the analysis showed that the prototype responded to

(11)

Fig. 15. The results of automated sensor output analysis in National institute of forest science.

the events. However, due to the limitation of the equip- ment that values more than 50 MΩ can’t be measured, the changes below that moisture content (less than 15%) can’t be measured. For this, additional improve- ment in the equipment is necessary.

3.3.2. Relationship between precipitation and sensor response sensitivity

For monitoring of forest fire fuel moisture measure- ment sensor, from November 3, 2017 to December 20, 2017, there were a total of 7 precipitations based on the monitoring results of the installation at the auto- matic weather station in the forest in Hongneung, and the electrical resistance values changed accordingly which are shown in Table 5, Fig. 16, and Fig. 17.

Based on the analysis, the change (decrease) of the resistance value increases as the precipitation in- creases, and the moisture content increases as the

Day Precipitation (mm)

Electrical Resistance (MΩ)

Nov 10 6.5 9.85

Nov 13 1.5 8.74

Nov 25 16 16.14

Dec 04 1.5 12.87

Dec 10 3 9.25

Dec 18 0 7.04

Table 5. The relation with precipitation and variations of electrical resistance

precipitation increases, and the sensor detects the change in the moisture content according to the change in precipitation. However, since the number of the

Fig. 16. The relationship between precipitation(mm) and variations of electrical resistance(M Ω) in National institute of forest science(Korea Meteorological Admi- nistration data).

Fig. 17. The relationship between precipitation(mm)

and variations of electrical resistance(M Ω) in National

institute of forest science.(Mountain weather infor-

mation system data).

(12)

Day Precipitation (mm) The time to response (Hour) The day after install (day)

Nov 10 6.5 18 8

Nov 13 1.5 10 11

Nov 10 16 28 23

Dec 04 1.5 2 31

Dec 10 3 3 37

Dec 18 0 1 45

Table 6. The results of analysis on response times according to precipitaion

0 10 20 30 40 50 60

1 11 21 31

Nov. 03 Nov. 10 Nov. 13

Nov. 25 Dec. 04 Dec. 18

TIME(hour)) (MΩ)

Fig. 18. The changes of electrical resistance after precipitation.

event (7 precipitations) was small, it seems that addi- tional long-term monitoring was necessary.

3.3.3. Relationship between precipitation and sensor response time

For monitoring of the forest fire fuel moisture meas- urement sensor, from November 3, 2017 to December 20, 2017, there were a total of 7 precipitations based on the monitoring result of the installation at the auto- matic weather station in Hongneung Forest and the time taken until the change in electrical resistance of the sensor occurred was measured and analyzed. This was judged to be an important factor in terms of how well the change of moisture content according to pre- cipitation was detected and analyzed. Table 6 and Fig.

18 are the analysis results of the response time accord- ing to the precipitation, at the initial monitoring value, the sensor's response occurred after 10 hours, but after 30 days of installation, the response time were 3 hours

and 1 hour, respectively. Thus, it was analyzed that the change in moisture content was measured immedi- ately after precipitation.

In this regard, Micheael (1983) investigated that the forest fire fuel moisture stick measured the change in moisture when exposed to the natural environment, and the weight decreases over time. Therefore, it is assumed that the time in moisture content change var- ies according to the change in density of the forest fire fuel moisture stick over time. Therefore, additional research seems to be needed for this.

4. CONCLUSION

This study was conducted to develop an automated

measurement sensor for forest firesurface fuel mois-

ture to predict changes in the moisture content and risk

of forest fire, which are indicators of forest fire occur-

(13)

rence and spread risk. The results showed thatthis measurement sensor is a method of automatically cal- culating the moisture content of forest fire fuel by measuring the moisture content of the fuel using elec- trical resistance. The forest fire fuel used in this sensor was pine (50 cm long, 1.5 cm in diameter), and elec- trical resistance that estimated the relationship be- tween moisture content and electrical resistance=2E (E:Exponent of 10)+13X(X:Moisture content)-9.705 (R 2 =0.947) was developed. In addition, using this, a prototype was produced by designing the software and case forthe automated measurement sensor for forest fire surface fuel moisture, and the suitability (R 2 = 0.824) was confirmed by performing field monitoring verification in the forest. In addition, after analyzing the relationship between the precipitation and the sen- sor's response sensitivity, the sensor detected the change in moisture content according to the change in precip- itation, and it was determined that additional long-term monitoring was necessary. Due to the limitation that the measurement sensor cannot measure a value of 50 MΩ or more, further improvement of the measurement sensor was necessary to measure the change value of the moisture content (15% or less) less than this.

Finally, the results of this study are expected to be helpful in the development of technology that can pre- dict the occurrence, spread rate and intensity of forest fires, and are expected to be used as basic data for the advancement of forest fire risk forecasting technology.

ACKNOWLEDGMENT

This study is funded by the National Institute of Forest Science in 2017 and a research conducted with funding from the government (Ministry of Science and ICT) in 2020 (No.2018-0-01456, Intelligence- based ultra-small Disposable IoT dynamic autonomous con- figuration and execution infrastructure technology).

REFERENCES

Anderson, H.E. 1983. Predicting wind-driven wild land fire size and shape. Research Paper INT-RP-305.

Ogden, UT: USDA Forest Service, Intermountain Forest and Range Experiment Station. p.26.

Anderson, H.E. 1990. Moisture diffusivity and response time in fire forest fuels. Canadian Journal of Forest Research. pp.315-325.

Kang, C.W., Lim, H.M., Kang, H.Y. 2017. Estimation of Wood Oven-Dry Density by Using a Portable Dielectric Moisture Meter, Journal of the Korean Wood Science and. Technology 45(5): 629-639.

Keane, R.E. 2015. Wildland fuel fundamentals and applications. Springer International Publishing Switzerland. DoI 10.1007/978-3-319-09015-3_9.

pp.153-154.

Kwon, C.G., Lee, S.Y., Lee, H.P., Cha, J.Y. 2011.

Comparison of Surface Fuel Moisture after Rainfall in Pine Tree Forests during Spring/Autumn Season in Young Dong Region (Case Study on Surface Fuel and Soil Layer Moisture). Journal of Korean Society of Hazard Mitigation 11(6): 157-166.

Kwon, C.G. 2009. A Study on the Forecast of Fuel Moisture Contents's Changes in the Pine Tree Forest after Rainfall. Master's thesis. Kangwon National University.

Kwon, C.G. 2014. A Study on Development of a Forest Fuel Moisture Content Change Prediction Model(Focus on Predicting Forest Fire Dangers).

Ph.D. Dissertation. Kangwon National University.

Lee, C.H. 2005. Actual- and predicted drying curve and moisture profile during air drying of softwood square. Master's thesis. Seoul National University.

Lee, S.Y. 1995. Estimation on forest Fire Danger rating and factors affecting burning behavior. Ph.D. thesis.

Dongguk University.

Lee, S.Y., Kwon, C.G., Lee, M.W., Lee, H.P. 2010.

Development of Prediction Model of Fuel Moisture

(14)

Changes after Precipitation in the Spring for the Pine Forest Located the Yeongdong Region : Focused on the Down Wood Material Diameter.

Transactions of Korean Institute of Fire Science and Engineering. pp.18-26.

Lee, S.Y., Chae, H.M., Lee, M.W., Kwon, C.G., Yeom, C.H. 2007. Prediction of Fuel Moisture Contents after Precipitation in the Pine Tree Stand during Forest Fire Period in the East Sea Region. Tran- sactions of Korean Institute of Fire Science and Engineering. pp.464-467.

Harrington, M.G. 1983. Climate Class Adjustments Imporve Accuracy of Predicted Fuel Moisture Stick Value. USDA Forest service Research Note RM- 431.

Stock, B.J., Alexander, M.E., Lawson, B.D., Van Wanger, C.E. 1987. Canadian Forest Fire Danger Rating System. User' Guide. The Canadian Forest Service Fire Danger Group.

Pang, S.J., Jeong, G.Y. 2019. Effects of Density, Tem- perature, Size, Grain Angle of Wood, Materials on Nondestructive Moisture Meters, Journal of the Korean Wood Science and Technology 47(1):

40-50

Zahn, S., Henson, C. 2011. Fuel moisture Collection Methods: A Field Guide. U.S. Department of

Agriculture. pp.1-11

Storey, T.G. 1965. Estimating the Fuel Moisture Con- tent of Indicator Sticks from Selected Weather Variables. U. S. FOREST SERVICE RESEARCH PAPER PSW-26. pp.1-14

Van Wagner, C.E. 1975. Comparison of the Canadian and American forest fire danger rating systems.

Petawawa forest experiment station Chalk river.

Ontario Information report PS-X-59.

Han, Y.J., Eom, C.D., Lee, S.M., Park, Y.G. 2019.

Moisture Content Change of Korean Red Pine Logs During Air Drying: I. Effective Air Drying Days in Major Regions in Korea, Journal of the Korean Wood Science and Technology 47(6): 721-731.

Yeom, C.H., Lee, S.Y., Park, H.S. 2016. A Comparative Analysis of Fuel Moisture Contents Variation by Pinus densiflora & Quercus variabilis Stick for Estimating Fuel Moisture Contents in Forest Fire Surface Fuel in the Spring. Crisisonomy 12(12):

59-67.

Yeom, C.H., Won, M.S., Lee, S.Y., Yoon, S.H., Park, H.S. 2018. A Study on Estimation of Forest Fire Surface Fuel Moisture using Electrical Resistance.

Journal of the Korean Society of Hazard Mitigation

18(4): 175-181.

(15)

APPENDIX

(Korean Version)

산불연료습도 자동화 측정센서 개발에 관한 연구

초록 : 본 연구는 산불의 발생과 확산위험성의 지표인 산불연료의 수분함량과 산불위험도의 변화를 예측하기 위한 산불연료습 도 자동화 측정센서를 개발하였다. 이 측정센서는 산불연료의 함수율을 전기저항으로 측정하여 자동으로 산불연료의 함수율을 산정하는 방법이다. 이 센서에 사용된 산불연료는 소나무(길이 50cm, 직경 1.5cm)이고, 함수율과 전기저항과의 관계를 추정하는 전기저항=2E(E:Exponent of 10)+13X(X:함수율)-9.705(R 2 =0.947)인 환산식을 개발하였다. 또한, 이를 이용하여 자동화된 산 불연료습도 자동화 측정센서의 소프트웨어와 함체를 설계하여 시제품을 제작하였고, 이를 다시 산림 내에서 현장 모니터링 검증을 실시하여 적합성(R 2 =0.824) 을 확인하였다. 본 연구결과는 산불의 발생, 확산과 강도를 예측할 수 있는 기술의 개발에 도움을 주며, 산불위험예보 기술의 고도화를 위한 기초자료로 활용될 것으로 기대된다.

1. 서 론

산불연료의 수분 함량은 산불의 발생 및 강도 그리고 확산속도에 영향을 미치게 되는 중요한 인자로서 수분함량이 높은 경우 산불발생확률이 낮아지는 반면, 수분함량이 낮을 경우 산불 발생률이 높게 나타나는 것이 일반적인 특징이다. 이러한 산불연료 내의 수분은 산불의 발생뿐만이 아니라 확산, 강도에 영향을 미치는 중요한 요소이기도 하다(Kwon, 2009, 2014).

따라서, 미국과 캐나다에서는 산림 내 연료의 수분함량과 산불과의 관계성을 연구하고, 이를 예측하는 기술을 개발하려고 노력하였다(Anderson, 1983, 1990). 산불에 대해 오랜 기간 연구 자료가 축적된 미국과 캐나다에서는 산림 내 연료를 다양하게 구분하고 그 수분의 변화와 기상과의 관계성을 분석 및 구명한 후 이를 근거로 기상 조건과 다양한 산림 내 연료의 산불 발화와 확산 위험성에 근거하여 산불위험예보시스템을 개발하였다(Stock, 1987; Van Wagner, 1975).

우리나라의 경우 2003년도에 개발되어 현재 산림청에서 운영 중인, 산불위험예보시스템은 지속적인 개선을 통해 정확도가 향상되었으나, 기초가 되는 산불위험지수는 기상조건과 지형, 임상 조건을 통합 분석하여 산출된 결과이기에, 미국과 캐나다의 사례와는 달리, 산불발생과 확산의 중요한 인자가 되는 산불연료의 수분함량 변화의 특성을 제대로 반영하지 못하고 있다.

이와 관련하여, Lee (2007, 2010)과 Kwon (2011)의 연구결과에 의하면, 산림에 있어서 지표를 구성하고 있는 산불연료는 낙엽, 낙지, 지피물 등이 있으며, 이들의 수분함량에 따라서 산불발생 시 확대 또는 소멸 될 것인가 결정되며, 이들 지표를 구성하고 있는 산불연료 중 미세산불연료(fine forest fuel-직경 0.64 cm 이하)는 초기 산불의 확산을 추정하는데 상당히 중요하 다고 하였으나, 실제 산불위험예보시스템에 반영되지 않고 있는 실정이다.

이러한 산불연료 내 수분함량의 중요성 때문에, 미국과 캐나다에서는 이러한 미세산불연료의 대치자(proxy)를 설정하고, 그 대치자를 산불연료습도 측정봉(Forest fire fuel moisture stick)이라 명칭을 정하고, 그 수분변화를 측정함으로써, 산림 내 연료의 수분변화를 예측하고, 산불위험을 예보하는 시스템을 개발하였다. 일례로, 미국 산림청에서는 기준이 되는 산불연료습도 측정봉(Forest fire fuel moisture stick)을 제작하여, 중량변화의 측정에 의해 함수율의 변화를 통해 산불발생 및 확산의 위험성을 예측해 왔으며(Theodore, 1965), 미국 Campbell Scientific에서 개발한 Forest fire moisture은 이러한 개념을 이용하여 자동화한 장비라고 할 수 있다.

우리나라의 경우도 이러한 산불연료습도 측정봉(Forest fire fuel moisture stick)을 이용하여, 미국의 사례와 같이 수분함량의 변화에 의한 연료습도 측정봉의 중량 변화를 사용하여, 산불예보를 실용화한 사례가 있었다. 하지만, 산불연료습도에 대한 사전 연구의 부족과 자동화기술에 대한 관심부족으로 현재, 국내에서 예보중인 산불예보시스템에서는 산불연료의 습도를 적용 되지 않고 있다.

하지만, 미국과 캐나다의 사례에서와 같이 산불연료습도의 수분 변화는 산불의 발생과 확산에 중요한 역할을 하는 만큼, 국내에서 운용중인 산불예보시스템의 정확도 향상과 추가적인 산불관련 시스템의 개발을 위해서는, 이러한 기술의 대한 도입이 필요하다고 하겠다.

또한, 이러한 기술의 도입은 자동화된 측정 기술이 병행되어야 그 효과가 배가된다고 하겠다. 실제 과거 국내 사례에서

자동화된 측정 기술이 적용이 되지 않아, 기술의 적용에 어려움을 겪었던 사례가 있다.

(16)

산불연료의 수분함량의 변화를 이용한 산불의 위험도예측의 자동화 측정센서와 관련하여, 미국에서는 자국의 수종을 이용한 측정 장비가 개발되어 있으나, William (1963)의 연구에 의하면, 수종에 따라, 전기저항 값이 나타내는 함수율에서 차이가 있는 것으로 보고하고 있으며, 이에 따라, 국내 산림 수종의 산불연료의 수분함량을 과소 혹은 과대평가할 가능성이 있다.

따라서, 국내 산림 내 산불연료의 수분함량을 예측하기 위해서는, 우선적으로 국내의 수종에 대한 실험을 통해, 수분함량을 자동적으로 측정할 수 있는 기술의 개발이 필요하다.

이러한 기술 개발을 위해, 우선, 국내의 산불연료 환경을 반영할 수 있는 재료의 선정과 지속적으로 측정이 가능한 산불연료 내의 수분변화를 측정할 수 있는 측정방법의 결정, 그리고 이러한 산불연료 내 수분함량의 변화가 산불관련 지수와 관계성이 있는지 분석할 필요가 있다.

이러한 장비는 기존의 목재 함수율 측정장비를 이용하여, 측정하면 간단히 해결될 수 있는 문제로 볼 수 있으나, 산불연료의 수분량은 지역, 지형, 산림 및 온도에 따라 다양한 양상을 보이고 있어(Han, 2019; Pang, 2019), 특정지역 별로 조사 샘플이 필요하다. 또한, 산불의 위험성을 예측하기 위해서는 장기적인 측정과 자료의 축적이 필요하며, 산불연료의 정확한 측정을 위해서는 산림 내에서 측정을 해야 함으로, 접근성과 전원 공급의 제약이 있어, 이를 위한 독자적인 장비의 개발이 필요하다, 따라서, 본 연구는 산불의 발생과 확산 위험성의 지표인 산불연료의 수분함량과 산불위험도의 변화를 예측하기 위한 자동화된 산불연료습도 측정센서를 개발하고자 수행하였다.

2. 재료 및 방법

2.1. 산림 연료 내 수분량 측정을 위한 재료와 방법 2.1.1. 측정방법의 선택

본 연구에서는 전건법, 추출법, 습도법이 아닌 목재의 전기적 성질의 변화를 측정하는 방법을 사용하였다. 즉, 이 방법은 측정 대상물이 손상하지 않으면서, 신속한 결과와 지속적인 측정이 가능하기 때문이다. 또한, 이러한 전기적 측정 방법으로 목재의 직류, 비저항의 대수가 목재의 함수율과 선형관계에 있는 것을 이용하여 함수율을 측정하는 저항식 측정방식이 있고, 목재의 유전율(Dielectric Permittivity) 혹은 유전 손실이 함수율과 선형관계(Linear Relationship)에 있는 것에 착안한 측정 방식이 있다. 이중 유전율을 이용한 방식은 측정범위가 0∼30%이고, Kang (2017)은 이러한 유전율 수분계(Dielectric Constant Type Moisture Meter) 를 이용하여 목재의 전건 밀도를 추정한 사례가 있으나, 이에 반해 전기저항을 이용하는 방식은 측정범위 가 7∼25%이지만, 산불연료의 위험도가 나타나는 범위에 대해 측정이 가능하고, 전기 저항계의 현장 접근이 용이하여 이 방법으로 결정하였다.

2.1.2. 측정재료의 선정

측정재료의 선정은 Yeom (2016)의 연구결과를 참조하여, 연료습도 측정센서 공시재료의 FMC (FMC, Fuel Moisture Content) 변화량이 안정적이고, 변형 및 파손 등을 고려하여 소나무 재질의 직경 1.5 cm, 길이 50 cm의 환봉형태를 선정하였다.

2.1.3. 측정재료의 제작

전기 저항에 의한 수분의 측정방식으로 수분량 측정 방법을 시행하기 위해서는 뾰족한 전극을 깊게 삽입하여, 측정을 해야 하며, 이와 관련하여 Lee (2004)의 연구를 참조하여 전극의 선정 위치와 깊이를 결정하였다. 산불연료수분 측정센서의 측정 원리인 전기 저항 측정을 위한 전극은 한쪽 끝, 중앙, 1/4 지점에 각각 설치하였는데, 끝단은 전극 설치의 공간을 감안하여, 끝에서 2 cm가 떨어진 지점에서부터 설치하였다. 설치 전극은 일반 강철로 제작된 못을 설치하였으며, 공기와 수분 중에 노출되는 환경으로 인해, 녹이 쉽게 슬 수 있을 것을 우려하여, 크롬으로 코팅된 못을 전극으로 사용하였다. 전극 자체의 저항은 무시할 수준으로 적게 나왔으며, 전극 끝부분에서 저항을 측정할 수 있도록 양 끝단을 제외하고는 실리콘 절연제(NABAKEN 사의 실리콘 절연 코팅제 S-830)를 사용하여 코팅하였다(Yeom, 2017). 다음 Fig. 1은 산불연료 수분량 측정 재료의 규격과 전극 설치 위치이다.

2.1.4. 측정재료의 현장설치

선정되어 전극이 장착된 산불연료 수분량 측정재료의 현장 설치를 위해, 현재 국립산림과학원에서 운영되고 산악기상관측시

(17)

스템(AMOS: Automatic Meteorological Observation System)이 설치된 장소인 삼척지역의 검봉산 AMOS와 헬기장 AMOS, 그리고, 기상청에서 운영하는 AWS(AWS, Automatic Weather Station)인 삼척 AWS 장비가 있는 곳에 설치하였다. 설치 시 이물질에 의한 습도변화 무게변화에 영향을 받지 않도록 지상에서 상향 30 cm 이격시켜 설치하였다. 설치장치는 Theodore (1965) 의 연구를 참조하여 설치하였으며, 다음 Fig. 2와 같다.

2.2. 측정절차 및 기간

본 연구에서는 산불연료 내 수분함량의 변화와 전기저항과의 관계에 대한 정립이 필요하며, 이를 위해, 산불연료의 전기저항 과 중량의 변화를 병행하여, 관계성을 정립하려 하였다. 이러한 관계성에 대한 연구는 Stamm (1927)이 최초로 전기저항을 이용하여 함수율 측정방법을 제시한 이래 많은 연구자들이 전기저항과 목재 함수율의 관계를 분석하였으나(Keane, 2015), 국내 수종에 대한 연구는 미비하며, 특히 산불이 발생할 위험이 높은 함수율 17% 이하의 함수율을 대상으로 세밀한 연구 결과가 미비하기에, 이 구간을 중심으로 실제 산림 내에서의 수분변화에 대한 관계성을 분석하였다.

측정기간은 봄철(4월)에 산림청 산악기상관측시스템에서 운영하는 검봉산 AMOS와 헬기장 AMOS를 모니터링 하였고, 가을철(9월)에는 기상청에서 운영하는 삼척 876 AWS를 나누어 초고압 절연/메가 메터(모델명: SM-8220)를 사용하여 1일 3회(1회당 3반복 측정) 측정(10시, 14시, 16시)하여 총1,872회 측정하였다. Table 1은 측정기간 및 장소이다.

2.2.1. 전기저항 측정 장비

본 연구에서 선정된 전기측정 장치는 HIOKI 사의 초고압 절연/메가 메터를 사용하였다(모델명: SM-8220). 이 장비는 5×10^4

∼ 2×10^14Ω까지 측정이 가능한 장비로서 본 연구의 대상인 소나무 환봉의 전기측정 범위에 들어오는 장비이며, 측정 전압은 10V, 25V 를 선택하여 측정하였다. Fig. 3은 선정된 장비의 사진이다.

전기저항의 측정을 위해, 기준 전압을 10V와 25V의 전압을 선정하여 측정하였다. 그 이유는 향후 산림 내 기상망의 AMOS에 설치 시, AMOS가 태양광에 의해 작동되므로, 가용전력이 제한되는 환경을 감안하여, 최소 전압을 선정하였다.

2.2.2. 수분량(중량) 측정 장비

산불연료 수분량은 중량 측정 후 건중량 방법을 사용하였고, 현장에서 중량측정을 위해 에이컴 사의 전자저울(모델명: JW-1) 을 사용하였으며, 측정 범위는 0-2,000 g의 범위이며, 측정 최소 단위는 0.1 g이었다.

3. 결과 및 고찰

3.1. 산불연료 내 함수율과 전기저항과의 관계

본 연구의 목표인 자동화된 산불연료의 수분함량 측정에 의한 산불위험성을 예측하는 장비의 개발을 위해, 임내 퇴적물의 함수량에 따른 가연성 분류를 기준으로 분석을 실시하였다. 다음 Table 2는 임내 퇴적물의 함수량과 가연성을 분류한 표이다.

3.1.1. 전기저항치 측정 결과(10V, 25V)

전기저항치와 산불연료 내 습도와의 관계에 대한 측정 결과는 다음 Fig. 4와 같다. 분석결과, 함수율에 의한 전기저항 값을 추정하는 환산식〔전기저항=2E+13(함수율)-9.705〕을 도출하였으며(Yeom, 2018), 이 전기저항 환산식과 함께, 본 연구에서 개발하고자하는 산불연료의 수분함량의 측정을 통해, 산불의 위험도를 도출하기 위해, 산불연료의 함수율에 따른 가연성 분류에 따라 전기저항 값을 분석하였다. 그 결과, 산불 위험지수의 10V의 전기저항측정 값은 ‘극도의 가연성’으로 분류되는 2∼7%의 함수율에서 376MΩ∼269,734MΩ의 저항치 분포를 보였으며, 평균 저항치는 96,489MΩ 인 것으로 측정되었고, ‘고도’분류인 8 ∼10%의 함수율에서 409MΩ∼192,3501MΩ의 저항치 분포를 보였으며 평균 저항치는 28,820MΩ 인 것으로 측정되었다.

또한, ‘중도’분류인 11∼13%의 함수율에서 89MΩ∼4,923MΩ의 분포를 보였으며 평균 저항치는 752MΩ 인 것으로 측정되었고,

‘저도’분류인 14∼18%의 함수율에서 7MΩ∼1,075MΩ의 분포를 보였으며 평균 저항치는 418MΩ 인 것으로 측정되었다. ‘최저’

∼‘불연’분류인 19%이상의 함수율에서 1MΩ∼458MΩ의 분포를 보였으며 평균 저항치는 43MΩ 인 것으로 측정되었다.

25V 의 전기저항측정 값은 ‘극도의 가연성’으로 분류되는 2∼7%의 함수율에서 346MΩ∼292,083MΩ의 저항치 분포를 보였

으며 평균 저항치는 103,373MΩ 인 것으로 측정되었고, ‘고도’분류인 8∼10%의 함수율에서 401MΩ∼192,833MΩ의 저항치

분포를 보였으며 평균 저항치는 33,334MΩ 인 것으로 측정되었다. 또한, ‘중도’분류인 11∼13%의 함수율에서 92MΩ∼1,111M

Ω의 분포를 보였으며 평균 저항치는 492MΩ 인 것으로 측정되었고, ‘저도’분류인 14∼18%의 함수율에서 7MΩ∼1,017MΩ의

(18)

분포를 보였으며 평균 저항치는 459MΩ 인 것으로 측정되었다. ‘최저’∼‘불연’분류인 19%이상의 함수율에서 1Ω∼427MΩ의 분포를 보였으며 평균 저항치는 75MΩ 인 것으로 측정되었다. 다음 Table 3은 가연성에 따른 전기저항을 분류한 결과이다.

또한, 본 연구의 결과물이 실제 설치될 수 있는 환경을 감안하여, 실제 함수율 측정에 이용될 전기저항 측정을 위한 전압 값을 설정할 필요가 있어, 현재 조사한 10 V와 20 V의 환경을 분석하였다. 그 결과는 Fig. 5와 같다. 저항 측정 시 부여되는 전압 선정을 위해 10 V와 25 V의 전압을 비교 실험한 결과 10V와 25V의 전기저항 측정값은 서로 비슷한 경향의 기울기를 가지고 있으며 설치 장소의 전기시설 및 환경요소를 고려 할 시 10 V의 전압을 사용해도 문제가 없을 것으로 사료되었다.

따라서 현재 산악기상관측망은 태양열로 운영 중에 있으므로 연료습도를 측정하기 위해 최저전압을 사용하여 연료습도를 측정하여야 하므로, 본 연구에서 개발될 장비를 위한 측정 전압은 10 V를 적용하는 것으로 선정하였다.

3.1.2. 전기 저항에 의해 추정된 산불연료 습도의 검증

전기저항치의 변화에 의해 측정된 산불연료 습도의 검증은 현재 운용중인 산림청의 산불위험지수(Forest Fire Danger Index) 와의 상관관계로 분석하였다. 이를 위해, 국립산림과학원의 산불위험지수를 적용한 결과, 봄철 산불조심기간 중 삼척시 원덕읍 의 산불위험지수의 평균은 47.11로 ‘낮음’ 등급이었고, 최대값은 87.50(4월 4일 13시, 15시)으로 매우 높음이었으며, 최소값은 20.70으로 분석되었다. 본 연구에서 조사된 산불연료습도(검봉산 AMOS, 헬기장 AMOS, 강원대학교 삼척캠퍼스 교내 소나무 림)와 해당 격자의 산불위험지수(원덕읍, 삼척시 교동)의 관계성을 분석하기 위해 상관관계 분석을 실시한 결과는 Fig. 6과 같았다.

분석결과, 99%의 신뢰도에 음의 상관관계를 가지고 있는 것으로 분석되었다(R 2 =0.824). 따라서 봄철 산불조심 기간 중 검봉산 AMOS와 헬기장 AMOS에서 조사된 산불연료습도와 가을철 산불조심 기간 중 강원대학교 삼척캠퍼스 교내 소나무림에 서 측정된 산불연료 습도가 해당 지역의 산불위험지수(삼척시 원덕읍, 삼척시 교동)와 유의미한 상관관계를 가지고 있는 것으로 분석되었으며, 이는 본 연구의 결과물인 산불연료습도가 산불의 발생예측과 상관관계를 가지고 있는 것으로 해석할 수 있으며, 향후 산불위험지수를 보완할 수 있는 기초자료 제공이 가능할 것으로 판단된다.

또한, 측정된 산림연료습도가 실제 산불위험지수의 일변화 및 시간변화에서 유사한 변화를 가지고 있는지에 대한 직접적인 비교를 한 결과는 Fig. 7, Fig. 8, Fig. 9와 같다. 이 결과에 의하면, 산림 내에서 측정된 산불연료습도는 산림청의 산불위험지수와 유사하게 반응하는 것으로 나타났다.

3.2. 산불연료습도 자동화 측정센서 개발

산불연료습도 자동화 측정을 위해 전압별 전기저항치 측정결과를 통해 시제품을 개발하였다. Fig. 10, Fig. 11. Fig. 12, Fig. 13 은 산불연료습도 자동화 측정센서 시제품 제작과정을 나타낸 것이다.

함체 설계를 위해, 우선적으로 산림 내 기상망에 설치가 용이하도록, 센서가 지상으로부터 30cm 이격될 수 있어야 하며, 산림 내 노출될 환경을 감안하여, 방수, 방진 기능을 가진 함체를 제작하였다. 또한, 수행된 산불연료습도 자동화 측정 센서의 시제품은 신뢰성 있는 저항 값을 얻기 위해, 매시 정각에 측정을 실시하며, 전기저항 측정 오류를 줄이기 위해, 말단 1/4, 1/2 순서로 측정하며, 함수율을 전기저항을 위해 추정하는 환산식〔전기저항=2E+13(함수율)-9.705)〕(Yeom, 2018)을 적용하여 센서를 개발하였다. 각 부분 별로 10회를 5초 간격으로 측정한 후, 최대값과 최소값을 버린 평균 값을 출력하도록 설계하였다. 또한, 예보시스템과의 향후 연계를 위해, 산불위험 임계치를 설정하여, 금번 출력에 활용하였다. 이를 위해, 과거 Lee (1995)에 수행한

‘ 산불발생위험성 및 연소확대 요인 분석에 관한 연구’를 참조하여, 산불위험도의 구간과 임계치를 설정하였다(Table 4).

그러나, 본 연구에서 수행된 시제품의 제작이 제한된 시간과 비용으로 인해, 고 저항에서 안정적으로 저항을 측정할 수 있는 시제품의 개발에는 도달하지 못하였고, 50MΩ 이하의 저항 값을 안정적이고 정확하게 측정할 수 있는 기판을 개발하였다.

따라서 본 연구에서 제안된 센서의 적용은 산불연료습도가 16%, 즉 41.21MΩ 이상의 값에 대해서는 산불의 위험도가 위험으로 출력될 수 있도록 소프트웨어를 제작하였다. Table 4는 산불연료습도 자동화 측정 센서의 임계치이고, Fig. 14는 서울시 홍릉소 재 국립산림과학원에 설치한 사진이다.

3.3. 자동화 시제품 모니터링 결과

3.3.1. 국립산림과학원 설치 시제품의 모니터링 결과

본 연구에서 제작한 시제품의 검증을 위해, 국립 산림과학원 내 홍릉 임내 자동기상관측소에 시제품을 설치하여 2017년

11월 3일 ∼ 2017년 12월 20일까지 변화상을 측정한 결과는 다음 Fig. 15와 같다. 즉, 모니터링 기간 동안 총 7회의 강우가

(19)

있었으며, 강우에 의해 반응한 것으로 분석되었다. 하지만, 장비의 한계인 50MΩ 이상의 값은 측정할 수 없는 한계로 인해, 이보다 이하의 함수율(15% 이하)의 변화 값을 측정할 수 없는 것에 대해서는 추가적인 장비 개선에 의한 보완이 필요한 것으로 판단되었다.

3.3.2. 강수량과 센서의 반응 민감도와의 관계

산불연료 습도 측정 센서의 모니터링을 위해, 2017년 11월 3일부터 2017년 12월 20일까지, 홍릉 임내 자동기상관측소에 설치한 모니터링 결과 총 7회의 강우가 있었으며, 그에 따른 전기저항 값의 변화는 Table 5, Fig. 16, Fig. 17과 같았다.

분석 결과 강수량의 증가에 따라, 저항치 값의 변화(감소)가 증가되어, 강수량이 많을수록 함수율이 증가하는 것으로 분석되 어, 강수량의 변화에 따른 함수율의 변화를 센서가 감지하는 것으로 분석되었다. 다만, 모집단(강수 7회)의 수가 적기 때문에 추가적으로 장기간에 걸친 모니터링이 필요한 것으로 판단되었다.

3.3.3. 강수량과 센서의 반응 시간과의 관계

산불연료습도 측정 센서의 모니터링을 위해, 2017년 11월 3일부터 2017년 12월 20일까지, 홍릉 임내 자동기상관측소에 설치한 모니터링 결과 총 7회의 강우가 있었으며, 그에 따른 센서의 전기저항변화가 일어나기 까지 걸린 시간을 측정하여 분석하였다. 이는 강수량에 따른 함수율의 변화를 얼마나 타당성 있게 감지하느냐 하는 점에서 중요한 인자로 판단되어 분석을 실시하였다. Table 6, Fig. 18은 강수량에 따른 반응시간의 분석결과로, 초기 모니터링 값에서 강우 후 센서의 반응이 10시간 이후에 발생하였으나, 설치 30일 이후에는 각각 3시간과 1시간의 반응 시간을 기록하여, 강우 후에 즉각적인 함수율의 변화가 측정되는 것으로 분석되었다.

이와 관련하여, Micheael(1983)은 산불연료수분 측정봉(Forest fire fuel moisture stick)은 자연환경에서 노출되어 수분의 변화를 측정하며, 시간이 지남에 따라, 중량이 감소하는 것을 조사하였다, 따라서, 시간이 지남에 따른 측정봉의 밀도 변화에 따라, 함수율 변화 시간에 차이가 발생하는 것으로 추측되며, 이에 대한 추가적인 연구 및 구명이 필요할 것으로 사료된다.

4. 결 론

본 연구는 산불의 발생과 확산 위험성의 지표인 산불연료의 수분함량과 산불위험도의 변화를 예측하기 위한 자동화된 산불연 료습도 측정센서를 개발하고자 수행하였다.

주요 연구결과로 이 측정센서는 산불연료의 함수율을 전기저항으로 측정하여 자동으로 산불연료의 함수율을 산정하는 방법 이다. 이 센서에 사용된 산불연료는 소나무(길이 50 cm, 직경 1.5 cm)이고, 함수율과 전기저항과의 관계를 추정하는 전기저항

=2E(E:Exponent of 10)+13X(X:함수율)-9.705(R 2 =0.947)인 환산식은 개발하였다. 또한, 이를 이용하여 자동화된 산불연료습 도 자동화 측정센서의 소프트웨어와 함체를 설계하여 시제품을 제작하였고, 이를 다시 산림 내에서 현장 모니터링 검증을 실시하여 적합성(R 2 =0.824) 을 확인하였다.

또한, 강수량과 센서의 반응 민감도와의 관계를 분석한 결과, 강수량의 변화에 따른 함수율의 변화를 센서가 감지하는 것으로 분석되었으며, 추가적인으로 장기간에 걸친 모니터링이 필요한 것으로 판단되었고, 산불연료습도 측정센서가 50MΩ 이상의 값은 측정할 수 없는 한계로 인해, 이보다 이하의 함수율(15% 이하)의 변화 값을 측정할 수 없는 것에 대해서는 추가적인 측정 센서의 개선이 필요한 것으로 판단되었다.

끝으로, 본 연구결과는 산불의 발생과 확산 속도 및 강도를 예측할 수 있는 기술의 개발에 도움을 주며, 산불위험예보 기술의

고도화를 위한 기초자료로 활용될 것을 기대한다.

수치

Fig. 1. The standard of forest fire fuel proxy and the location of electrodes.
Table 2. The relationship with the moisture of forest sediments and the combustibility
Fig. 4. The results of analysis of the relationships with forest fire fuel moisture contents and electrical resistances.
Table 3. The results of an electrical resistance measurement according to voltage (10V, 25V)
+6

참조

관련 문서

key words: forest healing, forest healing factor, forest healing program, forest for healing, urban forest.. 특히 급 격한 도시화 및 산업화에 따라 여가시간

A Study on the Development of Ship’s Ballast Water A Study on the Development of Ship’s Ballast Water A Study on the Development of Ship’s Ballast Water A Study on the

Incheon Metropolitan City's green projects took first place in the 2016 Green Fund Support Program organized by the Korea Forest Welfare Institute. The ‘Eco Garden’ plan

The stereoscopic microscope image of gold particles in the leaching residue from Geumsan sample as a function of nitric acid concentration on the filter papers by lead

In the broad approach, a country would define a system of forest management practices (without the requirement that a specified forest management practice

Böcher, 2008, Integrated Rural Development Policy In Germany and its Potentials for new Modes of Forest Governance, Institute of Forest, Environmental, and

내삶을 바꾸는 숲, 숲 속의 대한민국.. KOREA FOREST

스마트 화재경보 LED조명등 현장 적용 연구 A study on field application of LED lighting.. fixtures with