1. Introduction
Recently LiDAR technology is actively studied and applied in various research and application areas such as atmospheric science, mapping, virtual reality modeling, forestry etc. In the respect of photogrammetry, it is quite advantageous that airborne LiDAR systems directly provide accurate three dimensional point data with high sampling density as well as radiometric information, intensity. Laser intensity is defined the amount of power back-scattered from the surface. A photodetector converts the energy to digital numbers representing the reflectance of the surface.
Baltsavias (1999) explained the theory of laser back-scattering affected by various factors such as surface reflectance, atmospheric attenuation, and geometry of the pulses etc.
Although the intensity can provide valuable information about the surface at a certain wavelength, the characteristics of intensity have not been clearly understood in reality due to the variable effects of factors. In an effort to
elucidate the effect of surface reflectance on intensity, Yoon et al. (2008) compared the LiDAR intensity with the reflectance measured by a spectro-radiometer in the field. They explained the reflectance of invariant targets at near-infrared wavelength were similar pattern to the intensity, but intensity of vegetation showed different patterns from the reflectance of the measurements. The endeavor has been continued to explain the characteristics of intensity and correct the intensity radiometrically. In the current status, has been tried the effort to extract information from intensity data such as segmentations. If the intensity were completely corrected to maintain constant characteristics to be independent on atmosphere and geometric conditions, it could certainly be crucial supplementary orthogonal radiometric information together with the accurate geometric information of LiDAR.
The aerial LiDAR system is composed of GPS, INS and a laser scanner and integrated with a digital image system. The two data sets, LiDAR and digital aerial images
Adjustment of Exterior Orientation of the Digital Aerial Images using LiDAR Points
Yoon, Jong-Suk
1)Abstract
LiDAR systems are usually incorporated a laser scanner and GPS/INS modules with a digital aerial camera.
LiDAR point clouds and digital aerial images acquired by the systems provide complementary spatial information on the ground. In addition, some of laser scanners provide intensity, radiometric information on the surface of the earth. Since the intensity is unnecessary of registration and provides the radiometric information at a certain wavelength on the location of LiDAR point, it can be a valuable ancillary information but it does not deliver sufficient radiometric information compared with digital images. This study utilize the LiDAR points as ground control points (GCPs) to adjust exterior orientations(EOs) of the stereo images. It is difficult to find exact point of LiDAR corresponding to conjugate points in stereo images, but this study used intensity of LiDAR as an ancillary data to find the GCPs. The LiDAR points were successfully used to adjust EOs of stereo aerial images, therefore, successfully provided the prerequisite for the precise registration of the two data sets from the LiDAR systems.
Keywords : Photogrammetry, LiDAR, Exterior Orientation, Adjustments, Intensity
한국측량학회지 제, 26권 제 호5 , pp. 485~491(2008년10월31 )일1) Member ・ Land Monitoring Research Center, Inha University(E-mail:[email protected])
are simultaneously taken but the aerial images are necessary to be register to the ground space. Valuable spatial data set would be prepared when the relationship between digital images and LiDAR data was established, which means both data set are registered each other with a sufficient degree of precision. Various efforts to register the two data sets have been tried in many studies focused on how to find the correspondence between LiDAR points and aerial images. Delara et al. (2004) performed triangulated bundle adjustments with GCPs utilized from LiDAR data for the integration of LiDAR data and digital aerial images from a non-metric camera. In their study, they found GCPs from LiDAR intensity image and corre- sponding locations from the digital images. Lee et al.
(2005) adjusted EOs of simulated a pair of stereo images.
They extracted planar patches from the LiDAR data set in order to find corresponding locations between LiDAR data and simulated stereo images. Kwak et al. (2006) registered digital aerial images and LiDAR data using centroids of building roofs extracted from the two data sets respectively. They estimated exterior orientation(EO) based on the centroids as control points and checked the accuracy of ground points showing satisfaction of the accuracy of 1/5000 maps. Yun and Hoong (2006) generated orthorectified digital images acquired with LiDAR data using digital elevation model(DEM) generated from LiDAR points.
The purpose of this study is the investigation of the feasibility of LiDAR and digital aerial images simultane- ously taken with the LiDAR. LiDAR point clouds were utilized to adjust EOs of a pair of stereo digital aerial images in the aid of intensity. Since the intensity of LiDAR is orthogonal and unnecessary of the registration procedure, it makes the collection of GCPs from LiDAR points much easier. This study investigated the behaviors of EOs to estimate the image coordinates of corresponding ground points. Then, the EOs were adjusted with GCPs of LiDAR points to register the two data sets because LiDAR data has significant advantages to provide GCPs.
2. Study data
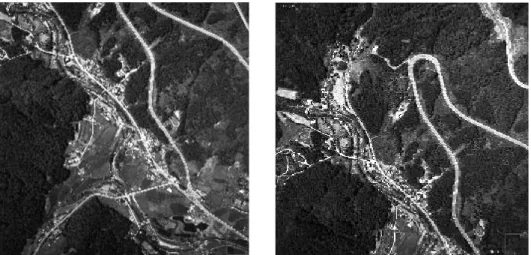
This study performed the adjustment of the EOs of stereo images selected from the strips of digital aerial images. LiDAR and digital aerial images used in this study were acquired in April 2004 and the data set covered common rural villages in the middle part of the Korean peninsula. Fig. 1 shows the two images of the stereo pair taken by a digital metric camera (4K02 by the Optech) installed with a LiDAR system. The size of the images was about 4,000 by 4,000 in the color mode and the ground sample distance (GSD) was 25 cm. Approximately, two-thirds of stereo pair images were overlapped each other. High resolution color images provided detail infor-
Fig. 1. Digital aerial stereo pair
mation on the study site such as the status of seasonal development of vegetations and detail features on the ground surface. Table 1 illustrated the specifications of the digital metric camera.
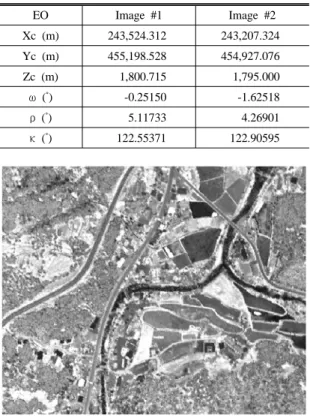
EOs of the two images were initially provided by the vendor as shown in Table 2. The EOs were recorded by a combined GPS/INS system. The system recorded precise EOs of the LiDAR scanner and the EOs for the camera were recorded based on the time. The flying height was around 1,800m. The laser scanner, Airborne Laser Terrain Mapper (ALTM) 3070 by the Optech, was used to
collect LiDAR points over the area and the nominal vertical accuracy of the LiDAR data was about ± 15 cm at flying height 1,200m. Horizontal accuracy was estimated by the flying height/2000 and the point density was 2.2 points per m
2.
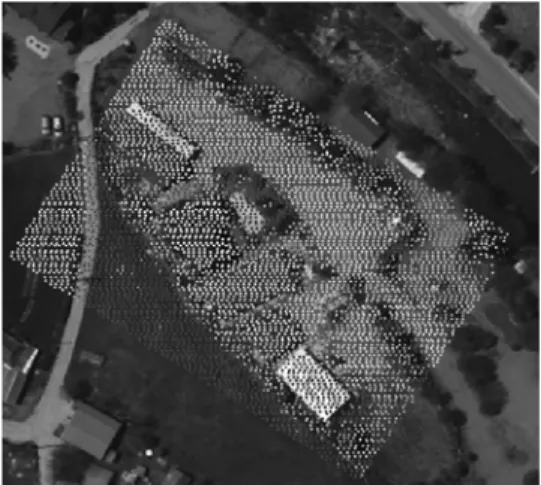
The LiDAR data set used for this study also provided intensity, the radiometric information over the ground at 1064 μ m of near-infrared region. Since LiDAR data is commonly very high resolution with 2~3 points in a square-meter, intensity of LiDAR provides high resolution and detail information on the ground as well. Some detail features on the ground are clearly discernible in intensity. Fig. 2 shows the intensity of LiDAR over the study area in the interpolated grid format, which covers a part of the aerial images in Fig. 1. Asphalt roads, center lines of roads, crop lands, paths between crop lands are distinctly discernible in the intensity data.
While radiometric properties of features on the ground are different from the reflectance of near-infrared region of optical images, it provides sufficient separability between the features.
3. Back-projection of ground points
The relationship of image and ground space and the location of the sensor is established through the mathe- matical model of collinearity equations based on the photo- grammetric knowledge. If the coordinates of a certain point on the ground and the EO were precise, the estimated image coordinates calculated from the collinearity equations should be pointed to the exact same locations on the two images of a pair of stereo. Since this condition is not perfectly satisfied in reality, the EOs are commonly adjusted with GCPs.
In this study, it is attempted to investigate the behavior of EOs of stereo images. Arbitrary ground points were selected from the LiDAR points clouds, and the ground points were back-projected to the two stereo images through the collinearity equations. For the investigation of EOs of the stereo pair, five ground points were selected to be back-projected using the collinearity equations as Table 1. Specifications of the airborne digital camera
Image size 4,092(along flight) by 4,077(across flight) Pixel size 0.009 mm
Focal length 55.156 mm
Principal point X: 0.061 mm Y: -0.07 mm
GSD 25 cm
Table 2. EOs of the two stereo pair images
EO Image #1 Image #2
Xc (m) 243,524.312 243,207.324 Yc (m) 455,198.528 454,927.076
Zc (m) 1,800.715 1,795.000
ω ˚( ) -0.25150 -1.62518
ρ ˚( ) 5.11733 4.26901
κ ˚( ) 122.55371 122.90595
Fig. 2. Intensity of LiDAR data
shown in equation (1). EOs in Table 2 and some factors of the camera in Table 1 were required for the equation (1).
(1)
4. Adjustment of Exterior Orientation
4.1 Conjugate points on stereo images
This study purposed to adjust EOs of digital aerial stereo images with GCPs from LiDAR data. GCPs were manually collected from the identical locations on both stereo images and LiDAR data. First, image coordinates of GCPs candidates were measured on the stereo pair images using an image processing tool. Considering the corresponding locations on the ground in LiDAR data, GCPs were collected from the conspicuous locations on the pair of stereo images. Since each image processing tool was set to the origin of images respectively, it should be considered to convert the coordinates to the central origin of the images in order to apply the collinearity
equations of the perspective projection. The tool used for this study has set the origin to the upper left of images, and it was considered for the interior orientation of the images to solve the parameters of EOs. The total number of GCPs collected were 11 points over the overlapped area of both stereo images.
4.2 GCPs from LiDAR points
The corresponding locations on the ground space were obtained from LiDAR points with the aid of intensity.
The intensity with 2.2 points per square meter of the sampling density provides sufficient a priori information to find GCPs among the bunch of LiDAR points. Some of detail features and location could be sufficiently recog- nized as the corresponding locations of the conjugate points from the stereo pair images to play a role of GCPs.
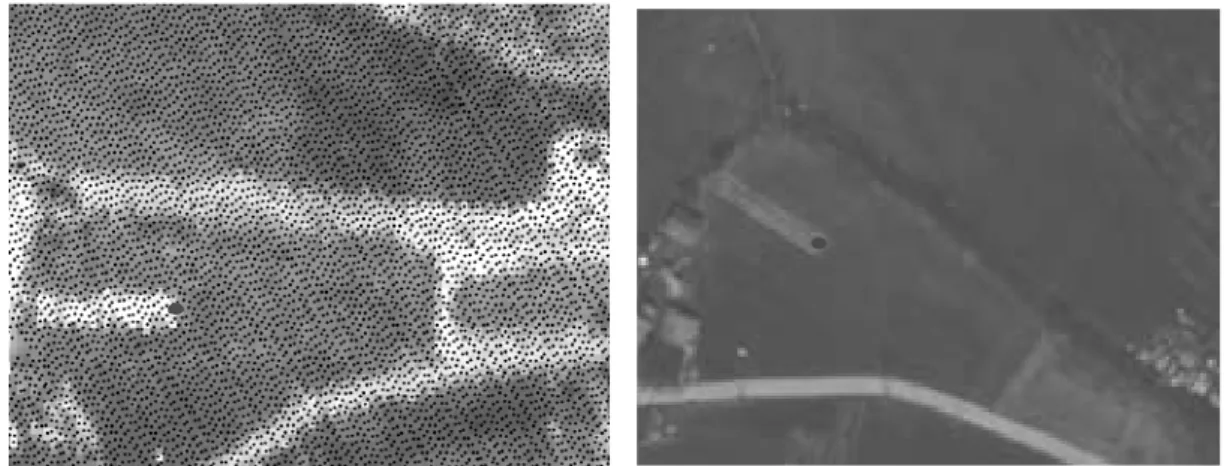
Fig. 3 shows an example of GCPs from the LiDAR points, which illustrates where the GCPs were collected.
The left side of Fig. 3 displays LiDAR point data overlaid with the intensity image and one of the collected GCPs is displayed on the intensity images. The right side of Fig. 3 shows the corresponding GCP on the aerial photographs. GCPs were collected from the conspicuous locations both digital aerial images and LiDAR points.
Although field surveying is the best way to present the GCPs geometric accuracy, it was assumed that the GCPs from LiDAR had precise geometric accuracy in this study because the LiDAR system included GPS systems and
Fig. 3. GCP from LiDAR point clouds
the distributor performed the post calibration for the sufficient accuracy. Therefore, this study considered the nominal accuracy provided by the manufacturer.
4.3 Adjustement of EOs
The initial EOs of stereo images were adjusted with the contribution of GCPs manually collected from images and ground spaces. The adjustment was based on the well-known mathematical model of collinearity equations.
During the adjustment, the collinearity equations were linearized to perform the least square method determining EO parameters. In addition, the ground coordinates of GCPs and image coordinates of conjugates points were also adjusted with a priori standard deviations.
The accuracies of ground points from LiDAR were set to the nominal accuracies, ±15 cm at 1,200 m of flying height vertically, and flying height/2000 horizontally.
Standard deviations of image coordinates measured from images were set to a half pixel. Therefore, ground points of LiDAR and image measurements were considered to be very precise, so the coordinates were changed within a priori information. With the relatively high weights of LiDAR ground coordinates and manually measured image coordinates, the EOs of stereo images were adjusted to back-project ground points to the exact same location on the two images.
5. Results
5.1 Investigation of the behavior of EOs
First, ground points from LiDAR data were back-projected to image space through the collinearity equations. With the precise EOs, the calculated image coordinates should indicate the exact same locations on the two images.
The image coordinates calculated by the collinearity equations (Eq. (1)) with initial EOs were verified in the image processing tool to check the locations. Fig. 4 shows the locations of the calculated image coordinates of a ground point on the stereo pair images. It is noticed that the ground points were back-projected to totally different locations on the two images. Considering the
calibration of LiDAR data before the data distribution of the vendor, the fact indicated the initial EOs of the two stereo image were necessary to be adjusted. Therefore, GCPs collected by manual measurements and corresponding conjugate points on the stereo images were used to adjust the EOs of the two images.
5.2 Adjusted EOs
The conjugate points manually measured from the two stereo images were considered as precise as a half pixel accuracy of standard deviations in the adjustments of EOs. In addition, the ground coordinates of corresponding conjugate points were a1so considered to be accurate because GPS/INS modules and post calibration works were associated to produce the accurate ground coordinates of LiDAR data. Thus, the nominal horizontal and vertical accuracies of the LiDAR data were used for the adjust- ment of EOs. If the GPS surveying will be performed in field, the accuracy from the campaign can substitute for the nominal accuracies.
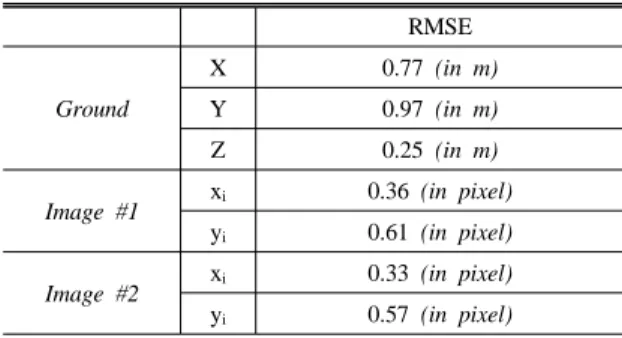
Table 3 shows the RMSE of ground and image coordinates after the adjustment. Eventually, image coordinates man- Fig. 4. Back-projected locations of a ground point using initial
EOs
Table 3. RMSE of ground and image coordinates of GCPs
RMSEGround
X 0.77 (in m)
Y 0.97 (in m)
Z 0.25 (in m)
Image #1
xi 0.36 (in pixel)yi 0.61 (in pixel)
Image #2
xi 0.33 (in pixel)yi 0.57 (in pixel)
ually measured were adjusted within one pixel and the coordinates of horizontal direction were adjusted under one meter and the vertical coordinate was adjusted under
a quarter meter. With the contribution of GCPs, the initial EOs were adjusted as shown in Table 4. The heading ( ) of EOs were adjusted by the noticeable κ amounts, thus it is possible for the incorrect EOs to be provided about the flight direction. The reason the check points were back-projected to the image space in the totally different direction before the adjustments can be explained to stem from the incorrect flight direction information.
Using the new adjusted EOs of stereo images, ground points tested before adjustments were back-projected to the stereo images. The check points were projected to the exact same location on the both images with the new adjusted EOs as shown in Fig. 5. Comparing with the back-projected results with the initial EOs, the new adjusted EOs made the points to be back-projected to the precise locations on the two stereo images. Fig. 6 shows the back-projected LiDAR points overlaid with the stereo images that was not orthorectified yet. While Fig.
6 is only for the verification of the behavior of the new adjusted EOs in the image space, the images can finally be orthorectified to the ground space.
6. Conclusions
In this study, EOs of digital aerial stereo images simultaneously taken with the LiDAR data were tested and adjusted with GCPs obtained from the LiDAR point data and stereo images. Before the adjustments, the EOs were investigated with the check points from LiDAR data through the collinearity equations with the provided initial EOs. With the initial EOs of stereo images, the back-projected image coordinates of the ground points from LiDAR were checked on the two stereo images.
The back projected locations on the stereo images were totally different from each other. Therefore, GCPs man- ually collected from the two stereo images and ground coordinates of the corresponding locations were contributed to adjust initial EOs of the stereo images. Collection of GCPs from LiDAR point corresponding to the conjugate points on the stereo images was based on the intensity images to make the search easier. With a limited variation Table 4. Adjusted EOs of stereo images
Adjusted EO delta( )Δ
Image #1 Image #2 Image #1 Image #2 Xc (m) 243,498.050 243,200.586 23.26 6.74 Yc (m) 455,226.222 454,897.617 27.69 29.46 Zc (m) 1,805.396 1,800.480 4.67 5.48 ω ˚( ) -1.35664 -0.56826 1.11 1.06 ρ ˚( ) 4.22695 4.12414 0.89 0.14 κ ˚( ) 212.51704 212.75051 89.96 89.84Fig. 5. Back-projected of a check point
Fig. 6. Back-projected LiDAR points overlaid with one of
stereo images
of image and ground coordinates of GCPs, the initial EOs were adjusted. Among the six components of EOs, the heading of flight were adjusted in a large degree. To verify the adjusted EOs, the check points were back-projected again with the new adjusted EOs. The ground points were back-projected to the exact same locations on the two stereo images with the new adjusted EOs. The adjust- ment of EOs of digital stereo images is the prerequisite procedure in the aerial triangulation of the precise regis- tration of the stereo images to the ground space. Although the LiDAR ground points were also adjusted with the nominal accuracies, it is possible to use the accuracies from the GPS field surveying as the further study.
References
Baltsavias, EP. (1999), Airborne Laser Scanning: Basic
Relations and Formulas, ISPRS Journal of Photogrammetry
& Remote Sensing, Vol. 54, pp. 199-214.
Delara, R., Mitishita, E.A., and Habib, A. (2004), Bundle Adjustment of Images from Non-metric CCD Camera Using LiDAR Data as Control Points, XXth ISPRS Congress,
ISPRS, Istanbul.
Kwak, T-S, Kim, Y-I, Yu, K-Y and Lee, B-K. (2006), Registration of Aerial Imagery and Aerial LiDAR Data Using Centroids of Plane Roof Surfaces as Control Information, KSCE Journal of Civil Engineering, Vol. 10, No. 5, pp. 365-370.
Lee, I., Kim, S. J. and Choi, Y. (2005) Surface-based Geometric Registration of Aerial Images and LiDAR Data, Korean Journal of Geomatics, Vol. 5, No. 1, pp. 35-42.
Yoon, J-S., Shin, J-I. and Lee, K-S. (2008), Land Cover Characteristics of Airborne LiDAR Intensity Data: a case study, IEEE Geoscience and remote sensing Letter, (in printing)
Yun B. and Hoong, J. (2006), Updating of Digital Map using Digital Image and LiDAR, J. Korean Geophysical Society, Vol. 9, No. 2, pp. 87-97.
접수일 심사일 심사완료일
( 2008. 8. 20, 2008. 10. 7, 2008. 10. 14)