Impervious Surface as a Thematic Parameter of Analysis for Childhood Asthma Hospitalizations :
Spatio-temporal Approaches *
Um, Jung-Sup**
소아천식 유병율 분포의 분석변수로서 불투수면 : 시공간적 접근*
엄 정 섭**
Abstract:The impervious surface was frequently employed as a proxy of the total environmental burden in the urban area. The impervious surface was extracted from a satellite image and the GIS (Geographical Information System) database for childhood asthma hospitalizations was generated for a total of 62,136 children using the National Health Insurance database of South Korea. Children living in an impervious environment do result in almost twice as many hospitalizations (26.58%) for asthma, as compared to the sub-urban pervious living (15.82%). Furthermore, the risk zones with persistently high hospitalizations for three years were specifically identified over the impervious sub-district alone. The impervious zone showed a small inter-year variation of hospitalizations (r: 0.937) while the sub-urban pervious fringe was found to display a yearly variation(r: 0.371).
The strong temporal autocorrelation means that the impervious areas have frequent long-lived hospitalizations for asthma, thus children living in impervious areas were likely to have had more chronic asthma attacks than those living in pervious areas. These experimental results indicate that an impervious surface as thematic parameter of analysis is a crucial explanatory variable for asthma hospitalizations and its longer persistence among children.
Key Words:thematic parameter of analysis, impervious surface, childhood asthma
요약:불투수면은 물, 공기, 자연 생태계 등 전체 환경을 악화시키는 요인이 되기 때문에 도시의 총체적인 환경 질을 대표하는 지표로서 활용되고 있다. 도시를 대표하는 토지이용으로서 불투수면이 위성영상으로부터 추출되었으며 국민 건강보험공단 데이터를 이용하여 소아천식의 유병률에 대한 GIS 데이터 베이스가 구축되었다. 불투수 환경에 거주하 는 아동들이 26.58%의 천식 유병률을 보여주어 투수환경 거주 아동의15.82%에 비해 거의 2배에 가까운 천식환자가 확인되었다. 3년 동안 계속해서 천식을 치료하기 위해 병원을 방문한 환자수가 특별히 높은 위험지역은 불투수 환경 에 노출된 행정동에서만 관찰되었다. 투수환경에 위치한 지역의 연도별 천식환자수의 변동폭에 대한 상관계수가 0.371이지만, 불투수면에 위치한 지역은 0.937로 나타나 불투수면에 위치한 지역은 지속적으로 많은 환자가 발생하는 것으로 확인된다. 즉 불투수면에 노출된 환경에 위치한 지역은 투수환경에 입지한 지역보다 장기간에 걸쳐 만성 천식 질환을 앓고 있을 가능성이 많은 것으로 확인된다. 본 연구의 가장 큰 성과는 불투수면이 소아천식의 발생이나 만성 소아천식의 유병률의 분석단위지역으로 결정적으로 중요한 변수라는 것을 확인하였다는 점이다.
주요어:분석변수, 불투수면, 소아천식
1. Introduction
1)
Among the first questions to be answered when using GIS for asthma research are ‘‘what is the appropriate geographic extent and thematic parameter of analysis?’’ Most often, researchers use existing administrative, political and jurisdictional
boundaries. This approach makes sense in terms of accommodating available demographic and socioeconomic data, but these boundaries may have little to do with defining the actual or potential community impacted by asthma.
Although these decisions about the known or probable geographical extent of the problem to
**This work was supported by the Human Resources Development Program of the Korea Institute of Energy Technology Evaluation and Planning(KETEP) grant funded by the Korea government Ministry of Knowledge Economy (20094010200010).
**Professor, Department of Geography, Kyungpook National University([email protected])
be studied are often predetermined by such practical factors, their implications for analysis can be profound (Maantay, 2007). A number of studies have demonstrated, for instance, that differences in the unit of analysis selected can have dramatic impacts on the results of the study (Williams, 1999; Sang et al., 2005;
Matisziw et al., 2008). The prevalence of asthma increases when developing countries adopt a more urban lifestyle. Significant evidence indicates urban living as one of the main risk factors for asthma (Weinberg, 2000; Clark et al., 2002;
Corburn et al., 2006). Many studies have found higher-than-average childhood asthma prevalence in low-income minority communities, especially in urban settings (Aligne et al., 2000; Rand et al., 2000; Cloutier et al., 2002; Shapiro and Stout, 2002; Webber et al., 2002). Although findings remain mixed, collectively the studies suggest an effect of the urban built and social environment on asthma onset and severity. In this regard, it is considered that the delineation of urban versus suburban boundaries as the unit of analysis will strongly affect the results of the study. In South Korea, an urban area is simply defined by population. For instance, a metropolitan city is defined as having at least a million residents; this is similar to the U.S. requirement for a Standard Metropolitan Statistical area (SMSA). Urban environments, as commonly defined, are not as homogeneous as many researchers tend to think. Mixtures of impervious and pervious surfaces, as well as land uses (residential, industrial, commercial) can obfuscate results and the interpretations of health studies.
Therefore, the geographic boundary to define the magnitude of urban–suburban differences is often arbitrary with respect to the phenomena or events being investigated such as the demographic and socio-economic characteristics and land use patterns of the particular region.
The process of urbanization increases the local
impervious surface area in comparison to less pavement or built-up suburban/rural areas (Arnold and Gibbons, 1996). Impervious surface is defined as any constructed surface covered by impenetrable materials such as asphalt, concrete, brick, and stone. Urban artificial structures, such as rooftops, houses, garages, and other buildings, roads, sidewalks, parking lots, driveways, and other manmade concrete surfaces are among impervious surface types that featured the urban and suburban landscape. Impervious surface has been considered as a key environmental indicator due to its impacts on water systems and its role in transportation and concentration of pollutants.
Particularly, an impervious surface was frequently used as a fundamental factor indicating a non-point water pollution source within an urbanized region (Brabec et al., 2002). Impervious surface area coverage is a quantifiable land-use indicator that correlates closely with the adverse impacts of urban area. The impervious land cover as a non-point source of air pollution is strongly related to the physical and chemical properties of surface air bodies such as particulate matter, ozone and photochemical smog, all of which have been investigated as important environmental factors for asthma in previous research (Scannel et al., 1996; Tolbert et al., 2000; Friedman et al., 2001). The spatial variation of an impervious surface has been the subject of a number of environmental studies (Zug et al., 1999; Reilly et al., 2004; Stephen et al., 2006). The impervious surface, as a parameter of analysis, serves more or less as a surrogate for the typical urban land-uses such as vehicular traffic, domestic emissions, etc generally resulting in reduced indoor and outdoor air quality and consequently increased risk of asthma hospitalization. The impervious surface could be considered as one of the major factors that triggered the asthma incident as an indicator of intensity of urban environment. In this regard,
the impervious surface can be used as a proxy of the total environmental burden related to asthma, since it may contribute as much or more on a cumulative basis to the overall air pollutant emissions.
Health planners and managers frequently face the problem of selecting the most appropriate evaluation framework and indicators. Planning and management decisions will also be strongly influenced by the delimitation of the study area, the type and amount of information ready available, and the possibilities to collect new data. Asthma hospitalizations have, so far, seldom been empirically examined in terms of area-wide impervious surface arrangement. Until recently, the investigations of spatio-temporal dynamics of asthma epidemics remained largely theoretical; because the text based representations of prevalence have a disadvantage in that they provide only limited information on historical trends and spatial distribution of the asthma patients. The motivation for this paper was to interpret disparities in asthma hospitalizations using the impervious surface as a single independent analysis parameter which may aggregate the confounding factors of asthma. Exploring spatio-temporal dynamics of asthma in the impervious surface area requires the integrative use of remote sensing and GIS methodologies in order to extract appropriate geographic parameters of analysis and to investigate maps of different dates simultaneously. The aim of this research was to investigate how an impervious surface as an appropriate geographic extent and thematic parameter of analysis may be influential in deriving the prevalent and persistent pattern of childhood asthma, using spatio-temporal analysis techniques of GIS.
2. Data and methods
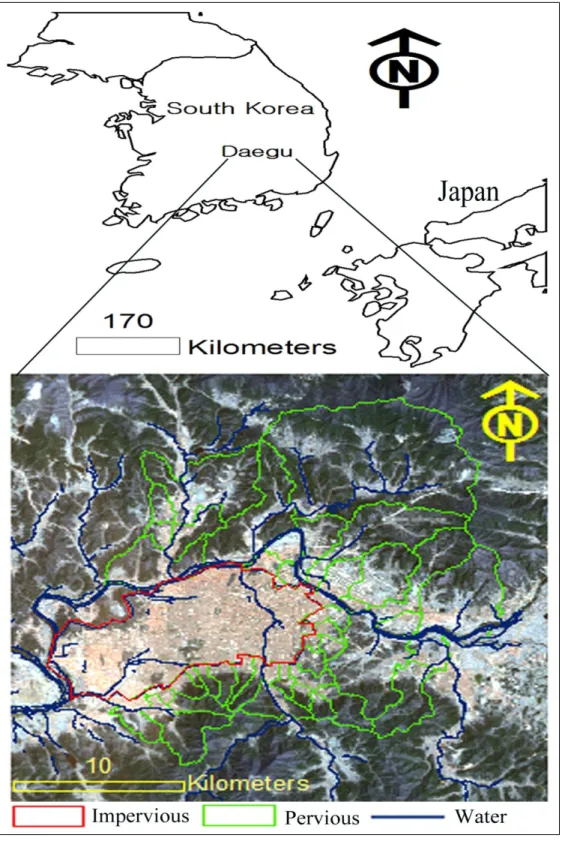
This study was conducted in Daegu metropolitan
city recognized as the third most important city in South Korea in terms of political strength (Figure 1, (Daegu City Government of South Korea, 2008). It is situated in the south eastern part of the Korean Peninsula, between latitudes 35.36°N and 36.1°N and longitudes 128.21°E and 128.46°E. It possesses several advantages that make it an appropriate choice for such a study. The city is located in a flat plain in a basin landform surrounded by high mountains.
This natural mountain barrier has a strong influence on the meteorological conditions meaning that the air pollution situation is less influenced by external dilution. It is often very cold in the winter and hot and sticky in the summer. It has experienced a rapid urbanization and industrialization over the past few decades and the intensive development from a single urban core has been the primary cause for the substantial increase of the impervious surfaces in the inner-city. The city has a large concentration of residents with a population of 2.5 million (301,826 children as of 2002) and a population density of 2813/km2.
The city center of Daegu, like most urban areas in South Korea, shows high air pollution indices, characterized by dense road networks, heavy traffic, smog and unplanned city architecture etc. Pollution from private and public vehicles is the main factor responsible for worsening the air quality in the downtown (central) impervious area (Daegu City Government of South Korea, 2006). The urban land uses are mainly for residential and commercial purposes.
The built-up areas are intensively located in the city center, extending about 15 km to the west and to the east, and about 10 km to the north (Figure 1). There are several industrial complexes on the west side of the study area, however, urban factory emissions are not serious since sulfur dioxide concentrations in Daegu have been substantially decreased with the expanding supply
Figure 1. Location map of the study area and impervious zone delineated from a TM satellite image (acquired in June 2002)
of cleaner fuels and low-sulfur oils; recorded as 0.006 ppm in an industrial complex area in 2002 (Daegu City Government of South Korea, 2006). The central impervious districts are at a lower altitude than other parts of the city which are surrounded by mountains (Figure 1). Here the channel-like streets facilitate the dispersion of pollutants within the impervious surface area.
Daegu is divided into 7 municipal districts and 129 sub-districts (administrative dongs). A dong is a residential community of people ranging from a few hundred to several thousand and is the lowest independent self-governing unit under the Korean local autonomy system.
“Dong” offices provide close, first-hand services for the residents such as population registration.
Since a centralized database for National Health Insurance (NHI) represents the hospitalizations of asthma or the locations of people with asthma in accordance with the dong under the Korean administrative system, the dong was used as the smallest unit of analysis within the impervious surface area. In South Korea there is a nation- wide reporting system for any disease listed by the NHI which covers the whole population as a compulsory social insurance system.
Actual cases of asthma or even emergency room visits due to severe asthma problems are tracked consistently by doctors or hospitals. The treatments by private physicians or clinics, etc., are properly represented by the database since a doctor’s prescription is required for those who control their asthma by use of medication.
Therefore the data is generally not only a good measure for prevalence, but also an indicator for the most severe asthma cases (i.e. those which result in hospitalization) although individual identifiers are not accessible due to privacy issues.
Every individual resident in South Korea is given a personal identification number which consists of thirteen digits which can be used to
determine the age and sex of the individual. The population registration contains the personal identification number and the address of the individual. It is obligatory to notify a dong office about any change in address and an individual patient record for each hospital admission must be reported to the National Health Insurance Corporation with their personal identification number. The database of asthma hospitalization cases was obtained from the National Health Insurance Corporation. The data included 3 years (2000∼2002, as of 31 December) of asthma hospitalization records for all Daegu residents under the diagnostic of the International Classification of Disease (J45, J46).
Asthma is the most common chronic condition among children; three times higher than that of the adult population (Fitzgerald et al., 1998; Au, 2002). Children, generally, respond with a unique sensitivity and vulnerability to exposure to environmental pollutants. “Children spend up to 50% more time outdoors than do adults thereby increasing their exposure to outdoor pollutants. Children are often involved in afternoon sports activities when the ozone levels are highest particularly in the summer and early fall” (Graham, 2004). Thus, children as a group are exposed to similar levels of air pollutants in their area of residence (Fritz et al., 1998), since they tend to stay within their neighborhood in the same area in which they attend school. Since the population data from the Korean Central Statistical Office was provided in terms of the predefined age interval (ten years), childhood asthma under the age of nine was investigated to elucidate the subtle and complex exposure effect caused by an impervious surface, and the population register for 2000–
2002 was acquired. Research on impervious surface extraction from remotely sensed data has attracted interest since the 1970s.
The Thematic Mapper data with 30m spatial
resolution (Figure 1) was used to identify the overall distribution of impervious surfaces and the satellite image was taken in June 2002, when the childhood asthma hospitalizations were collected (2000∼2002). The satellite data was cloud free and the summer period clearly shows the extent of the impervious area (built areas with low vegetation versus more heavily vegetated areas). The image was classified using a Maximum Likelihood classifier in Erdas Imagine with the training sites selected based on the IKONOS image (acquired in February 2002), and the visual interpretation of TM false color images.
Thematic classes used for satellite image interpretation are often arbitrary with respect to the phenomena or events being investigated.
Basically, the thematic ground classes identifiable by visual interpretation were used as individual classes in a computer-assisted classification.
However, to minimise misclassification (caused by inherent limitations of machine-based analysis), the number of thematic classes has been selected within the range of visually distinctive objects in separating impervious surface. Training samples for four classes were selected: vegetation, impervious surface, water-body and open space.
The results of classification generally corresponded to the visual interpretation of the image and the boundary of impervious surface are accurately delimited (Figure 2). However, the open space at the specific dongs with mixed characteristics between urban and sub-urban has been confused with the adjacent impervious surface class. Thus, these classes have been manually reclassified by screen digitizing of polygons based on visual interpretation of the IKONOS image.
Road networks with above 12m width were extracted from a digital topographic map (1:5000), obtained from the National Mapping agency (produced in 1996 from aerial photography taken at the same year), and combined into the
results classified from TM image as an impervious class. The digital topographic map was also used to extract the administrative dong boundaries. Impervious surface percentage per dong was calculated by dividing the impervious area by the area statistics per dongs in the ArcGIS to identify spatially intensified distribution of impervious areas.
An important question is how best to define the intensity of imperviousness used to categorize the mixed dongs into either pervious or impervious categories. The answer is not an easy one. The rationale to choose that particular cut-off was to find out the degree to which the inner-city impervious boundary can be precisely defined. When dong groups comprised of above seventy percentage of impervious surface were defined as an impervious area, it was possible to empirically delineate a large inner-city area into almost single homogenous sub-areas.
Correspondingly, dongs with above seventy percentage of impervious surface were extracted as a single impervious boundary (Figure 2).
Most dongs selected as impervious were located well inside the homogenous inner-city boundary in the satellite data. Three dongs within the range of 62 to 68% impervious intensity were observed within the inner-city boundary since urban parks are located there. Overall layouts of the three dongs are surrounded by vast impervious spaces from neighbor dongs and show the typical form of the city center such as dense super high-rise building and heavy road network.
They were included into the block of impervious boundary since it is considered that such approach would take into account area-wide impervious concentration and such single impervious boundary facilitates the visual representation for cartographic output produced from further analysis The resultant impervious boundary is illustrated in Figure 2.
Since the mapping of crude hospitalization
Figure 2. Administrative dong boundary overlaid on map classified from the TM satellite image data masks real differences in the site, the
asthma hospitalization percentage was calculated by using the actual number of cases divided by the number of children below 9 years old in each dong. The asthma patient data was added to each dong’s polygons by means of joining the data table to a theme’s attribute table. The time sequential analysis for the three year database was applied to read and integrate database tables, directly or by means of SQL-queries.
Raw data was stored in MS Excel and basic statistical parameters were calculated to acquire the overall features of the data sets. In addition
to exploring basic statistical parameters, the analysis of Pearson bi-variate correlation among yearly hospitalizations was undertaken using a SPSS statistical package.
Statistics collected by administrative units are usually represented as a choropleth map. The display of asthma hospitalizations in the form of a chloropleth map first requires that the data be classified into a small number of class intervals, and then that a graphic value be assigned to represent the statistical values of all area units belonging to the same class interval. The asthma hospitalization cases for the three years have
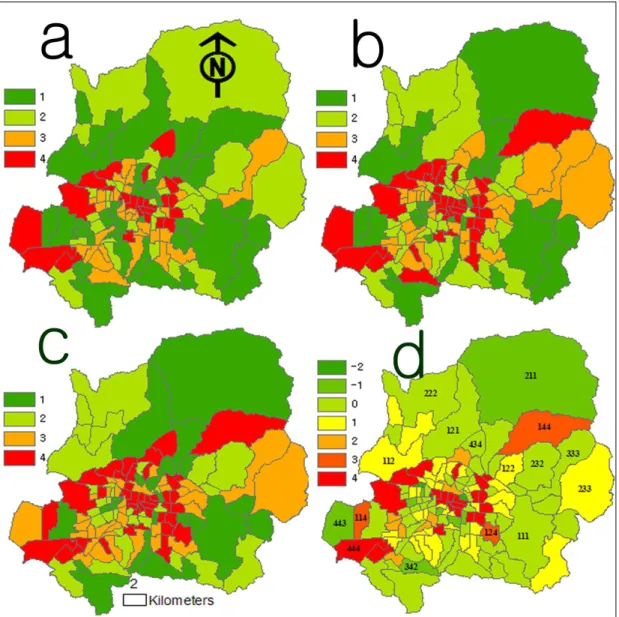
Figure 3. Multiple chloropleth maps produced from the matrix analysis (Table 2) for asthma hospitalizations changing trends in a GIS environment.
been aggregated and summarized to the quartile group level, to describe a percentile sequence of asthma hospitalizations values, in a more abstract form as presented in Table 2 (Wong et al., 2002; Stempel et al., 2004).
The reddish color in Figure 3abc represents high hospitalizations of asthma while the greenish color is low. Stronger tones within the same color range indicate the degree of the hospitalizations. The legend in Figure 3abc
means a quartile distribution (1 to 4) of asthma hospitalizations (a:2000 b:2001 c:2002): 1st Quartile (7.01∼13.73%), 2nd Quartile (13.74∼
17.49%), 3rd Quartile (17.5∼25.66%), 4th Quartile (25.67∼94.69%) Figure 3d shows the result of combining the three year data sets (Figure 3abc) to present changing trends (-2 to 4) of asthma hospitalizations (by quartile). The reddish in Fig 3d represents a higher persistence of asthma during sequential years while the
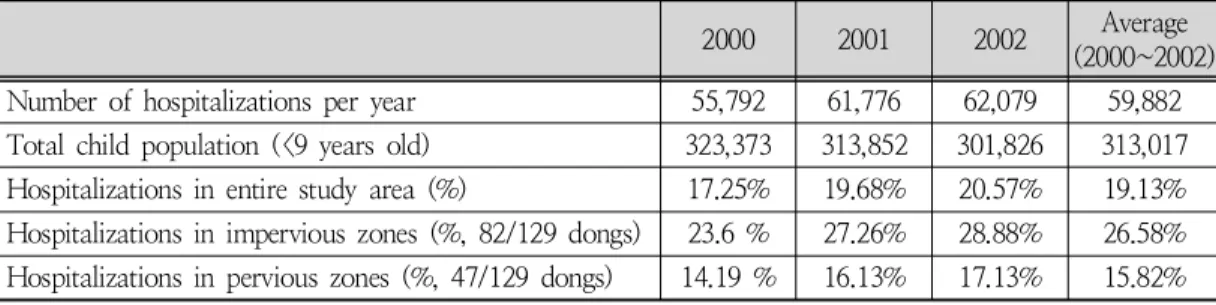
2000 2001 2002 Average (2000~2002) Number of hospitalizations per year 55,792 61,776 62,079 59,882 Total child population (<9 years old) 323,373 313,852 301,826 313,017 Hospitalizations in entire study area (%) 17.25% 19.68% 20.57% 19.13%
Hospitalizations in impervious zones (%, 82/129 dongs) 23.6 % 27.26% 28.88% 26.58%
Hospitalizations in pervious zones (%, 47/129 dongs) 14.19 % 16.13% 17.13% 15.82%
Table 1. Summary data in relation to childhood asthma hospitalizations (<9 years old)
2001/
2000 1st Quartile
(7.01-13.73%) 2nd Quartile
(13.74-17.49%) 3rd Quartile
(17.5-25.66%) 4th Quartile (25.67-94.69%) 1st Quartile no change in below
third quartile (0) a quartile increase (1) two quartile increase (2) three quartile increase (3)
2nd Quartile a quartile decrease
(-1) no change in below
third quartile (0) a quartile increase (1) two quartile increase (2) 3rd Quartile two quartile decrease (-2) a quartile decrease
(-1) no change in below
third quartile (0) a quartile increase (1) 4th Quartile three quartile decrease (-3) two quartile decrease
(-2) a quartile decrease
(-1) no change in fourth quartile (4) Table 2. Matrix for changing trends analysis of childhood asthma hospitalizations green color is low and yellow is an intermediate
state. The inter-relationship for persistence of asthma hospitalizations during 2000-2002 is expressed as a following aggregated number in the legend: two quartile decrease (-2), a quartile decrease (-1), no change in below third quartile (0), a quartile increase (1), two quartile increase (2), three quartile increase (3), and no change in the fourth quartile (4)
The numbers in the polygon of Figure 3d indicate a range of a quartile change during 2000∼2002. For example, 342 indicates that asthma hospitalizations of the site investigated belongs to the 3rd quartile in 2000, 4th in 2001 and 2nd in 2002 respectively, thus, the inter- relationship for persistence of asthma hospitalizations is classified as a quartile decrease (-1) during 2000∼2002 since a quartile increase (3rd-4th quartile) during 2000∼2001 was followed by two quartile decreases (4th-2nd quartile) during 2001∼2002.
3. Result
There are huge differences in asthma hospitalizations among dongs and clear regional patterns can be observed (Figure 3). Geogra- phically, the hospitalizations in the South- western inner city were almost twice as high as (26.58%) that occurring in the rest of the region 15.82% (Table 1). This was not unexpected, because it has been frequently reported by previous researchers that urban centers have high rates of hospitalization (Aligne et al., 2000;
Rand et al., 2000; Cloutier et al., 2002; Shapiro and Stout, 2002; Webber et al., 2002). It appears that children living in the northern and central-eastern districts are at a lower risk compared with children living in the central- west and south. The high asthma hospitalizations in southern districts correspond to districts that are among the most dense and impervious areas in the city.
0 5 10 15 20 25 30
quartile change number of
dongs
2000-2001 2001-2001 2000-2002
2000- 2001
1 7 26 26 1 0 21
2001- 2001
1 7 27 16 0 1 30
2000- 2002
2 6 23 24 6 1 20
-2 -1 0 1 2 3 4
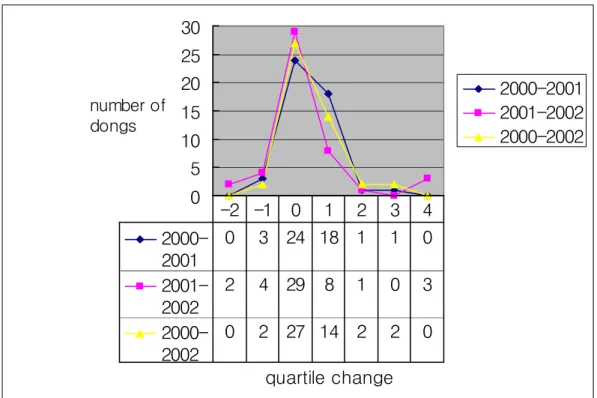
Figure 4. Changing trends of asthma hospitalizations in an impervious area Since any asthma prevalence is a dynamic
process, it is important to identify a spatial risk interval through the use of different temporal characteristics. For example, some areas might have a longer duration with relatively significant asthma prevalence and others might have a stronger intensity even though the duration is shorter. Once the risk areas at different epidemic periods are identified, the comparisons of case- incidence with their temporal–spatial dynamics can be helpful in identifying the possible causes or effective control measures. The spatio- temporal analysis to identify potential risk areas using appropriate temporal risk indices was based on the quartile classification of the percentile hospitalizations.
It can be explained through a matrix analysis procedure in an ArcGIS Environment (Table 2).
The quartile classifications were regrouped into eight relative categories based on changing trends of asthma hospitalizations: one to three quartile
increase (1/3), unchanged (0), decreased (-1/-3), and no change in the fourth quartile (4) as presented in Table 2. For example, if the incidences are at three quartiles higher than last year, the changing trend is assessed as ‘‘a three quartile increase.’’ If they are at two quartiles higher, it is assessed as ‘‘a two quartile increase,’’
and if they are only at one quartile higher, it is just ‘‘a quartile increase.’’ On the other hand, for ‘asthma decreasing trends dynamics,’ if the highest quartile in 2000 is classified as the lowest one in 2001, then this area is recorded as
‘a three quartile decrease.’ If there is no yearly variation of class, it is recorded as ‘‘no change.’’
Meanwhile, an extra class for no change in a fourth quartile is given since it is long-lived, the highest hospitalizations and the highest risk area.
The number of dongs with stagnant trends in the fourth quartile is very high as it is indicated in 2000∼2001(21), 2001∼2002 (30), and the accumulated number of dongs for 2000∼2002
0 5 10 15 20 25 30
quartile change
number of
dongs
2000-2001 2001-2002 2000-2002
2000- 2001
0 3 24 18 1 1 0
2001- 2002
2 4 29 8 1 0 3
2000- 2002
0 2 27 14 2 2 0 -2 -1 0 1 2 3 4
Figure 5. Changing trends of asthma hospitalizations in a pervious area
0 20 40 60 80 100
2000
0 20 40 60 80 100
2002
Correlation plots for 2000-2001 (r: 0.97) and 2001-2002 (r: 0.953) are not included because they are almost identical to that of 2002 vs. 2000.
Figure 6. Plot of asthma hospitalizations: 2002 vs.
2000 (percentile scale) in an impervious zone (r=0.937).
5 10 15 20 25
2000
10 15 20 25 30
2001
Figure 7. Plot of asthma hospitalizations” 2000 vs. 2001 (percentile scale) in a pervious area (r=0.628)
5 10 15 20 25 30 35
2001
0 10 20 30 40 50
2002
Figure 8. Plot of asthma hospitalizations” 2001 vs. 2002 (percentile scale) in a pervious area (r=0.804)
5 10 15 20 25
2000
0 10 20 30 40 50
2002
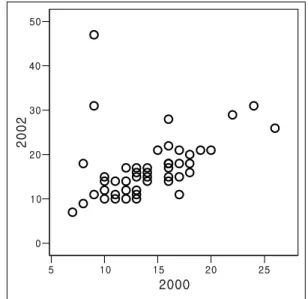
Figure 9. Plot of asthma hospitalizations: 2000 vs.
2002 (percentile scale) in pervious area (r: 0.371)
was 20, as shown in red in Figure 3-d.
Similarly, the marked high number of dongs in an impervious area is noticed in the no-change class in below the third quartile between the baseline and the one year follow-up (26) and between the baseline and the two year follow-up (27) as shown in light green in Figure 3-d.
In a GIS environment, various types of mapped output for hospitalizations changing dynamics were produced, as shown in Figure 3-a, b, c and d. The increasing trends of asthma hospitalizations appeared strongest in a south–western portion of the study area, together with a very large area of no change that encompasses nearly the entire impervious city (Figure 3d). The impervious zone itself has the highest risk administrative units (20 dongs) stagnant in fourth quartile hospitalizations (above 25.67%) for three years (Figure 4). 38 distinct dongs in a quartile increase (24 in impervious and 14 in suburban, Figure 4-5) between the baseline and a two year follow-up mostly belong to the west and central dongs in the city
(yellow color in Figure 3d). The proportion of a quartile increasing hospitalizations (38, i.e. 24 in impervious and 14 in suburban)) is approxi- mately 4 times that of a quartile decreasing (i.e.
6 in impervious and 2 in suburban) as shown in Figure 4-5. The changing trends of asthma hospitalizations (Figure 4-5) are highly stable, especially in inner-city impervious areas where children are frequently exposed to air pollutants in ordinary daily life. This result indicates that the environmental conditions related to asthma hospitalizations at each of the locations have probably not improved during the three years and the spatial pattern does not seem to change without specific external shocks, such as a remodeling of the impervious surface.
If these asthma episodes are mild and infrequent, asthma does not usually persist into the following years. However, if they are more frequent and severe, the asthma is likely to persist in subsequent years. These associations could be explained by a correlation analysis among the three year sets of hospitalization variables which are normalized by population
(hospitalization rates per dong). Only correlations significant at p<0:01 are reported here. Statistical analyses in an impervious area revealed that the latest hospitalizations were significantly correlated with the distribution of the previous year such as 2000∼2001 (r: 0.97), 2001∼2002 (r: 0.953) and 2000∼2002 (r:
0.937) and did exhibit a consistent pattern in this entire population set (Figure 6). Asthma hospitalizations in an impervious area were closely associated with asthma episodes in the past year and could be predicted based on the baseline data and subsequent asthma events. On the contrary, relatively weak correlations of asthma hospitalizations across the suburban pervious areas (Figure 7-9) were observed between the annual patient percentage of 2000∼
2001 (r: 0.628), 2001-2002 (r: 0.805) and 2000
∼2002 (r: 0.371). The inter-annual variation (r:
0.628, r: 0.805) between the subsequent two years in a pervious area is much weaker than that of the three year’s variation (2000∼2002, r:
0.371).
This demonstrates that the spatial distribution of hospital utilization is relatively consistent in the short term (from year to year). However, children with a history of asthma attacks were much less likely to have asthma symptoms (37%) again after two years specifically when compared with those in the impervious area. The similarity of asthma hospitalizations in the same sites during three years was not consistent, which indicates that the previous year’s hospitalizations in the last periods have less impact than that of the impervious area. This makes sense because less site dependence of asthma hospitalizations in the pervious surface would be expected for the three year long period. It is believed that a majority of the asthma patients in the impervious surface areas experienced persistent symptoms that were still present at a later time within a 3-year
follow-up. Asthma profiles of individuals collected from the same site, but at different times, should be distinct since it is hard to believe that they may reflect a similar genetic response (such as airway hyper-responsiveness and pathways of inflammation) in such a large number of subjects.
4. Discussion
The study highlighted inequalities in the distribution of asthma rates by mapping the boundary of an impervious surface using satellite data. Defining asthma risk areas based on an impervious surface, as realistic area-wide evidence, was much more robust than disease- clustering methods based on administrative, political and jurisdictional boundaries (Goldstein et al., 1978; Cloutier et al., 2002; Webber et al., 2002). The multi-temporal choropleth map can be utilized for factual assessment for asthma hospitalization by overcoming subjective judgment suffered from a lack of cartographic representation.
The impervious surface as an analytical parameter is theoretically justified since the confounding factors for the asthma hospitalization such as building density, road density and land use pattern could be probed by more accurate targeting of groups at risk and their locations effectively. For example, in an area with comparatively high childhood asthma hospitalization rates located in a strong impervious site, therapy should be directed to long-term goals and relapse-prevention such as land use changes. It is also noted that the city administrative boundary does not correspond with the health effects or discriminatory consequences of impervious surfaces. It also permits the researcher to more closely match the analytical parameter with the extent of the impervious surface under study. It is believed that the researcher can examine diverse health effects in
relation to possible confounding variables.
Several studies have tracked that childhood asthma tends to be seasonal, and increases in asthma attacks are observed in the back- to-school months when children return to close classroom quarters after having spent the holiday apart from one another such as a seasonal
“back-to-school asthma” phenomenon (Neidell, 2004; Johnston et al., 2006). These children get hit with a strong environmental risk caused by the impervious surface and the arising from the totally different holiday natural settings. A heated island effect and airborne pollution are fueling asthma rates, especially in inner-city children. The results of this study extend previous findings, specifically focused on the associations with an impervious surface. The study findings also could be supported by epidemiologic evidence that vehicle emissions are associated with the differential hospitalizations of asthma (Lin et al., 2002). In a serendipitous experiment, during the Atlanta Olympic Games (1996), driving decreased 22.5% as cars were restricted in the downtown area. At the same time, emergency room and hospital admissions for asthma decreased 41.6%, while the occurrence of other medical events was unchanged. It is believed that an impervious surface is associated with the pollutants from traffic which act as a trigger for an acute asthma event.
The spatial dimension of an impervious surface varies according to the way different societies construct different shared architectural spaces (Jackson, 2003). Korean values, attitudes, and behaviors in childhood asthma hospitalizations do not work in the same ways as in the West.
The typical attributes associated with the disparity of asthma rates such as poverty and racial minority (Busse and Mitchell, 2007) should be reinterpreted in consideration of Korea’s long period of cultural isolation and racial homogeneity. South Korea is a mostly
homogeneous society with an absolute majority of the Korean ethnicity (Shin, 2006; CIA, 2008).
Korea has experienced a rapid industrialization since the 1970s. As a result, many farmers moved from rural to urban areas to get more profitable jobs. The farmers who left the rural areas mainly settled in peri-urban pervious areas of the big cities since housing rent costs in urban impervious centers were so high (Kwon, 2007). High-rise building blocks of high-income families are concentrated in the impervious areas of the inner-city and high-income residential areas are also scattered surrounding the commercial centers of the city (Ha, 2006). In this regard, poor sanitation, poverty and racial minority could not be the leading childhood asthma threats within the impervious boundary of the Daegu metropolitan city.
Yet, urban design in South Korea remains very much under the influence of development oriented planning practices which cause increased urban congestion on impervious surfaces. The dense road network caused a rapid increase in the use of motorized vehicles in the impervious inner-city and the concentrations of ozone and fine particles still remain a problem in urban centers. It is well known that impervious surfaces have a swelling effect on air pollutants through road and dried surfaces while vegetation has a filtering effect by absorbing and holding air pollutants and by offsetting absorptive heating through evapo-transpiration. The impervious surface in the study site is located in a relatively flat and low altitude area, surrounded by mountains. Such landform conditions could make the heavy, mist-laden air remain more or less stagnant. The ozone, sulfur dioxide, nitrogen dioxide, and suspended particulate matter over an impervious surface may damage the lungs, disturb the bronchial functions, and elicit clinical episodes of asthma in asthmatics.
In many GIS-based analyses, obtaining accurate
and current data is often a problem and this study is not an exception. A major drawback to the data used in this analysis is that asthma hospitalization records only provide instances of hospital admissions, and do not reflect the magnitude of the childhood asthma problem.
Asthma hospitalization records represent only one set of asthma patients, generally corresponding to the most severe cases, they do not represent the prevalence of the disease, or the locations of people with asthma (Maantay, 2007). Multiple admissions of the same individual for the same illness could be a valid and useful way to quantify the severity of asthma in a region. Since individual identifiers were not present in the admission data, multiple hospitalizations of a single patient could not be investigated.
The hospitalizations database does not represent if those being hospitalized for asthma were at the same residence for three years.
There was no longevity of residency requirements when selecting the data for analysis. To achieve any degree of reliability in investigating changing dynamics of asthma prevalence, patient information with high temporal frequency is needed for the precise description of the actual situation, for realistic monitoring purposes.
However, in this experiment, there were insufficient data to explain asthma hospitalization on a multi-sequential basis. In this regard, results such as those referred to above provide realistic possibilities for using this approach in the analysis of changing dynamics of asthma hospitalizations in impervious surface areas.
5. Conclusion
The objectives of the present study were to assess whether the impervious surface as a thematic parameter of analysis is realistically based on the nature of the childhood asthma burdens and that such theoretical rationale leads
researchers to carry out more focused analyses on the population under study. The study allowed innovative observations that should be useful to other researchers and health professionals considering the impervious surface as an analysis parameter for childhood asthma.
The intensive investigation of a three year timescale in this project provided a solid basis for spatio-temporal variation of asthma. A comprehensive picture of the impervious surface extracted from the satellite image, and a multi-temporal representation of the asthma changing trends played a key role in deriving answers for analysis parameter associated to childhood asthma hospitalization. It is noted that the impervious surface could represent an indicative factor to combine several potentially conflicting factors associated with childhood asthma such as vegetation cover, water resource, land use pattern, building density and road density. The impervious surface as an aggregated parameter would better reflect the demographic group being affected as it clearly delineates the boundaries of the urban zone. Understanding these patterns may provide greater insight about the analysis parameter of childhood asthma episodes and lead to improved management strategies. Given that many metropolises face the growing problems caused by urban sprawl or restless suburban development, the technical framework developed in the current study focusing on Daegu, South Korea can be easily applicable to other urban impervious areas.
Acknowledgement
Thanks are extended to the different national agencies of South Korea (National Health Insurance Corporation, Korea Central Statistical Office, National Geographic Information Institute Spatial Data Warehouse, Korean Satellite Imagery Information Management Center) for sharing
their data for this project. Special thanks go to Mr. Gi-Dong, Shin who provided active support in the process of GIS data base generation.
References
Aligne, C., Auinger, P., Byrd, R. and Weitzman, M., 2000, Risk factors for pediatric asthma―
contributions of poverty, race, and urban residence, American Journal of Resiratory and Critical Care Medicine, 162(3), 455-459.
Arnold, C.L. and Gibbons, C.J., 1996, Impervious surface coverage: the emergence of a key environmental indicator, Journal of the American Planning Association, 62, 243–258.
Au, W.W., 2002, Susceptibility of children to environmental toxic substances, International Journal of Hygiene and Environmental Health, 205 (6), 501-503.
Brabec, E., Schulte, S. and Richards, P.L., 2002, Impervious surface and water quality: A review of current literature and its implications for watershed planning, Journal of Planning Literature, 16 (4), 499–514.
Busse, W. and Mitchell, H., 2007, Addressing issues of asthma in inner-city children, Journal of Allergy and Clinical Immunology, 119(1), 43-49.
CIA, 2008, "Factbook - South Korea." Retrieved 12.1, 2009, from https://www.cia.gov/library/
publications/the-world-factbook/geos/ks.html#
People.
Clark, N.M., Brown, R., Joseph, C.L., Anderson, E.W., Liu, M., Valerio, M. and Gong, M., 2002, Issues in identifying asthma and estimating prevalence in an urban school population, Journal of Clinical Epidemiology, 55 (9), 870-881.
Cloutier, M., Wakerfield, D., Hall, C. and Bailit, H., 2002, Childhood asthma in an urban community: prevalence, care system, and treatment, Chest, 122(5), 1571–1579.
Corburn, J., Osleeb, J. and Porter, M., 2006, Urban asthma and the neighbourhood environment in New York City, Health &
Place, 12 (2), 167-179.
Daegu City Government of South Korea, Ed.
2006, Medium-term environmental protection plan of Daegu.
Daegu City Government of South Korea, 2008, The past and the present of Daegu, http://
www.daegutour.or.kr/tour/tour_a1.html?cate_id
=1010100.
Fitzgerald, E.F., Schell, L.M., Marshall, E.G., Carpenter, D., O, , Suk, W., A, and Zejda, J.E., 1998, Environmental pollution and child health in central and eastern Europe, Environmental Health Perspectives, 106(6), 307-311.
Friedman, M.S., Powell, K.E. and Hutwanger, L., 2001, Impact of changes in transportation and commuting behavior during the 1996 Summer Olympic Games in Atlanta on air quality and childhood asthma, Journal of the American Medical Association, 285(7), 897−905.
Fritz, G.J., Herbarth, O., Schlink, U., Richter, M. and Rehwagen, M., 1998, Urban area pollution profiles and patterns of respiratory disease and allergies, Epidemiology, 9(4), S1-9.
Goldstein, I.F., Arthur, P.H. and Arthur, S.P., 1978, Asthma Alley": a space clustering study of asthma in Brooklyn, New York City, Journal of Asthma Research, 15(2), 81-93.
Graham, L.M., 2004, All I need is the air that I breath: outdoor air quality and asthma, Paediatric Respiratory Reviews, 5 (Supplement 1), S59–S64.
Ha, S.K., 2006, Housing regeneration and building sustainable low-income communities in Korea’, Habitat International, 31(1), 116- 129.
Jackson, E.L., 2003, The relationship of urban design to human health and condition,
Landscape and Urban Planning, 64(4), 191- 200.
Johnston, N.W., Johnston, S.L., Norman, G.R., Dai, J. and Sears, M.R., 2006, The September epidemic of asthma hospitalization: school children as disease vectors, Journal of Allergy and Clinical Immunology, 117(3), 557-562.
Kwon, W., 2007, "Challenges and various developmental strategies in Korean urban/
peri-urban agriculture." 2009, from http://
www.agnet.org/library/eb/577/
Lin, S., Munsie, J.P., , Hwang, S.A., Fitzgerald, E., and Cayo, M.R., 2002, Childhood asthma hospitalization and residential exposure to State route traffic, Environmental Research 88(2), 73-81.
Maantay, J., 2007, Asthma and air pollution in the Bronx: methodological and data considerations in using GIS for environmental justice and health research, Health & Place, 13(1), 32-56.
Matisziw, T.C., Grubesic, T.H. and Wei, H., 2008, Downscaling spatial structure for the analysis of epidemiological data, Computers, Environment and Urban Systems, 32(1), 81-93.
Neidell, M., 2004, Air pollution, health and socio-economic status: the effect of outdoor air quality on childhood asthma, Journal of Health Economics, 23(6), 1209-1236.
Rand, C.S., Butz, A.M., Huss, K., Eggleston, P.
and Malveaux, F., 2000, Emergency department visits by urban African American children with asthma, Journal of Allergy and Clinical Immunology, 105(1), 83-89.
Reilly, J., Maggio, P. and Karp, S., 2004, A model to predict impervious surface for regional and municipal land use planning purposes, Environmental Impact Assessment Review, 24(3), 363-382.
Sang, N., Birnie, R.V., Geddes, A., Bayfield, N.G., Midgley, J.L., Shucksmith, D.M. and
Elston, D., 2005, Improving the rural data infrastructure: the problem of addressable spatial units in a rural context, Land Use Policy, 22, 175-186.
Scannel, C., Chen, L. and Aris, R.M., 1996, Greater ozone-induced inflammatory changes in subjects with asthma, American Journal of Respiratory and Critical Care Medicine, 154(1), 2−9.
Shapiro, G.G. and Stout, J.W., 2002, Childhood asthma in the United States: urban issue, Pediatric Pulmonology, 33(1), 47-55.
Shin, G.W. 2006. Blood-based ethnic national identity has hindered cultural and social diversity in Korea. The Korea Herald. Seoul.
Stempel, A.L., Fuhlbrigge, T., McLaughlin, T.B.
and Stanford, R., 2004, Three year examination of trends in asthma-related utilization demonstrate significant variation in resource consumption, Journal of Allergy and Clinical Immunology, 113(2), S252-S253.
Stephen, B., Shaw, M., Todd, W. and Tammo, S.S., 2006, A physical model of particulate wash-off from rough impervious surfaces, Journal of Hydrology, 327(3-4), 618-626.
Tolbert, A.E., Mulholland, J.A. and Mcintosh, D.L., 2000, Air quality and pediatric emergency room visits for asthma in Atlanta, GA, Journal of Public Health, 151(8), 798−
810.
Webber, M., Carpiniello, K., Oruwariye, T. and Appel, D., 2002, Prevalence of asthma and asthma–like symptoms in inner–city elementary schoolchildren, Pediatric Pulmonology, 34(2), 105–111.
Weinberg, G.E., 2000, Urbanization and childhood asthma: an African perspective, Journal of Allergy and Clinical Immunology, 105(2), 224-231.
Williams, R.W., 1999, The contested terrain of environmental justice research: community as unit of analysis, The Social Science Journal,
36(2), 313–328.
Wong, D.N., Budoff, J.M., Pio, J. and Detrano, C.R., 2002, Coronary calcium and cardiovascular event risk: Evaluation by age- and sex-specific quartiles, American Heart Journal, 43(3), 456-459.
Zug, M., Phan, L., Bellefleur, D. and Scrivener,
O., 1999, Pollution wash-off modelling on impervious surfaces: calibration, validation, transposition, Water Science and Technology, 39 (2), 17-24.
(접수: 2010.10.11, 수정: 2010.11.21, 채택: 2010.12.10)