24
†
Corresponding author: (Phone) +82-55-350-1241
(E-mail) [email protected] <Received July 8, 2008>
Interpretation of Agronomic Traits Variation of Sesame Cultivar Using Principal Component Analysis
Kang-Bo Shim*
†, Chung-Dong Hwang**, Suk-Bok Pae**, Jang-Whan Park**, Jae-Cheon Byun**, and Keum-Yong Park**
*International Technical Cooperation Center, Technical Cooperation Bureau, RDA, Suwon 441-707, Korea
**Legume and Oil Crop Research Division, Department of Functional Crop, NICS, Rural Development Administration, Miryang 627-803, Korea
ABSTRACT This study was conducted to evaluate the growth characters and yield components of 18 collected sesame cultivars to get basic information on the variation for the sesame breeding using principal component analysis.
All characters except days to flowering, days to maturity and 1,000 seed weight showed significantly different. Seed weight per 10 are showed higher coefficient of variance.
Capsule bearing stem length and liter weight showed positive correlation with seed yield per 10 are. The principal com- ponents analysis grouped the estimated sesame cultivars into four main components which accounted for 83.7% of the total variation at the eigenvalue and its contribution to total variation obtained from principal component analysis.
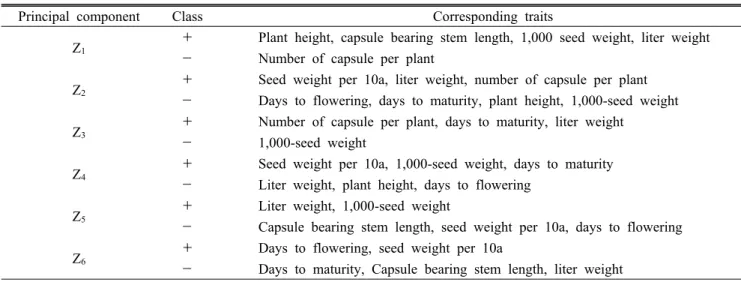
The first principal component (Z
1) was applicable to increase plant height, capsule bearing stem length and 1,000-seed weight. The second principal component (Z
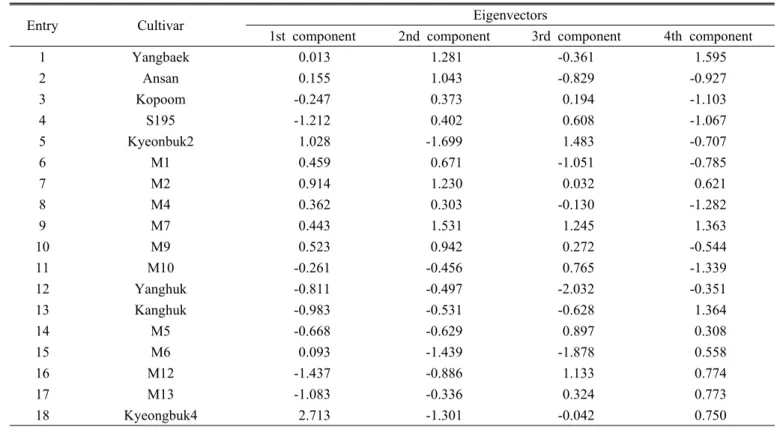
2) negatively correlated with days to flowering and maturity by which it was applicable to shorten flowering and maturity date of sesame. At the scatter diagram, Yangbaek, Ansan, M1, M2, M4, M7 and M9 were classified as same group, but M10, Yanghuk, Kanghuk, M5, M6, M12 and M13 were classified as different group. This results would be helpful for sesame breeder to understand genetic relationship of some agrono- mic characters and select promising cross lines for the development of new sesame variety.
Keywords : sesame, principal component analysis, eigenvalue, degree of contribution
Different statistical techniques have been used in model- ing crop yield, including correlation, regression and principal component analysis. Correlation coefficient is an important
stastical procedure to evaluate breeding program for high yield, as well as to examine direct and indirect contribution of yield variables (Mohamed, 1999). The principal component analysis is a multivariate statistical technique for exploration and simplifying complex data sets (Everitt et al., 1992). Each principal component is a linear combination of the original variables, and so it is often possible to ascribe the meaning to what the components represent. Lee et al. (1982) and Park et al. (1982) classified sesame varieties into several groups on the sensitivity of day length as one group with higher sensitivity to both short and long day, another group with only higher sensitivity to short day, the other group with lower sensitivity to both short and long day. Ahn et al. (1984) reported that total fourteen sesame varietal groups were classified by Mahalanobias’ distance (D
2), cluster, prin- cipal component analysis to identify their affinity. The pur- pose of this study is to provide theoretical foundations to help sesame breeders who are studying genetic correlation of the main agronomic characters and their influence in sesame productivity.
MATERIALS AND METHODS
The experiment were conducted at the Yeongnam Agri- cultural Research Institute, Miryang, using total eighteen promising sesame cultivars in 2005 and 2006 (Table 1).
Sowing date was May 15 and a randomized complete block design with three replications was used for this experiment.
Spacing between plants was 10 cm and row spacing was
30 cm in a 70 cm wide black polyethylene film mulching
bed. Days to flowering was from sowing day to the time
Table 1. Basic agronomic characters statistics of eighteen sesame cultivars
Variety SCC
†DTF DTM PH (cm) CBSL NCP TSW (g) LW (g/L) SW (kg/10a)
Yangbaek White 44 86 129 107 82 2.86 635 97
Ansan White 44 85 131 113 72 2.76 647 81
Kopoom White 45 86 132 110 80 2.65 619 77
S195 White 45 86 126 100 87 2.59 626 77
Kyeonbuk2 White 48 90 138 112 75 2.74 646 71
M1 White 45 85 132 112 65 2.80 643 85
M2 White 45 86 136 117 74 2.77 640 104
M4 White 45 86 135 114 76 2.73 637 74
M7 White 45 86 133 119 95 2.74 637 104
M9 White 45 86 133 121 74 2.65 631 92
M10 White 47 86 130 109 83 2.67 624 72
Yanghuk Black 45 85 129 104 62 2.73 502 68
Kanghuk Black 46 86 127 103 78 2.73 493 80
M5 Black 46 88 127 112 83 2.59 550 75
M6 Black 46 87 129 110 58 2.89 523 62
M12 Black 46 88 122 104 95 2.64 548 66
M13 Black 45 88 123 105 81 2.64 562 76
Kyeongbuk4 Black 47 90 144 125 61 3.02 655 77
†
SCC: Seed coat color, DTF: Days to flowering, DTM: Days to maturity, PH: Plant height, CBSL: Capsule bearing stem length, NCP: Number of capsule per plant, TSW: 1,000-seed weight, LW: Liter weight, SW: Seed weight per 10a.
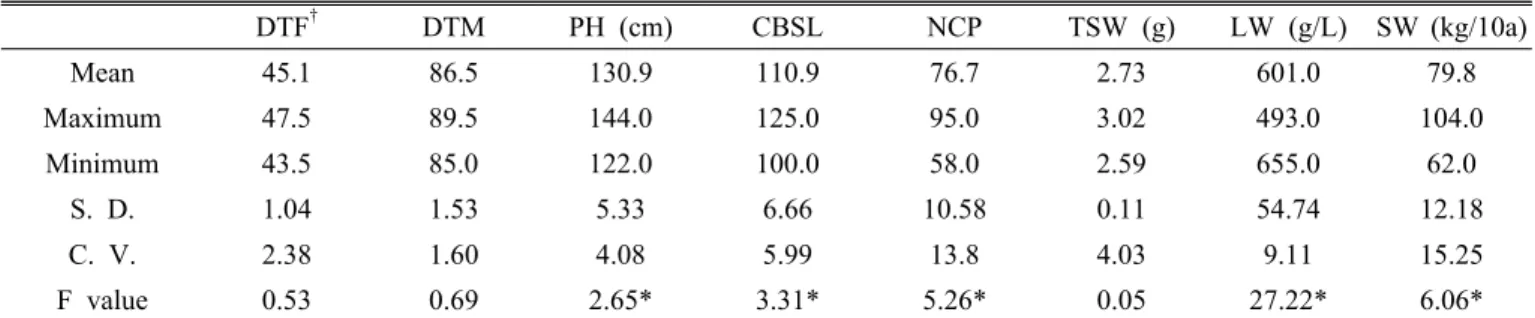
Table 2. Statistic data for the estimated agronomic characters of sesame cultivars
DTF
†DTM PH (cm) CBSL NCP TSW (g) LW (g/L) SW (kg/10a)
Mean 45.1 86.5 130.9 110.9 76.7 2.73 601.0 79.8
Maximum 47.5 89.5 144.0 125.0 95.0 3.02 493.0 104.0
Minimum 43.5 85.0 122.0 100.0 58.0 2.59 655.0 62.0
S. D. 1.04 1.53 5.33 6.66 10.58 0.11 54.74 12.18
C. V. 2.38 1.60 4.08 5.99 13.8 4.03 9.11 15.25
F value 0.53 0.69 2.65* 3.31* 5.26* 0.05 27.22* 6.06*
†
DTF: Days to flowering, DTM: Days to maturity, PH: Plant height, CBSL: Capsule bearing stem length, NCP: Number of capsule per plant, TSW: 1,000-seed weight, LW: Liter weight, SW: Seed weight per 10a.
*Significant at the 5% level
that one of buds in plant was bursting, and days to maturity was from sowing day to the time that one of capsules in plant was dehiscent.
Variance of some agronomic characters were analyzed.
Correlation coefficient and principal component analysis using SAS program (proc princomp) was conducted to identify relationship of some agronomic characters of sesame.
RESULTS AND DISCUSSION
Simple correlation analysis of agronomic characters
Table 2 showed mean values, standard deviation and F
values for all estimated variables of sesame. All variables
except days to flowering, days to maturity and 1,000 seed
weight showed significantly different. Seed weight per 10
Table 3. A matrix of simple correlation coefficients for the estimated variables of sesame cultivar
Traits X1 X2 X3 X4 X5 X6 X7
Days to flowering (X1) 1.000
Days to maturity (X2) 0.735** 1.000
Plant height (X3) 0.307* 0.276 1.000
Capsule bearing stem length (X4) 0.123 0.229 0.807** 1.000
Number of capsule per plant (X5) -0.093 0.001 -0.459* -0.274 1.000
1,000-seed weight (X6) 0.118 0.202 0.618* 0.467* -0.634* 1.000
Liter weight (X7) -0.083 0.030 0.627* 0.578* 0.078 0.205 1.000
Seed weight per 10a (Y) -0.048 -0.329* 0.267 0.433* 0.252 0.108 0.478*
*, **Significant at the 5%, 1% level respectively. ns: Not significant
Table 4. Eigenvalue and its contribution to total variation obtained from principal component analysis.
Principal component Z
1†Z
2Z
3Z
4Z
5Z
6Z
7Eigenvalue 3.135 2.197 1.364 0.473 0.360 0.253 0.142
Proportion (%) 39.19 27.46 17.04 5.92 4.50 3.17 1.78
Cumulative contribution (%) 39.19 66.65 83.69 89.61 94.12 97.28 99.06
†