• 검색 결과가 없습니다.

Factors influencing metabolic syndrome perception and exercising behaviors in Korean adults: Data mining approach

N/A
N/A
Protected

Academic year: 2021

Share "Factors influencing metabolic syndrome perception and exercising behaviors in Korean adults: Data mining approach"

Copied!
8
0
0

로드 중.... (전체 텍스트 보기)

전체 글

(1)

Vol. 18, No. 12 pp. 581-588, 2017

Factors influencing metabolic syndrome perception and exercising behaviors in Korean adults: Data mining approach

Soo-Kyoung Lee

1

, Mikyung Moon

2*

1

College of Nursing, The Research Institute of Nursing Science, Keimyung University

2

College of Nursing, The Research Institute of Nursing Science, Kyungpook National University

대사증후군의 인지와 신체활동 실천에 영향을 미치는 요인 : 데이터 마이닝 접근

이수경1, 문미경2*

1

계명대학교 간호대학, 간호과학연구소

2

경북대학교 간호대학, 간호과학연구소

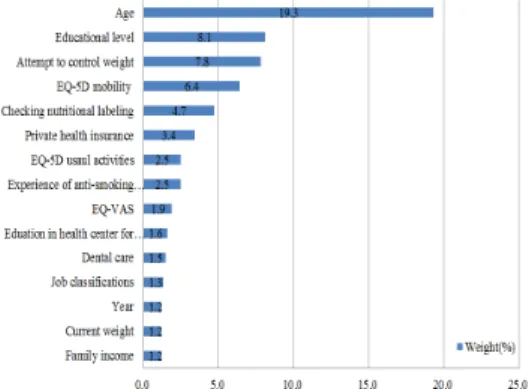
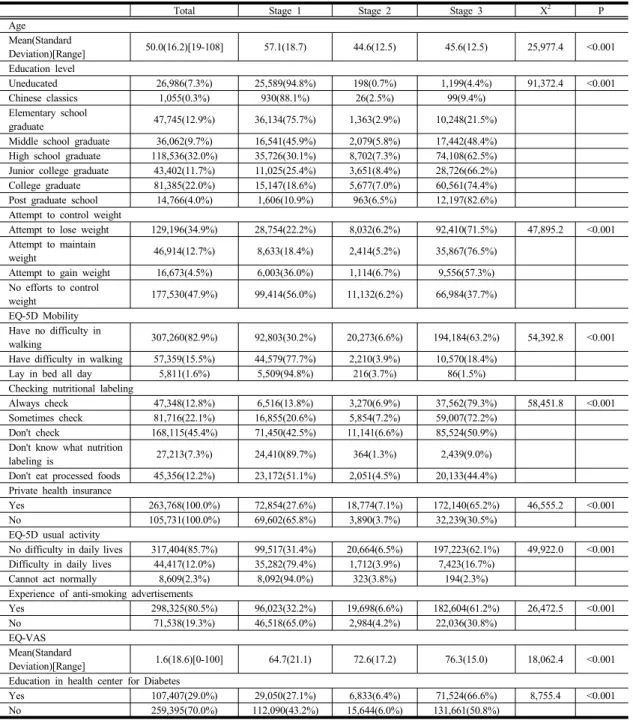
Abstract This study was conducted to determine which factors would predict metabolic syndrome (MetS) perception and exercise by applying a machine learning classifier, or Extreme Gradient Boosting algorithm (XGBoost) from July 2014 to December 2015. Data were obtained from the Korean Community Health Survey (KCHS), representing different community-dwelling Korean adults 19 years and older, from 2009 to 2013. The dataset includes 370,430 adults. Outcomes were categorized as follows based on the perception of MetS and physical activity (PA): Stage 1 (no perception, no PA), Stage 2 (perception, no PA), and Stage 3 (perception, PA). Features common to all questionnaires for the last 5 years were selected for modeling. Overall, there were 161 features, categorical except for age and the visual analogue scale (EQ-VAS). We used the Extreme Boosting algorithm in R programming for a model to predict factors and achieved prediction accuracy in 0.735 submissions. The top 10 predictive factors in Stage 3 were: age, education level, attempt to control weight, EQ mobility, nutrition label checks, private health insurance, EQ-5D usual activities, anti-smoking advertising, EQ-VAS, education in health centers for diabetes, and dental care. In conclusion, the results showed that XGBoost can be used to identify factors influencing disease prevention and management using healthcare bigdata.

요 약 본 연구는 기계 학습법 중 하나인 XGBoost를 이용하여 대사증후군을 인지하고 신체활동을 수행하는 집단을 예측하 고자 2014년 7월부터 2015년 12월까지 시도되었다. 이에 2009-2013년 지역사회건강조사를 연구자료로 사용하였고 370,430 명의 성인을 분석에 포함하였다. 본 연구의 종속변수는 대사증후군의 인지 및 신체활동 실천정도에 따른 단계로 3단계로 구분하였다:Stage 1(무인지, 무 신체활동), Stage 2(인지, 무 신체활동), and Stage 3(인지, 신체활동). 예측변수로는 5년간의 지역사회건강조사 중 공통으로 수집된 문항으로부터 161개의 특성을 선택하였다. 자료 분석을 위해 R program을 이용하여 XGBoost 알고리즘을 적용하였다. 분석 결과 정확도는 0.735 이었으며, 가장 영향을 미치는 10개의 특성은 나이, 교육수준, 체중조절시도 경험, EQ-5D 운동능력, 영양표시 확인, 개인 건강보험가입 유무, EQ-5D 일상활동, 금연광고경험 여부, 통증 유무, 당뇨에 대한 보건기관의 교육 경험 순으로 확인되었다. 본 연구결과는 XGBoost가 보건의료빅데이터를 이용한 질병의 예방과 관리에 영향을 주는 요인을 확인하는데 유용한 도구임을 보여주었다. 또한, 본 연구를 통해 대사증후군에 취약한 계층 을 확인하고 이를 위한 교육프로그램 개발에 도움을 줄 수 있을 것으로 보인다.

Keywords : Healthcare Bigdata, Korean Community Health Survey, Machine Learning, Metabolic Syndrome, XGBoost

This work was supported by the Bisa Research Grant of Keimyung University in 2014.

*

Corresponding Author : Mikyung Moon(Kyungpook National Univ.) Tel: +82-53-200-4793 email: mkmoon@knu.ac.kr

Received November 6, 2017 Revised (1st November 29, 2017, 2nd December 4, 2017)

Accepted December 8, 2017 Published December 31, 2017

(2)

1. Introduction

Metabolic syndrome(MetS) is a cluster of risk factors that increase the development of atherosclerotic cardiovascular disease(ASCVD) as well as other health problems such as diabetes mellitus(DM)[1]. Recent meta-analysis results show that MetS is associated with a 2-fold risk increase for cardiovascular disease(CVD), CVD mortality, myocardial infarction(MI), and stroke, and a 1.5-fold increase in all-cause mortality[2]. Hence, healthcare professionals are concerned about preventing the disease, identifying affected individuals, and intervening to prevent disease progression[3].

Based on the Health Belief Model(HBM), clients' perceptions of the threat posed by a health problem led to improved behavior to avoid the threat[4,5]. The first step for preventing MetS was to percept its risk and be motivated to practice better health behaviors[6]. There was also increased physical activity(PA), being one of the most effective ways to reduce metabolic risk factors, as well as atherosclerotic cardiovascular disease(ASCVD), and weight reduction[7]. PA was significantly associated with a lower prevalence and incidence of MetS and individual risk factors(i.e., high triglyceride(TG) levels) in the general population[8,9].

People must be aware of MetS, and also engage in PA, as that approach is optimal for keeping it under control even preventing it. Those who are more aware of the disease and change their behaviors can aggressively help to prevent MetS.

Although there have been several studies to identify the relationship between MetS and risk factors, including lack of PA, there are few studies dealing with the perception of disease[7,10,11]. One study used a logistic regression model to identify factors in an individual’s metabolic perception and exercise behaviors in the elderly[6]. However, studies dealing with risk factors for MetS often have limitations due to variables selected in advance by the researchers.

Despite deciding on important variables through the literature reviews and using critical thinking, the

factors tested in the studies could have been biased and limited.

There is explosive growth in healthcare data available in the public domain. The KCHS, initiated by Korea Center for Disease Control and Prevention(KCDC), monitors the health status of the Korean population through the collection and analysis of data on a broad range of health topics[12]. The survey data include comprehensive information on pro-health behaviors including PA, sociodemographics, health status, and healthcare utilization[13]. Survey data is a good resource to identify group characteristics engaging in PA and being aware of MetS.

Big data in healthcare, such as KCHS with a variety of variables, is so large and complex that it is often difficult to manage with traditional software or hardware[14]. Data mining is useful for a great deal of data, incorporating some different data(various attributes, text mining), and flexible in modeling(e.g., inclusion of nonlinearity), which could automate most of the analysis process[14]. Data mining can be used for discovering patterns and correlations in a large database. The goal of predictive data mining is to derive models to be used with patient-specific information to anticipate outcomes and support clinical decision-making[15].

Among various methods in data mining, Extreme

Gradient Booting(XGBoost) is a new and impressive

ensemble using the tree method[16]. XGBoost is also

an efficient and scalable variant of the Gradient

Boosting Machine(GBM), which has been an excellent

tool for several machine learning competitions in recent

years; this is due to its salient features such as ease of

use, ease of parallelization, and impressive predictive

accuracy[17,18]. Recently. there were few studies using

EXBoosting with healthcare data – although these

studies showed this method is a powerful method for

classifying a specific patient group(e.g. eplilepsy) with

various types of features or even prediction of

bioactive molecule[17.18]. However, there are still too

few studies using this method in healthcare bigdata.

(3)

Moreover, there is no study to date, dealing with identifying risk factors for specific diseases, particularly, MetS.

Therefore, the purpose of this study was to determine which factors would be most predictive of the group who engaged in PA with a clear perception of MetS, while applying a machine learning classifier, XGBoost.

2. Methods

We used the Extreme Boosting algorithm to classify the group that exercises and perceives MetS. XGBoost implements the concept of Gradient Tree Boosting which is designed to be efficient, accurate, flexible, and portable[16,19,20]. It is used for supervised learning problems, in which we predict target variable y from training data x. Compared to other gradient boosted machines, it relies on a more regularized-model formalization to control over-fitting and recognize scalability and effectiveness in various data mining competitions[16-20].

2.1 Data sources

Data were obtained from the KCHS, which represents community-dwelling Korean adults 19 years and older, from 2009 to 2013. It includes 370,430 adults for the last 5 years[Table 1]. The KCHS was conducted to provide data for planning, implementing, monitoring, and evaluating community health promotion and disease prevention by the KCDC from 253 existing administrative districts in Korea[12]. The survey monitors the health status of the Korean population through collection and analysis of data, using a broad range of health topics. The questionnaires of the survey consist of 10 categories: housing characteristics, health behaviors, immunizations, and screening, chronic disease, hospital utilization, injuries and addiction, limitation of activities, and quality-of-life(QoL), healthcare utilization, the sociophysical environment, and one's education and economic status[12].

2.2 Data preparation 2.2.1 Outcome variables

Outcomes were categorized based on the perception of MetS and PA, which means not only hearing about it, but knowing what it is. PA means walking continuously for over 10 minutes in the last week, moderate PA, or vigorous PA. Depending on the combination of two variables, the groups were divided into 4 categories: Stage 0(no perception, no PA), Stage 1(no perception, no PA), Stage 2(perception, no PA), and Stage 3(perception, PA). For this study, Stage 0 was excluded as the group perceived the analysis as meaningful. Stage 0(758,162) was excluded since the group did not reflect our research interests. Table 1 shows the number of people per group.

    Year    

Stage   2009 2010 2011 2012 2013 Total

1 No perception,

No PA

27,141 29,100 28,877 28,508 29,265 142,891

2 Perception,

No PA 3,467 3,775 3,947 5,854 5,656 22,699 3 Perception,

PA 34,529 34,450 36,101 48,522 51,238 204,840 Total 65,137 67,325 68,925 82,884 86,159 370,430 Table 1. The number of people per group

2.2.2 Feature selection for modeling

The KCHS questionnaire had little difference according to health concerns per year. For this study, a common questionnaire was used for 5 years along with modeling features. Among them, 15 features related to the outcome variables(PA and the perception of Mets) were excluded. Overall, there were 162 features, which were all categorical in nature except for age and EQ-VAS(Pain scale for the European QoL - 5 Dimensions, EQ-5D).

2.3 Model validation technique

The dataset was split: 90% for training and 10% for

test use a random sampling. There was a 10-fold cross

validation to select the optimal parameter values in a

grid-search fashion. The models were trained with

optimal parameter values in the training dataset.

(4)

Optimal parameter values were: max.depth = 3, eta

= 0.3, objective = "multi:softmax," num_class = 3.

Max.depth is the maximum depth of a tree generated during the learning process. The default value for max.depth is 6, whereas we set it as 3 to avoid overfitting problems. If this value is increased, a more complex model would be created, which is likely to overfit. ETA stands for learning rate. The default value(0.3) was used to objectively refer to the function used internally by the algorithm. Multi:softmax is used to allow the algorithm to do a multiclass ordering, since we have 3 target classes. Num_class was set at 3, as we have 3 target classes(i.e., stages).

To build the classifier efficiently, we used the following parameter values: nthread = 8, nfold = 10, and nround = 5. Moreover, nthread refers to the number of threads that allows the algorithm to use them. The more threads, the faster the algorithm will be accomplished. However, too many threads cannot ensure optimal performance; nfold informs the algorithm to do a 10-fold cross-validation, while nround indicates the number of boosting rounds. We could not obtain better performance when we set nround to be greater than 6.

2.4 Evaluation criteria for model and performance evaluation

Accuracy, recall and precision were used for performance evaluation. Accuracy is a value that indicates the ratio of correctly identified data with all testing data. Recall is the ratio of positive cases that were correctly identified with the total number of positive cases. Precision is the ratio of those correctly predicted compared to the total predicted[21].

2.5 System specification

All experiments were performed on a machine with Xeon CPU 2.60GHz, 94 GB memory, while Ubuntu 14.04. R 3.2.1(London, UK) was used to run the code.

The XGBoost package was used to build the classifier and to predict factors.

2.6 Additional statistical analysis

Chi-square analysis and one-way ANOVA were conducted to help explain the relation between the top 10 predictive factors and stages.

3. Results

3.1 Basic characteristics of study participants

A total of 370,430 subjects were included for the final modeling. 42.9%(n=158,980) of the subjects were male. The mean age of them was 50.0(Standard deviation=16.2) years ranged from 19 to 108. The most common education level was high school graduate(32.0%, n=118,536) and most subjects(87.3%, n=323,450) were married. 78.6% answered to their subjective health status positively(from normal to very good). 21.1%, 8%, and 2.2% of them have hypertension, diabetes mellitus, and cerebral infarction.

In addition, 61.4% had experiences about listening or watching for information about MetS.

3.2 Results of XGBoost analysis

Fig. 1. Top 15 features weighted by XGBoost learning

We got over all prediction accuracy of 0.735, precision of 0.77, and recall of 0.73 submissions. Figure 1 shows the top 15 features weighted by XGBoost learning.

Age(19.3%) was identified as the top predictive feature

for Stage 3. Next was education level(8.1%) followed

(5)

  Total Stage 1 Stage 2 Stage 3 X

2

P Age 

Mean(Standard

Deviation)[Range] 50.0(16.2)[19-108] 57.1(18.7) 44.6(12.5) 45.6(12.5) 25,977.4 <0.001 Education level

Uneducated 26,986(7.3%) 25,589(94.8%) 198(0.7%) 1,199(4.4%) 91,372.4 <0.001

Chinese classics 1,055(0.3%) 930(88.1%) 26(2.5%) 99(9.4%)    

Elementary school

graduate 47,745(12.9%) 36,134(75.7%) 1,363(2.9%) 10,248(21.5%)    

Middle school graduate 36,062(9.7%) 16,541(45.9%) 2,079(5.8%) 17,442(48.4%)    

High school graduate 118,536(32.0%) 35,726(30.1%) 8,702(7.3%) 74,108(62.5%)    

Junior college graduate 43,402(11.7%) 11,025(25.4%) 3,651(8.4%) 28,726(66.2%)    

College graduate 81,385(22.0%) 15,147(18.6%) 5,677(7.0%) 60,561(74.4%)    

Post graduate school 14,766(4.0%) 1,606(10.9%) 963(6.5%) 12,197(82.6%)    

Attempt to control weight

Attempt to lose weight 129,196(34.9%) 28,754(22.2%) 8,032(6.2%) 92,410(71.5%) 47,895.2 <0.001 Attempt to maintain

weight 46,914(12.7%) 8,633(18.4%) 2,414(5.2%) 35,867(76.5%)    

Attempt to gain weight 16,673(4.5%) 6,003(36.0%) 1,114(6.7%) 9,556(57.3%)    

No efforts to control

weight 177,530(47.9%) 99,414(56.0%) 11,132(6.2%) 66,984(37.7%)    

EQ-5D Mobility Have no difficulty in

walking 307,260(82.9%) 92,803(30.2%) 20,273(6.6%) 194,184(63.2%) 54,392.8 <0.001

Have difficulty in walking 57,359(15.5%) 44,579(77.7%) 2,210(3.9%) 10,570(18.4%)    

Lay in bed all day 5,811(1.6%) 5,509(94.8%) 216(3.7%) 86(1.5%)    

Checking nutritional labeling

Always check 47,348(12.8%) 6,516(13.8%) 3,270(6.9%) 37,562(79.3%) 58,451.8 <0.001

Sometimes check 81,716(22.1%) 16,855(20.6%) 5,854(7.2%) 59,007(72.2%)    

Don't check 168,115(45.4%) 71,450(42.5%) 11,141(6.6%) 85,524(50.9%)    

Don't know what nutrition

labeling is 27,213(7.3%) 24,410(89.7%) 364(1.3%) 2,439(9.0%)    

Don't eat processed foods 45,356(12.2%) 23,172(51.1%) 2,051(4.5%) 20,133(44.4%)     Private health insurance

Yes 263,768(100.0%) 72,854(27.6%) 18,774(7.1%) 172,140(65.2%) 46,555.2 <0.001

No 105,731(100.0%) 69,602(65.8%) 3,890(3.7%) 32,239(30.5%)    

EQ-5D usual activity

No difficulty in daily lives 317,404(85.7%) 99,517(31.4%) 20,664(6.5%) 197,223(62.1%) 49,922.0 <0.001

Difficulty in daily lives 44,417(12.0%) 35,282(79.4%) 1,712(3.9%) 7,423(16.7%)    

Cannot act normally 8,609(2.3%) 8,092(94.0%) 323(3.8%) 194(2.3%)    

Experience of anti-smoking advertisements

Yes 298,325(80.5%) 96,023(32.2%) 19,698(6.6%) 182,604(61.2%) 26,472.5 <0.001

No 71,538(19.3%) 46,518(65.0%) 2,984(4.2%) 22,036(30.8%)    

EQ-VAS Mean(Standard

Deviation)[Range]  1.6(18.6)[0-100]  64.7(21.1) 72.6(17.2)  76.3(15.0) 18,062.4 <0.001 Education in health center for Diabetes

Yes 107,407(29.0%) 29,050(27.1%) 6,833(6.4%) 71,524(66.6%) 8,755.4 <0.001

No 259,395(70.0%) 112,090(43.2%) 15,644(6.0%) 131,661(50.8%)    

Table 2. The comparison of stage according to the top 10 features by the attempt to control weight(7.8%), and the

European QoL 5 Dimension(EQ-5D) mobility(6.4%).

3.3 Comparisons of stages according to the top 10 features

The relationship between the top features and

outcome stages are summarized in Table 3. There are

significant differences with these features according to

outcome stages. Subjects in Stage 1 are significantly

older than those in the other stages. Subjects in Stage

3 had a significantly higher proportion of those with

advanced education, so attempts to control body

(6)

weight, no difficulty in walking, checking nutritional labeling, better private insurance, and have no difficulty in their daily lives, Experience of anti-smoking advertisements, higher EQ-VAS score, and education in health centers for diabetes.

4. Discussion

This study was conducted to identify factors associated with the stages of MetS and PA using secondary data obtained from the 2009-2013 KCHS. A powerful machine learning tool, XGBoost, was used for data analysis. The large dataset in the study was representative of community-dwelling Korean adults and includes over one hundred seventy variables related to health status.

Based on the machine learning results, age, educational level, weight control, EQ-5D mobility, private health insurance, and EQ-5D usual activity, Experience with anti-smoking advertisements, EQ-VAS, and education in health centers for diabetes mellitus were the top 10 factors for predicting Stage 3, especially for those who were aware of MetS and engaged in PA.

First, age and educational level were the most predictive factors classifying stages. A person who did not know about MetS and did not engage in PA was significantly older than others(over 10 years) and had lower educational levels. In this sense, it was difficult to compare results directly, because there were no studies related to MetS risk factors using data mining methods. However, the results did share strong connection to that of previous studies: how MetS risk decreased in the group with higher education levels[10,22]. This could mean that less educated and older people could be the vulnerable group at risk for MetS. Therefore, there is an educational program to encourage its awareness along with need for consistent PA in this group.

The results of this study show that people with

experience in attempting to control body weight and checking the nutritional labeling tend to be much more perceptive about MetS and engaged in PA. The results were similar to the study of Lee and colleagues[6]’

regarding the elderly. This could mean that those who are actively concerned about health and practice good health behaviors also decrease MetS risks. In addition, three dimensions(mobility, usual activities, and pain) among EQ-5D were important factors related to group classifications. The EQ-5D is a measurement for assessing QoL. It consists of values based on a subject's mobility, self-care, usual activities, pain/discomfort, and anxiety/depression[23]. The results of this study point out that the current physical status related to QoL was an important factor in terms of perception and remaining involved with PA. It would be natural for people with higher mobility, along with the usual ability for daily activity, as well as less pain can do more exercise for their health. Moreover, Korean and US national survey studies showed that people with MetS had lower(health-related) QoL issues[24,25]. The group with both problematic health and QoL concerns(such as less mobility) would tend to be a higher risk group for MetS; in order to increase PA for people with limited mobility, some programs have been developed for exercise in bed.

Lastly, this study suggested that the data mining approach, particularly XGBoost, is useful for managing and analyzing big data, as it is both large and complex.

Studies using healthcare data ming are increasing due

to the explosion of healthcare bigdata[14]. There are

popular data mining methods such as the decision tree,

Support Vector Machines(SVM), Random Forest(RF),

and Artificial Neural Networks(ANN)[14]. However,

these methods often have weaknesses and learning

constraints such as accuracy, interpretability, and

efficiency[10]. Our study, which was the first trial to

use XGBoost for prediction in risk group, showed that

the XGBoost algorithm is faster, more accurate,

flexible, and portable - and does not require

manipulation of data, vs. other mining methods.

(7)

5. Conclusion

This study used an Extreme Gradient Boosting method to predict the group who took part in PA and correctly perceived MetS. The most weighted 15 factors were identified, and the relationship between these top factors and stages were able to shed a great deal of light on characteristics of the group. The results also highlighted age, education level, health, and QoL, along with the other usual pro-health activities, which were important factors in preventing MetS. The study has some limitation, however, because it did not compare performance with other data mining classifiers – including measures such as the area under the receiver operating characteristic curve(ROC-AUC).

However, it clearly addressed how XGBoost can be used to identify factors influencing disease prevention, often as a preliminary analysis for bigdata with various but relevant variables.

References

[1] S. M. Grundy, J. I. Cleeman, S. R. Daniels, K. A.

Donato, R. H. Eckel, B. A. Franklin, D. J. Gordon, R.

M. Krauss, P. J. Savage, S. C. Smith, J. A. Spertus,

“Diagnosis and management of the metabolic syndrome”, Circulation, vol. 112, no. 17, pp. 2735-52, 2005.

DOI: https://doi.org/10.1161/CIRCULATIONAHA.105.169404 [2] S. Mottillo, K. B. Filion, J. Genest, L. Joseph, L. Pilote,

P. Poirier, S. Rinfret, E. L. Schiffrin, M. L. Eisenberg,

“The metabolic syndrome and cardiovascular risk: a systematic review and meta-analysis”, Journal of the American College of Cardiology, vol. 56, no. 14, pp.

1113-32, Sep 28, 2010.

DOI: https://doi.org/10.1016/j.jacc.2010.05.034

[3] J. O. Hill, D. Bessesen, “What to do about the metabolic syndrome?”, Archives of internal medicine, vol. 163, no.

4, pp. 395-7, 2003.

DOI: https://doi.org/10.1001/archinte.163.4.395

[4] M. F. Jumean, Y. Korenfeld, V. K. Somers, K. S.

Vickers, R. J. Thomas, F. Lopez-Jimenez, “Impact of diagnosing metabolic syndrome on risk perception”, American journal of health behavior, vol. 36, no. 4, pp.

522-3, Jul 1, 2012.

DOI: https://doi.org/10.5993/AJHB.36.4.9

[5] K. Glanz, B. Rimer, K. Viswanath, eds. Health behavior and health education: theory, research, and practice. John Wiley & Sons, 2008.

[6] J. A. Lee, J. S. Lee, J. H. Park, “Metabolic syndrome perception and exercise behaviors in the elderly”, Korean Journal of Health Education and Promotion, vol. 29, No. 5. pp. 61-75, 2012.

[7] K. J. Stewart, A. C. Bacher, K. Turner, J. G. Lim, P. S.

Hees, E. P. Shapiro, M. Tayback, P. Ouyang, “Exercise and risk factors associated with metabolic syndrome in older adults.” American journal of preventive medicine, vol. 28, no. 1 pp. 9-18, Jan, 2005.

DOI: https://doi.org/10.1016/j.amepre.2004.09.006 [8] J. R. Churilla, E. C. Fitzhugh, “Relationship between

leisure-time physical activity and metabolic syndrome using varying definitions: 1999-2004 NHANES”, Diabetes and Vascular Disease Research, vol. 6, no. 2 pp. 100-9, Apr, 2009.

DOI: https://doi.org/10.1177/1479164109336040 [9] S. K. Park, J. L. Larson, “The relationship between

physical activity and metabolic syndrome in people with chronic obstructive pulmonary disease”, The Journal of cardiovascular nursing, vol. 29, no. 6, pp. 499, Nov, 2014.

DOI: https://doi.org/10.1097/JCN.0000000000000096 [10] A. Bener, M. T. Yousafzai, S. Darwish, A. O.

Al-Hamaq, E. A. Nasralla, M. Abdul-Ghani, “2013.

Obesity index that better predict metabolic syndrome:

body mass index, waist circumference, waist hip ratio, or waist height ratio”, Journal of obesity, 2013.

DOI: https://doi.org/10.1155/2013/269038

[11] A. Scuteri, S. Laurent, F. Cucca, J. Cockcroft, P. G.

Cunha, L. R. Mañas, F. U. M. Raso, M. L. Muiesan, L.

Ryliškytė, E. Rietzschel, J. Strait, “Metabolic syndrome across Europe: different clusters of risk factors”, European journal of preventive cardiology, vol. 22, no.

4, pp. 486-491, 2015.

DOI: https://doi.org/10.1177/2047487314525529 [12] Y. T. Kim, B. Y. Choi, K.O. Lee, H. Kim, J. H. Chun,

S. Y. Kim, D. H. Lee, T. A. Ghim, D. S. Lim, Y. W.

Kang, T. Y Lee, “Overview of Korean Community Health Survey”, Journal of the Korean Medical Association/Taehan Uisa Hyophoe Chi, vol. 55, no. 1, pp. 74-83, 2012.

[13] K. H. Choi, J. Heo, S. Kim, Y. J. Jeon, M. Oh, “Factors associated with breast and cervical cancer screening in Korea: data from a national community health survey”, Asia Pacific Journal of Public Health, vol. 25, no. 6, pp.

476-86, 2013.

DOI: https://doi.org/10.1177/1010539513506601 [14] W. Raghupathi, V. Raghupath, "Big data analytics in

healthcare: promise and potential.", Health information science and systems, vol. 2, no. 1, pp. 3, 2014.

[15] R. Bellazzi, B. Zupan, “Predictive data mining in clinical medicine: current issues and guidelines”, International journal of medical informatics, vol. 77, no. 2 pp. 81-97, Feb 29, 2008.

DOI: https://doi.org/10.1016/j.ijmedinf.2006.11.006 [16] T. Chen, C. Guestrin, "Xgboost: A scalable tree boosting

system.", In Proceedings of the 22nd ACM sigkdd international conference on knowledge discovery and data mining, pp. 785-794. ACM, 2016.

DOI: https://doi.org/10.1145/2939672.2939785

[17] I. Babajide Mustapha, F. Saeed, “Bioactive molecule

(8)

prediction using extreme gradient boosting”, Molecules, vol. 21, no. 8, pp. 983, Jul 28, 2016.

DOI: https://doi.org/10.3390/molecules21080983 [18] L. Torlay, M. Perrone-Bertolotti, E. Thomas, M. Baciu,

“Machine learning – XGBoost analysis of language networks to classify patients with epilepsy”, Brain Informatics, vol. 22, no. 1, April, 2017.

[19] A. M. Arymurthy, “Predicting the status of water pumps using data mining approach. InBig Data and Information Security (IWBIS)”, International Workshop, IEEE, pp.

57-64, Oct, 2016.

DOI: https://doi.org/10.1109/IWBIS.2016.7872890 [20] P. Ajit, “Prediction of Employee Turnover in

Organizations using Machine Learning Algorithms”, algorithms, vol. 4, no. 5, pp. C5, 2016

[21] M. Sokolova, G. Lapalme, “A systematic analysis of performance measures for classification tasks.”, Information Processing & Management, vol. 31, no. 4, pp. 427-37, July, 2009.

DOI: https://doi.org/10.1016/j.ipm.2009.03.002

[22] B. T. Tran, B. Y. Jeong, J. K. Oh, “The prevalence trend of metabolic syndrome and its components and risk factors in Korean adults: results from the Korean National Health and Nutrition Examination Survey 2008 – 2013”, BMC Public Health, vol. 1, no. 17, pp. 1-8, 2017.

DOI: https://doi.org/10.1186/s12889-016-3936-6 [23] R. Brooks, E. Group, “EuroQol: the current state of

play”, Health policy, vol. 37, no. 1, pp53-72, July, 1996.

DOI: https://doi.org/10.1016/0168-8510(96)00822-6 [24] S. S. Park, Y. S. Yoon, S. W. Oh, “Health-related

quality of life in metabolic syndrome: The Korea National Health and Nutrition Examination Survey 2005”, diabetes research and clinical practice, vol. 91, no. 3, pp. 381-8, Mar 31, 2011.

[25] E. S. Ford, C. Li, “Metabolic syndrome and health-related quality of life among US adults”, Annals of epidemiology, vol. 18, no. 3 pp. 165-71, Mar 31, 2008.

DOI: https://doi.org/10.1016/j.annepidem.2007.10.009

Soo-Kyoung Lee [Regular member]

•Feb. 1994 : Yonsei Univ., Nursing, BS

•Aug. 2005 : Yonsei Univ., Public Health, MPH

•Aug. 2013 : Seoul Univ., Healthcare Management and Informatics, Ph.D.

•Mar. 2014 ∼ present: Keimyung Univ., Nursing, Assistant Professor

<Research Interests>

Medical & nursing informatics, Health Big Data, Machine Learning, Network Analysis, m-Health

Mikyung Moon [Regular member]

•Feb. 2000 : Kyungpook Nat’l Univ., Nursing, BS

•Aug. 2002 : Kyungpook Nat’l Univ., Nursing, MS

•Aug. 2011 : Univ. of Iowa, Nursing, Ph.D.

•Mar. 2012 ∼ Feb. 2015 : Keimyung Univ., Nursing, Assistant Professor

•Mar. 2015 ~ present : Kyungpook Nat’l Univ., Nursing, Assistant Professor

<Research Interests>

Nursing management, Nursing Informatics

수치

Fig. 1. Top 15 features weighted by XGBoost learning
Table 2. The comparison of stage according to the top 10 features by the attempt to control weight(7.8%), and the

참조

관련 문서

Objective: This study was conducted to identify the association between vitamin D and Sarcopenia among all adults in Korea using data from the National Health and

Serum uric acid levels and risk for vascular disease in patients with metabolic syndrome... Prevalence if the metabolic syndrome in a Turkish

This study aims to examine the effects of fun factors on exercise commitment and schol happiness in school sports club activity.. The population was

Objective: This study was conducted to identify the association between vitamin D and osteosarcopenia among all adults in Korea using data from the Korea National Health

In addition, measurements at 0 and 12 weeks (body composition, α-amylase, metabolic syndrome related factors) were performed twice. For 12 weeks, the

data mining - process of applying machine learning, visualization, statistical analysis. knowledge discovery &amp; construction - evaluation &amp; interpretation of the extracted

Conclusions: This study suggests that psychological health factors such as stress perception, depression and suicidal ideation are related to the quality of sleep

This study was conducted to examine the satisfaction of blended learning classes using online videos with Korean elementary and middle school students and