Original Article
Intraocular Pressure Changes after Vitrectomy with and without Combined Phacoemulsification and
Intraocular Lens Implantation
Hee Kyung Yang
1,2, Se Joon Woo
1,2, Kyu Hyung Park
1,2, Ki Ho Park
2,31
Department of Ophthalmology, Seoul National University Bundang Hospital, Seongnam, Korea
2
Department of Ophthalmology, Seoul National University College of Medicine, Seoul, Korea
3
Seoul Artificial Eye Center, Seoul National University Hospital Clinical Research Institute, Seoul, Korea
Purpose: To determine sequential intraocular pressure (IOP) changes after pars plana vitrectomy (PPV) with or without combined phacoemulsification and intraocular lens implantation (PE & IOL).
Methods: Consecutive patients who underwent PPV with PE & IOL (combined group) or without PE & IOL (vitrectomy group) were reviewed for postoperative sequential IOPs and the number of IOP lowering medications used. Of the 68 patients (68 eyes) who underwent simple PPV, 41 eyes were allocated to the vitrectomy group, and 27 eyes to the combined group.
Results: The mean IOPs were higher on postoperative days one and two, as compared to preoperative values, in both groups. The mean IOP changes on postoperative day one (10.0 mmHg vs. 5.3 mmHg, p = 0.02) and day two (3.7 mmHg vs. 1.3 mmHg, p = 0.02) were significantly higher in the combined group.
Conclusions: Phacovitrectomy is associated with a higher risk of IOP elevation during the early postoperative period than PPV alone. Caution should be exercised in patients who are vulnerable to IOP fluctuations when combined surgery is indicated.
Key Words: Intraocular lens implantation, Intraocular pressure, Pars plana vitrectomy, Phacoemulsification
ⓒ2010 The Korean Ophthalmological Society
This is an Open Access article distributed under the terms of the Creative Commons Attribution Non-Commercial License (http://creativecommons.org/licenses /by-nc/3.0/) which permits unrestricted non-commercial use, distribution, and reproduction in any medium, provided the original work is properly cited.
Received: October 7, 2009 Accepted: July 8, 2010
Reprint requests to Kyu Hyung Park. Department of Ophthalmology, Seoul National University Bundang Hospital, #166 Gumi-dong, Bundang- gu, Seongnam 463-707, Korea. Tel: 82-31-787-7373, Fax: 82-31-787- 4057, E-mail: [email protected]
* This article was presented at the Association for Research in Vision and Ophthalmology 2007 annual meeting, Fort Lauderdale, FL, USA, May 2007.
Cataract surgery combined with pars plana vitrectomy (PPV) has become more common since the development of the phaco- vitrectomy technique. Significant lens opacities frequently de- velop after PPV, especially in patients greater than 60 years of age, and some surgeons prefer phacovitrectomy to avoid the need for subsequent cataract surgery [1,2]. The surgeon usually has the option of choosing between phacovitrectomy and PPV alone in patients with vitreoretinal diseases, under the notion that the surgical outcomes are similar. Many reports have shown that combined cataract extraction and PPV is safe and
effective, providing more rapid visual rehabilitation and having a similar complication rate to that observed in sequential sur- gery [3,4].
Postoperative intraocular pressure (IOP) elevation is a fre- quently encountered complication after PPV. Substantial IOP increase after PPV alone is found in up to 40% of patients within 48 hours [5,6]. Around 15% to 56% of patients develop a tran- sient IOP elevation within a few days after combined PPV and cataract extraction [3-11].
As in many other procedures combined with PPV, combined phacoemulsification and intraocular lens implantation (PE &
IOL) may increase the risk for additional IOP elevation in the early postoperative period. Conversely, the long-term IOP low- ering effect of cataract surgery may lead to decreased IOP in the late postoperative period [12]. We were unable to find any reports comparing postoperative IOP changes after PPV alone versus PPV with PE & IOL through a comprehensive Medline liter- ature search. Therefore, we performed this study to evaluate se- quential IOP changes after PPV with and without combined PE
& IOL and to determine whether combined PE & IOL has any
Table 1. Clinical characteristics of the patients who underwent vitrectomy with (combined group) or without cataract surgery (vitrectomy group)
Vitrectomy group
(n = 41) Combined group
(n = 27) p-value
Age (yr) 63.3 ± 5.5 (55-72) 64.3 ± 3.0 (57-79) 0.06
*Male 19 (46.3) 11 (40.7) 0.42
†Preoperative IOP (mmHg) 14.3 ± 3.0 (9-20) 12.5 ± 2.1 (9-20) 0.01
*Indications for vitrectomy
Proliferative diabetic retinopathy 19 (46.3) 16 (59.3) 0.12
†Macular pucker 9 (22.0) 4 (14.8) 0.41
†Non-diabetic VH 5 (12.2) 6 (22.2) 0.15
†Branched retinal vein occlusion without VH 4 (9.7) 0 (0.0) 0.12
†Vitreomacular traction 0 (0.0) 1 (3.7) 0.40
†Asteroid hyalosis 1 (2.4) 0 (0.0) 0.60
†Central retinal vein occlusion 1 (2.4) 0 (0.0) 0.60
†Values are presented as mean ± SD (range) or number (%).
IOP = intraocular pressure; VH = vitreous hemorrhage.
*
p-value by independent t-test;
†p-value by Pearson’s chi-square test.
significant effect on early or late postoperative IOP changes af- ter PPV.
Materials and Methods
The medical records of 68 patients who underwent PPV with and without cataract extraction were retrospectively reviewed.
Forty-one eyes of 41 patients who underwent PPV alone were allocated to the vitrectomy group, and 27 eyes of 27 patients who underwent PPV with PE & IOL were allocated to the com- bined group. All surgeries were performed by a single, experi- enced vitreoretinal and cataract surgeon (KHP) between October 1, 2005 and October 30, 2006 at Seoul National University Bundang Hospital. Patients who underwent un- complicated cataract surgery with PPV and who were followed for more than three months were enrolled in the study. Patients who underwent simple PPV were also enrolled. Patients with a history of any of the following conditions were excluded from the study: 1) underlying glaucoma, 2) high myopia, 3) prior in- traocular surgery, 4) penetration injury of the eyeball, 5) severe proliferative vitreoretinopathy, 6) severe tractional retinal de- tachment, 7) history of previous uveitis, 8) posterior capsule rupture during phacoemulsification, 9) intraoperative proce- dure, such as silicone oil injection, cryotherapy, scleral buck- ling, intravitreal gas injection, intravitreal triamcinolone in- jection, or 10) endolaser photocoagulation of more than two quadrants of the retina [5,13]. Preoperative data obtained from electronic medical charts included patient age, gender, oper- ative eye, indication for surgery, history of previous ocular sur- gery, IOP, anterior segment findings, and posterior segment findings. Thorough preoperative examinations were performed one to two days before surgery and included IOP measurement with a Goldmann applanation tonometer.
In all cases, a traditional 20-gauge standard three-port PPV was performed. In the combined group, PE & IOL was per- formed before PPV through a 2.75 mm superior clear corneal
incision. A 10-0 nylon suture was applied to the corneal wound if there was any wound leakage. The same ocular viscoelastic device, Healon GV (sodium hyaluronate 1.4%), was used in all cases.
At each postoperative period, IOP, the number of glaucoma medications, complications, such as anterior chamber in- flammation, angle closure, or synechiae, hyphema, vitreous hemorrhage, and secondary glaucoma status were recorded.
Topical antibiotics and topical fluorometholone acetate (0.1%) were routinely used for one month.
Statistical analyses were performed using SPSS ver. 15.0 (SPSS Inc., Chicago, IL, USA). The paired t-test and Wilcoxon signed rank test were used to analyze postoperative IOP changes and the number of glaucoma medications, as com- pared to preoperative data. The IOP ratio (postoperative IOP/preoperative IOP) was compared between the groups at each point using the independent t-test and Mann Whitney U-test. A p-value of < 0.05 was considered to be statistically significant.
Results
The patients’ preoperative data are shown in Table 1.
Preoperative patient characteristics, including age, gender, and ratios of proliferative diabetic retinopathy were not sig- nificantly different between the two groups, but the pre- operative IOP was lower in the combined group (Table 1). The indications for PPV included complications from proliferative diabetic retinopathy (51.5%), such as vitreous hemorrhage and tractional retinal detachment, macular pucker (19.1%), and vit- reous hemorrhage of non-diabetic etiology (16.2%), which were not significantly different between the two groups (Table 1).
Indications for combined cataract surgery included a posterior
subcapsular lens opacity score ≥ 3, nuclear opalescence/color
score ≥ 4, or cortical score ≥ 3, as measured by the Lens
Opacity Classification System III [14]. The IOL was implanted
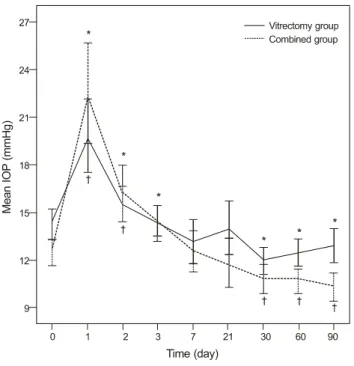
Fig. 1. Sequential changes of postoperative intraocular pressure (IOP) after surgery in the vitrectomy group and combined group.
Compared to the preoperative IOP values, postoperative IOP showed significant difference in early and late postoperative periods in the vitrectomy group and combined group.
*p<0.05 by paired t-test in the vitrectomy group;
†p<0.05 by paired t-test in the com- bined group.
Fig. 2. Comparison of the sequential changes of intraocular pressure (IOP) ratio between the vitrectomy group and com- bined group. The IOP ratios (postoperative IOP/preoperative IOP) were significantly higher in the combined group on post- operative days one and two.
*p<0.05 by independent t-test.
Table 2. The sequential changes of intraocular pressure (IOP) after surgery in the vitrectomy group and the combined group
Vitrectomy group
*Combined group
†Mean IOP (mmHg) Range (mmHg) p-value
‡Mean IOP (mmHg) Range (mmHg) p-value
‡Preoperative 14.3 ± 3.0 9-20 - 12.5 ± 2.1 9-20 -
Postoperative
1 day 19.6 ± 7.2 10-38 < 0.01 22.4 ± 8.1 12-46 < 0.01
2 day 15.5 ± 3.5 9-22 0.03 16.2 ± 4.5 8-29 < 0.01
3 day 14.5 ± 3.1 8-20 0.37 14.4 ± 3.0 8-21 0.01
1 wk 13.2 ± 4.4 7-24 0.05 12.6 ± 3.4 7-19 0.46
3 wk 14.0 ± 5.3 5-31 0.35 11.8 ± 4.0 4-25 0.24
1 mon 11.9 ± 2.6 5-17 < 0.01 10.8 ± 2.3 5-17 < 0.01
2 mon 12.3 ± 3.1 7-22 < 0.01 10.7 ± 2.2 7-18 < 0.01
3 mon 12.9 ± 3.4 7-20 < 0.01 10.3 ± 2.2 6-15 < 0.01
*
Patients who underwent only 20 gauge pars plana vitrectomy;
†Patients who underwent 20 gauge pars plana vitrectomy combined with cataract extraction of phacoemulsification and intraocular lens implantation;
‡p-value by paired t-test after comparison of preoperative and postoperative IOP.
in the bag in all cases.
Postoperative IOP change in the vitrectomy group, showed a significant IOP increase from 14.3 ± 3.0 mmHg (preoperative) to 19.6 ± 7.2 mmHg on postoperative day one (p < 0.01), and 15.5 ± 3.5 mmHg on day two (p = 0.03, paired t-test). The IOP was similar to the preoperative level at postoperative day three, week one, and week three. The IOP was actually lower than preoperative values at one, two, and three months postoper-
atively. In the combined group, a significant IOP increase oc- curred from 12.5 ± 2.1 mmHg (preoperative) to 22.4 ± 8.2 mmHg on postoperative day one (p < 0.01), 16.2 ± 4.5 mmHg on day two (p < 0.01), and 14.4 ± 3.0 mmHg on day three (p <
0.01). The IOP returned to the preoperative level at post- operative weeks one and three. The IOP was significantly low- er than the preoperative values at months one, two, and three (Table 2 and Fig. 1).
IOP spikes ( ≥ 30 mmHg) occurred on postoperative day one
Table 3. Comparison of mean intraocular pressure (IOP) ratio and IOP change (mmHg) between the vitrectomy group and the combined group after surgery
Postoperative period
IOP ratio
*IOP change
†(mmHg)
Vitrectomy group Combined group p-value
‡Vitrectomy group Combined group p-value
§1 day 1.41 ± 0.56 1.83 ± 0.69 <0.01 5.3 ± 7.3 10.0 ± 8.2 0.02
2 day 1.12 ± 0.33 1.32 ± 0.37 0.02 1.3 ± 4.1 3.7 ± 4.6 0.02
3 day 1.04 ± 0.28 1.17 ± 0.27 0.97 0.2 ± 3.7 1.9 ± 3.3 0.05
1 wk 0.93 ± 0.30 1.02 ± 0.28 0.93 -1.1 ± 4.2 0.1 ± 3.6 0.23
3 wk 0.99 ± 0.34 0.98 ± 0.41 0.73 -0.3 ± 4.8 -0.7 ± 4.8 0.76
1 mon 0.86 ± 0.22 0.88 ± 0.23 0.67 -2.4 ± 3.2 -1.7 ± 3.2 0.41
2 mon 0.88 ± 0.22 0.88 ± 0.23 0.97 -2.0 ± 3.3 -1.7 ± 3.1 0.80
3 mon 0.92 ± 0.24 0.84 ± 0.21 0.17 -1.4 ± 3.4 -2.2 ± 3.0 0.33
*
Postoperative IOP/preoperative IOP;
†Postoperative IOP-preoperative IOP;
‡p-value by independent t-test in comparison of the logarithmic value of IOP ratio at each postoperative time-point between the vitrectomy group and the combined group;
§p-value by independent t-test in comparison of the mean IOP change at each postoperative time-point between the vitrectomy group and the combined group.
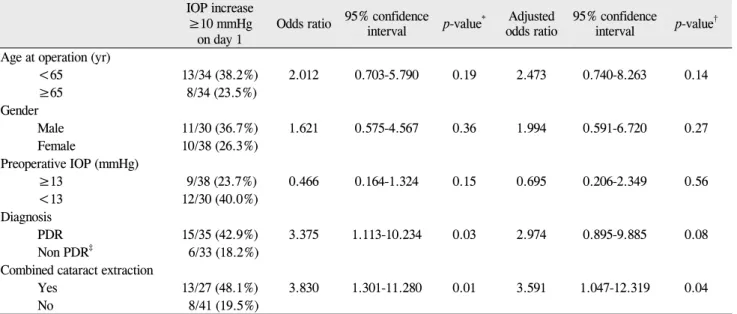
Table 4. Univariate and multivariate analysis for risk factors of early intraocular pressure (IOP) elevation ≥10 mmHg on postoperative day one after vitrectomy
IOP increase
≥10 mmHg
on day 1 Odds ratio 95% confidence interval p-value
*Adjusted
odds ratio 95% confidence
interval p-value
†Age at operation (yr)
<65 13/34 (38.2%) 2.012 0.703-5.790 0.19 2.473 0.740-8.263 0.14
≥65 8/34 (23.5%)
Gender
Male 11/30 (36.7%) 1.621 0.575-4.567 0.36 1.994 0.591-6.720 0.27
Female 10/38 (26.3%)
Preoperative IOP (mmHg)
≥13 9/38 (23.7%) 0.466 0.164-1.324 0.15 0.695 0.206-2.349 0.56
<13 12/30 (40.0%)
Diagnosis
PDR 15/35 (42.9%) 3.375 1.113-10.234 0.03 2.974 0.895-9.885 0.08
Non PDR
‡6/33 (18.2%)
Combined cataract extraction
Yes 13/27 (48.1%) 3.830 1.301-11.280 0.01 3.591 1.047-12.319 0.04
No 8/41 (19.5%)
PDR = proliferative diabetic retinopathy.
*