6 J. Sensor Sci. & Tech. Vol. 24, No. 1, 2015 Journal of Sensor Science and Technology
Vol. 24, No. 1 (2015) pp. 6-9
http://dx.doi.org/10.5369/JSST.2015.24.1.6 pISSN 1225-5475/eISSN 2093-7563
Effect of a Series Connection of a Bi-Electrolyte Hydrogen Sensor in a Leak Detector
Hyeuk Jin Han
1, Chong Ook Park
1,+, Youngkyu Hong
2, Jong Suk Kim
2, Jeong Woo Yang
2, and Yoon Seo Kim
2Abstract
Conventional leak detectors are widely based on helium gas sensors. However, the usage of hydrogen sensors in leak detectors has increased because of the high prices of helium leak detectors and the dearth in the supply of helium gas. In this study, a hydrogen leak detector was developed using solid-state hydrogen sensors. The hydrogen sensors are based on Park–Rapp probes with heterojunctions made by oxygen-ion conducting Yttria-stabilized zirconia and proton-conducting In-doped CaZrO
3. The hydrogen sensors were used for determining the potential difference between air and air balanced 5 ppm of H
2. Even though the Park–Rapp probe shows an excellent selectivity for hydrogen, the sensitivity of the sensor was low because of the low concentration of hydrogen, and the oxygen on the sur- face of the sensor. In order to increase the sensitivity of the sensor, the sensors were connected in series by Pt wires to increase the poten- tial difference. The sensors were tested at temperatures ranging from 500–600
oC.
Keywords: Hydrogen sensors, YSZ, CZI, Bi-electrolyte, Leak detectors
1. INTRODUCTION
Vacuum annealing is essential in OLED designing and semiconductor manufacturing processes. However, during these processes, toxic gases are often used, and therefore, a leak in the annealing machine can be extremely dangerous. Further, a leak at the connecting section of the machine may lead to an explosion.
Therefore, proper leak detectors are required to ensure accuracy, precision, and safety of the process [1].
Conventional leak detectors use helium gas sensors for leak detection. However, although helium is stable and inert, it is expensive, and therefore, it is not economical to use for detection.
Consequently, leak detectors using hydrogen gas sensors were developed to overcome such drawbacks [2].
Hydrogen gas sensors can be classified into three types:
resistive, electrochemical, and electrolyte. The resistive type
sensor uses the properties of an oxide such as tin oxide, and the resistance is dependent on the concentration of H
2. However, the resistance also changes when the sensor is exposed to substances such as CO and ethanol. Therefore, it is difficult to use resistive type sensors as leak detectors [3].
The electrochemical type sensor uses liquids for the measurement of potential differences. It can determine the amount of hydrogen by reactions. However, in low temperatures, the reaction rate is low, and therefore, it becomes difficult to measure the concentration of H
2leaking from the equipment at room temperature [4].
The electrolyte type sensor measures the concentration of hydrogen ions using the potential difference created by the difference between the standard hydrogen ion concentration and the hydrogen ion concentration that we need to measure.
However, it has a drawback in that it is difficult to retain the standard concentration of the hydrogen ions [5].
Conventionally, hydrogen sensors are based on the potential difference created by the difference of H
2concentrations of outer space and the standard concentration. In this research, a Park–
Rapp probe was used as a hydrogen sensor, which comprises a proton conductor (CaZr
0.9In
0.1O
3-δ) and an oxygen ion conductor (yttria-stabilized zirconia). Yttria-stabilized zirconia (YSZ) was used as the standard hydrogen ion concentration detector, by the equilibrium of the reactions between oxygen ions and hydrogen ions [6].
Although the Park–Rapp probe indicated an excellent
1
Department of Materials Science and Engineering, Korea Advanced Institute of Science and Technology,
E4 A304, Korea Advanced Institute of Science, 291, Daehak-ro, Yuseong-gu, Daejeon 305-701, Korea
2
Korea Science Academy, 105-47, Baegyanggwanmun-ro, Busanjin-gu, Busan, Korea
+
Corresponding author: [email protected] (Received : Dec. 30, 2014, Accepted : Jan. 15, 2015)
This is an Open Access article distributed under the terms of the Creative Commons Attribution Non-Commercial License(http://creativecommons.org/
licenses/bync/3.0) which permits unrestricted non-commercial use, distribution,
and reproduction in any medium, provided the original work is properly cited.
Effect of a Series Connection of a Bi-Electrolyte Hydrogen Sensor in a Leak Detector
7 J. Sensor Sci. & Tech. Vol. 24, No. 1, 2015 selectivity for hydrogen, the sensitivity of the sensor in air was
low because of the oxygen on the surface of CaZr
0.9In
0.1O
3-δ(CZI) [7]. Therefore, the sensors were connected in series using Pt wires to increase the sensitivity of the sensor by increasing the potential difference.
2. EXPERIMENTAL
2.1 Development of Hydrogen Sensor
The schematic structure of the hydrogen sensor is illustrated in Fig. 1(a). The structure of the sensor consists of two solid electrolytes and two platinum electrodes. The CZI electrolyte is made of a mixture of CaCO
3(GCM, Korea), ZrO
2(Aldrich), and In
2O
3(Aldrich) powders. The CZI powder was prepared by the same method as reported in the previous study [8]. The YSZ electrolyte was prepared using yttria-stabilized zirconia (8 mol%
Y
2O
3, Tosoh). A double layer of YSZ/CZI powders was pressed into a cylinder-shaped mold. The pressed heterojunction powder was sintered at 1600
oC for 10 h. Platinum pastes were deposited on both sides of the bi-electrolyte and sintered at 1000
oC for 1 h.
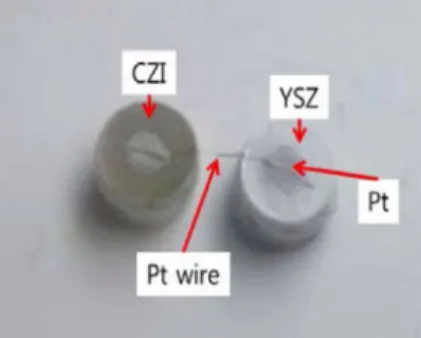
As shown in Fig. 1(b), each completed single sensor is
composed of CZI and YSZ connected by the Pt wire, and the potential difference is measured between the outer ends of YSZ and CZI layers of each sensor. Similarly, three sensors were connected as shown in Fig. 1(c). A photograph of the fabricated sensor (two-set) is shown in Fig. 2.
The schematic structure of the hydrogen sensors and the monitoring system is shown in Fig. 3(a). The hydrogen sensing properties were evaluated in a quartz tube that was loaded in an electrical tube furnace at temperatures ranging from 450–600
oC, as shown in Fig. 3(b). A mixture of 5 ppm hydrogen and air was prepared as a measuring gas. The total gas flow rate was fixed at 100 cm
3/min. The potential difference of the sensor was measured using a high impedance electrometer (Agilent 34972A).
3. RESULTS AND DISCUSSIONS
3.1 Sensing Mechanism
The hydrogen sensor with a bi-electrolyte structure was designed to measure the hydrogen concentration with respect to an oxygen reference, air in this case, where YSZ is adopted as an oxygen-ion conductor and CZI as a proton conductor. The designed electrochemical cell can be described as follows:
Fig. 1. Schematic structure of bi-electrolyte hydrogen sensors; (a) one-set, (b) two-set, and (c) three-set.
Fig. 2. A photograph of the fabricated sensor (two set).
Fig. 3. Monitoring system of Hydrogen sensor; (a) Schematic struc- ture and (b) photograph of the system.
I 7 I
Hyeuk Jin Han, Chong Ook Park, Youngkyu Hong, Jong Suk Kim, Jeong Woo Yang, and Yoon Seo Kim
J. Sensor Sci. & Tech. Vol. 24, No. 1, 2015 8 Pt, O
2(0.21 atm) | YSZ || CZI | H
2, O
2(0.21 atm), Pt (1) At the sensing electrode on the right-hand side, the electrochemical reaction
H
2= 2H
++ 2e
−(2)
occurs along with another simultaneous electrochemical reaction
(1/2) O
2+ 2e
−= O
2−(3).
taking place at the reference electrode on the left-hand side. The overall cell reaction becomes a water formation reaction
H
2+ (1/2) O
2= H
2O (4)
The potential of the cell becomes
(5)
where and P
H2, P
O2, and P
H2Oare
the hydrogen partial pressure at the sensing electrode, the oxygen partial pressure at the reference electrode (= 0.21 atm), and the chemical activity of H
2O at the bi-electrolyte interface, respectively.
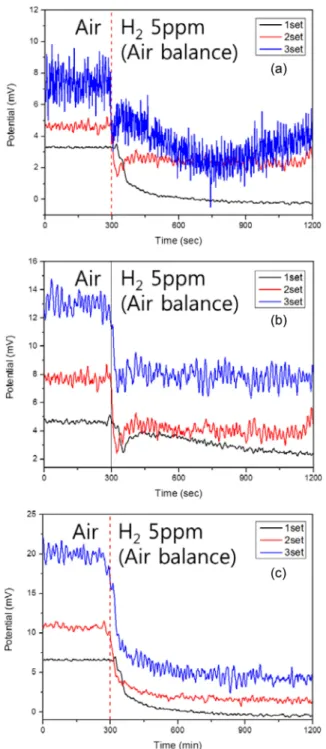
3.2 Sensing Performance
The sensors connected with multiple cells (two-set, three-set) were tested for 5 ppm (air balance) at 500, 550, and 600
oC. Fig.
4(a), (b), and (c) show the response difference as per the number of connected sensors, i.e., Set 1, Set 2, and Set 3, respectively, upon exposure to 5 ppm of hydrogen concentration with corresponding
E G
H2O
Δ
O--- 2F
– RT
2F --- a
H2O
P
H2
P
O2 1 2⁄
--- ln –
=
G
H2O