Effect of Venturi System on Acceleration of Low-speed Water Flow at the Venturi Throat Installed at the Inlet of Hydro Turbine
Sang-Hoon Jung
1․In-Ho Seo
2․Chul-Ho Kim†
(Received October 25, 2011; Revised Novermber 4, 2011; Accepted November, 14, 2011)
Abstract: For a hydro turbine electricity generation system in river or bay, a venturi system could be applied to accelerate flow speed at the inlet of the turbine system in a flow field. In this study, a steady flow simulation was conducted to understand the effect of venturi system on the acceleration of current speed at the inlet of a hydro turbine system. According to the continuity equation, the flow speed is inversely proportional to the cross-section area in a conduit flow; however, it would be different in an open region because the venturi system would be an obstruction in the flow region.
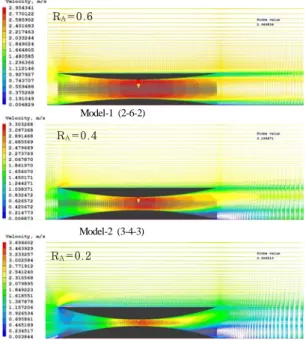
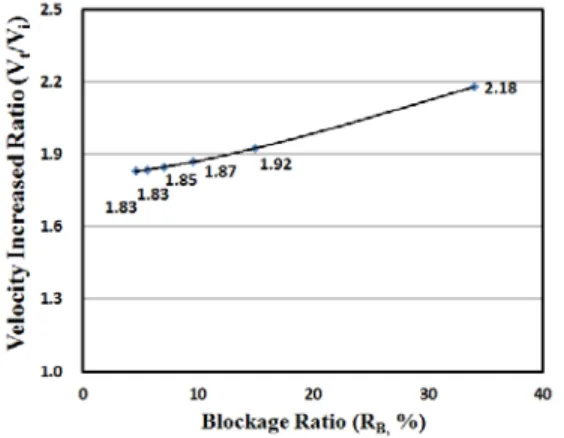
As the throat area is 1/5 of the inlet area of the venturi, the flow velocity is accelerated up to 2.1 times of the inlet velocity. It is understood that the venturi system placed in an open flow region gives resistance to the upcoming flow and disperses the flow energy around the venturi system. The result of the study should be very important information for an optimum design of a hydro turbine electricity generation system.
Key words :venturi system, hydro turbine electricity generation system, Computational Fluid Dynamics(CFD), hydro power turbine, open channel flow
† Corresponding Author(Department of Automotive Engineering, Seoul National University of Science & Technology, Korea, E-mail: [email protected], Tel: +82-2-970-6347)
1,2. Seoul National University of Science & Technology Graduate School of NID Fusion Technology, Korea
This paper is extended and updated from the short version that apeared in the Proceedings of the International
1. Introduction
Due to global warming and limitation of clued oil problem people has been seriously studied to have a solution. One of the representative renewable energy sources can be obtained from ocean and those are the current energy, wave energy, coastal wind power energy and et al.
Among them, the current energy is less affected by the weather condition in nature but the energy conversion efficiency is low when current speed slow in a current electricity generation station.
Because of this reason, a venturi system can be applied to accelerate the current flow in low speed to have higher efficiency of current electricity
generation system.
In this numerical study, an acceleration effect of a venturi system that would be applied to a hydro electricity generation system in a open-channel was studied. Two main design parameters; area ratio (R
A) and blockage ratio (R
B), were incorporated to understand their effects on the flow speed acceleration at the inlet of the electricity generation system.
2. Geometry of the Open-channel and Venturi System for Numerical Study
Figure 1 shows configuration and its dimension
of the model open-channel to see the effect of the
model venturi system installed in it. The length and depth of the channel were fixed to 600m and 10m respectively but the width was varied from 15m to 110m to see the blockage effect of the model venturi system (the width is fixed 10m.) in the flow field.
Figure 2 is the top view of the model open-channel with the model venturi system placed the wall-side and 100m downstream from the inlet.
The length and width of the model venturi-system were fixed to 50m and 10m respectively but the throat width of the venturi was varied from 2m to 6m to understand the acceleration effect of the flow in the throat.
Figure 1: Physical domain of the model flow field : 500m(L)×70m(W)×10m(D)
Figure 2: Top view of the model open-channel with the model venturi system (Model-1) installed in the middle and on the wall side of the flow field
The flow field is extended 450m backward from the exit of the venturi system to have fully developed flow in the numerical domain.
3. Numerical Scheme and Its Condition
In this numerical study, a venturi system has been tested to understand the availability of the system to speedup the flow velocity in a flow field.
3.1 Important Geometry Variables of the Model Venturi System
Area ratio (R
A) and blockage ratio (R
B) are the two main parameters in this study to see their effects on the acceleration of the flow in the throat of the model venturi system.
- Area Ratio(R
A) : R
A= A
t/ A
V- Blockage Ratio(R
B) : R
B= A
v/ A
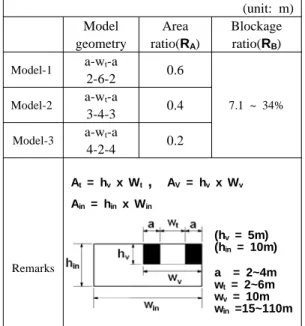
inAs shown in Table 1, the area ratio was varied from 0.2 to 0.6 in 3 steps and the blockage ratio (R
B) was varied from 4.6% to 33.3% in 6 steps with Model-3 (R
A=0.2).
(unit: m) Model
geometry
Area ratio(R
A)
Blockage ratio(R
B) Model-1 a-w
t-a
2-6-2 0.6
7.1 ~ 34%
Model-2 a-w
t-a
3-4-3 0.4
Model-3 a-w
t-a
4-2-4 0.2
Remarks
A
t= h
vx W
t, A
V= h
vx W
vA
in= h
inx W
in(h
v= 5m) (h
in= 10m) a = 2~4m w
t= 2~6m w
v= 10m w
in=15~110m (Front view of the model open-channel with the venturi system placed on the wall-side)
Table 1: Important geometry variables of the
model venturi system
3.2 Numerical Scheme of Flow Analysis
In this study, FVM (Finite Volume Method) [1]
scheme was employed to simulate flow phenomenon around a model venturi system in the open-channel. The water flow field in the control volume is reasonably assumed to be,
- Full 3D flow, - Turbulent flow, - Incompressible flow, - Steady state flow.
The general-purpose CFD code, PHOENICS [2]
(ver. 2009) was used for a numerical calculation of the turbulent incompressible flow field.
3-dimensional Navier-Stokes equations [3] were solved with standard (k-ε) turbulent model [4].
Since the process was assumed as steady state and adiabatic process, the energy equation was not required to be solved in the numerical calculation.
The laminar no-slip condition near solid boundary was modeled by the logarithmic law. Time differencing has been fully implicit backward while advection terms are hybrid differenced. Conjugate gradient technique for pressure corrections in transport equations has been incorporated and 'SIMPLE' algorithm [4] has been employed for the velocity and pressure coupling in this application.
For the convergence of the numerical solution, the iteration was continued until the residual fraction was below 1x10
-4.
3.3 Governing Equations
The basic equations of fluid dynamics in the control volume are based on Navier-Stokes equations [3] that are comprised of equations for conservation of mass and momentum and given as,
(1) Continuity equation
= 0
∂ + ∂
∂ + ∂
∂
∂
i k i
j i
i
z U y U x U
(1)
(2) Momentum equation
i j i i
j j i j i j i j
i uu g
x U x v U x x U P x U t
U
−
⎥ ⎥
⎦
⎤
⎢ ⎢
⎣
⎡ ⎟ ⎟ −
⎠
⎞
⎜ ⎜
⎝
⎛
∂ + ∂
∂
∂
∂ + ∂
∂
− ∂
∂ = + ∂
∂
∂
ρ ) 1 (
(2)
(3) Standard κ-ε turbulent model
- Turbulent kinetic energy equation
σ ⎥ ⎥ ⎦ + − ε
⎤
⎢ ⎢
⎣
⎡
∂
⎟⎟ ∂
⎠
⎜⎜ ⎞
⎝
⎛ +
∂
= ∂
∂
∂ G
x v k x v k
x U
k jt i j i
) (
(3)
- Energy dissipation equation
) (
)
( ε ε
1 2ε
ε σ
ε εε
C G k C x v v U x
x
jt i j i
−
⎥ +
⎥ ⎦
⎤
⎢ ⎢
⎣
⎡
∂
⎟⎟ ∂
⎠
⎜⎜ ⎞
⎝
⎛ +
∂
= ∂
∂
∂
where
i ijj j i t j
i
k
x U x v U u
u δ
3
− 2
⎟ ⎟
⎠
⎞
⎜ ⎜
⎝
⎛
∂ + ∂
∂
= ∂
−
j i j
i