Copyright © 2015 The Korean Society for Bone and Mineral Research
This is an Open Access article distributed under the terms of the Creative Commons Attribution Non-Commercial Li- cense (http://creativecommons.org/licenses/by-nc/3.0/) which permits unrestricted non-commercial use, distribu- tion, and reproduction in any medium, provided the original work is properly cited.
The Reference Value of Skeletal Muscle Mass Index for Defining the Sarcopenia of Women in Korea
Hyoung-Joon Kwon1, Yong-Chan Ha2, Hyoung-Moo Park1
1Department of Obstetrics and Gynecology, Chung-Ang University College of Medicine, Seoul;
2Department of Orthopedic Surgery, Chung-Ang University College of Medicine, Seoul, Korea
Background: Sarcopenia is considering important disease entity in elderly. Several study groups define the sum of the muscle masses of the four limbs as appendicular skeletal mass (ASM) to calculate skeletal muscle index (SMI). The purpose of this study was to determine cut point of SMI for sarcopenia in Korean women. Methods: This study was based on data obtained from the 2008 to 2011 Korean National Health and Nutrition Ex- amination Survey (KNHANES) IV and V. A whole body dual energy X-ray absorptiometry scan were performed on individuals of ≥10 years old from July 2008 to May 2011. In the analysis, 11,633 women were included. ASM was calculated and SMI was obtained as ASM/height2. Cutoff value was defined two standard deviations below mean values for young reference group. Results: Of 11,633 women aged 10 to 97 years, mean and stan- dard deviation of year was 46.73±18.54 years. The highest level of height was noted in 20’s and the highest total sum of skeletal mass was seen 14.87 kg in 40’s. The highest value of SMI was noted in 60’s in Korean women. Cutoff value as mean value of young women was decided with SMI of 30’s and 40’s that have peak ASM. Mean and standard deviation of SMI in those ages was 5.9±0.7 kg/m2. A SMI of two standard deviations be- low the mean SMI of reference groups was 4.4 kg/m2 as cutoff value. Conclusions: This study shows that 4.4 kg/m2 of SMI in Korean women was cutoff value of sarcopenia. Fur- ther study is clearly required to decide cutoff value of SMI for sarcopenia, especially for Korean women.
Key Words: Diagnosis, Muscle skeletal, Sarcopenia
INTRODUCTION
The interest about sarcopenia is growing considerably. In 1989, Rosenberg[1]
proposed the term ‘sarcopenia’ to describe age-related decrease of muscle mass.
Sarcopenia is a syndrome characterized by progressive and generalized loss of skeletal muscle mass and strength with a risk of adverse outcomes such as physi- cal disability, poor quality of life and death.[2,3]
Sarcopenia still has no broadly accepted clinical definition, consensus diagnos- tic criteria, International Classification of Diseases, Ninth Revision (ICD-9) codes or treatment guidelines. The European Working Group on Sarcopenia in Older Peo- ple (EWGSOP) suggests a conceptual staging as ‘presarcopenia’, ‘sarcopenia’, ‘severe sarcopenia’. The ‘presarcopenia’ stage is characterized by low muscle mass without Corresponding author
Hyoung-Moo Park
Department of Obstetrics and Gynecology, College of Medicine, Chung-Ang University, 102 Heukseok-ro, Dongjak-gu, Seoul 156-755, Korea
Tel: +82-2-6299-3172 Fax: +82-2-6263-2187 E-mail: hmpark52@hanmail.net Received: April 27, 2015 Revised: May 28, 2015 Accepted: May 28, 2015
No potential conflict of interest relevant to this article was reported.
impact on muscle strength or physical performance. The
‘sarcopenia’ stage is characterized by low muscle mass, plus low muscle strength or low physical performance. ‘se- vere sarcopenia’ is the stage identified when all three crite- ria are met (low muscle mass, low muscle strength, and low physical performance).[4] The Foundation for the National Institute of Health (FNIH) sarcopenia project defined sarco- penia as clinically relevant low muscle strength and lean mass in 2014.[5]
There is a wide range of techniques to assess muscle mass.
Three imaging techniques have been used-computed to- mography (CT), magnetic resonance imaging (MRI) and dual energy X-ray absorptiometry (DXA). CT and MRI are gold standards for estimating muscle mass. However there are several limitation in terms of cost and radiation expo- sure. DXA is appropriate alternative approach to distinguish fat, bone mineral and lean tissues.[6] Bioimpedance analy- sis (BIA) estimates the volume of fat and lean body mass.
BIA is a noninvasive, portable, quick, and inexpensive meth- od for measuring body composition. BIA results have been found to correlate well with MRI predictions.[7]
EWGSOP, International Working Group in Sarcopenia (IW- GS) and Asian Working Group for Sarcopenia (AWGS) guide- lines define the sum of the muscle masses of the four limbs as appendicular skeletal muscle (ASM) mass to calculate skeletal muscle index (SMI) as ASM/height2 (kg/m2). A SMI two standard deviations below the mean SMI of young male and female reference groups was defined as cut point for sarcopenia.[4,8,9]
EWGSOP and AWGS suggested cutoff value of female were 5.5 kg/m2 and 5.4 kg/m2 as cut point for sarcopenia, respectively.[4,8] Therefore, the purpose of this study was to determine cut point of SMI for sarcopenia for Korean wo- men and comparing with EWGSOP and AWGS guideline for woman.
METHODS
1. Study population
This study was based on data obtained from the 2008 to 2011 Korean National Health and Nutrition Examination Survey (KNHANES) IV and V, a nationally-representative survey conducted by the Korean Ministry of Health and Welfare. These surveys have been conducted periodically since 1998, using a rolling sampling design involving a com-
plex, stratified, multistage, probability-cluster survey of a representative sample of the non-institutionalized civilian population in order to assess the health and nutritional sta- tus of the Korean population. A whole body DXA scan were performed on individuals ≥20 years old from July 2008 to June 2009 and on individuals of ≥10 years old from July 2009 to May 2011 (excluding pregnant women), individu- als with a height of ≥196 cm or a weight of ≥136 kg were excluded in accord with the KNHANES survey protocol. In addition, test results were treated as missing value in par- ticipants with implanted radio-opaque material (e.g., a pros- thetic device, implant or other radio-opaque object) that could affect DXA results. In the analysis, 11,633 women were included. Written informed consent was given by all par- ticipants and the protocol for KNHANES IV and V were ap- proved by the Institutional Review Board of the Korean Cen- ter for Disease Control and Prevention (KCDC).
2. Definition of sarcopenia
In the KNHANES study, whole body DXA examinations were conducted with a QDR4500A apparatus (Hologic, Bed- ford, MA, USA). The data includes values for bone mineral content (g), bone mineral density (g/cm2), fat mass (g), lean mass (including bone mineral content [g]), and fat percent for whole body and anatomical regions. From this data, ASM (kg) was calculated by summing the muscle masses of the four limbs, assuming that all non-fat and non-bone mass is skeletal muscle. SMI was defined as ASM/height2. In terms of cutoff value determination, EWGSOP,[4] IWGS,[9] and AWGS[8] adopt the classical approach, which is two stan- dard deviations below mean values for young reference group. Definition of sarcopenia in this study was used two standard deviations below mean lean body mass of peak muscle mass of young women.
3. Statistical analysis
Age-groups were divided into 9 groups (10’s, 20’s, 30’s, 40’s, 50’s, 60’s, 70’s, 80’s, and 90’s) and described demograph- ic trend of ASM mass, height, SMI of each age groups. We calculated the mean lean body mass of young women of each age group and calculated incidence of sarcopenia in women. All analyses were conducted using SPSS software version 20.0 (SPSS Inc., Chicago, IL, USA).
RESULTS
KNHANES that was performed from 2008 to 2011 involves 11,633 women aged 10 to 97 years. Mean and standard deviation of year was 46.73±18.54 years. Age distribution was 1,012 (8.7%) in 10’s, 1,238 (10.6%) in 20’s, 2,100 (18.1%) in 30’s, 2,068 (17.8%) in 40’s, 1,967 (16.9%) in 50’s, 1,715 (14.7%) in 60’s, 1,237 (10.6%) in 70’s, 285 (2.4%) in 80’s, 11 (0.1%) in 90’s (Table 1). The characteristics of subjects by ages are detailed in Table 2.
1. Changes of ASM mass
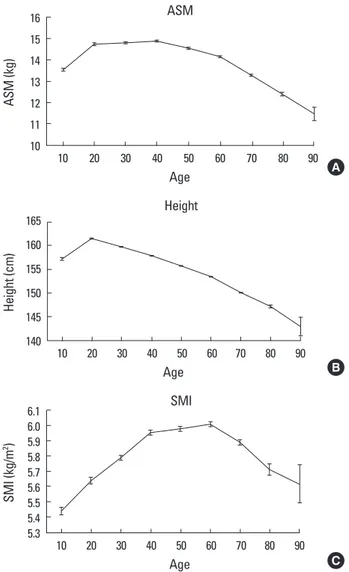
The mean ASM was progressively increased from 10’s to 40’s: 13.53 kg in 10’s, 14.72 kg in 20’s, 14.80 kg in 30’s, 14.87 kg in 40’s. After which the mean ASM was progressively decreased till 90’s: 14.53 kg in 50’s, 14.17 kg in 60’s, 13.28 kg in 70’s, 12.38 kg in 80’s, 11.47 kg in 90’s. Two groups that have peak mean ASM were 30’s and 40’s (Fig. 1A).
2. Changes of height
The mean height was rapidly increased by 4.2 cm from
157.2 cm in 10’s to 161.4 cm in 20’s. After 20’s, height was progressively decreased by 18.5 cm till 90’s : 159.8 cm in 30’s, 157.9 cm in 40’s, 155.7 cm in 50’s, 153.5 cm in 60’s, 150.0 cm in 70’s, 147.2 cm in 80’s, and 143.0 cm in 90’s (Fig. 1B).
3. Changes of SMI
SMI was calculated as ASM/height2. The mean of SMI were 5.44 kg/m2 in 10’s, 5.64 kg/m2 in 20’s, 5.79 kg/m2 in 30’s, 5.95 kg/m2 in 40’s, 5.98 kg/m2 in 50’s, 6.01 kg/m2 in 60’s, 5.89 kg/m2 in 70’s, 5.71 kg/m2 in 80’s, and 5.62 kg/m2 in 90’s (Fig. 1C). Its peak value was noted around 60’s.
4. Calculation of Korean cutoff value
Cutoff value as mean value of young women was decid-
Table 1. Distribution of subjects by ages
Age Subjects Percent (%)
10’s 1,012 8.7
20’s 1,238 10.6
30’s 2,100 18.1
40’s 2,068 17.8
50’s 1,967 16.9
60’s 1,715 14.7
70’s 1,237 10.6
80’s 285 2.4
90’s 11 0.1
Total 11,633 100
Table 2. Characteristics of subjects by ages
Age Height (cm) Weight (kg) Body mass index (kg/m2)
10’s 157.2±8.0 50.4±11.1 20.2±3.4
20’s 161.4±5.5 55.9±9.8 21.4±3.4
30’s 159.7±5.3 57.1±9.3 22.3±3.5
40’s 157.9±5.3 58.5±8.7 23.4±3.3
50’s 155.7±5.2 58.6±8.0 24.1±3.1
60’s 153.4±5.2 57.7±8.2 24.4±3.1
70’s 150.0±5.5 54.2±8.9 24.0±3.5
80’s 147.2±5.4 49.5±7.9 22.7±3.4
90’s 142.9±6.4 43.1±6.3 21.1±2.4
Fig. 1. (A) Distribution of appendicular skeletal muscle (ASM), which indicates peak ASM in 40’s. (B) Distribution of height, which indicates sharp decrease as age increases. (C) Distribution of skeletal mass in- dex (SMI), which indicates peak SMI in 60’s.
16 15 14 13 12 11 10
ASM (kg)
10 20 30 40 50 60 70 80 90 Age
ASM
A
165 160 155 150 145 140
Height (cm)
10 20 30 40 50 60 70 80 90 Age
Height
B
6.1 6.0 5.9 5.8 5.7 5.6 5.5 5.4 5.3 SMI (kg/m2 )
10 20 30 40 50 60 70 80 90 Age
SMI
C
ed with SMI of 30’s and 40’s that have peak ASM. Mean and standard deviation of SMI in those ages was 5.9±0.7 kg/m2. A SMI two standard deviations below the mean SMI of ref- erence groups was 4.4 kg/m2 as cutoff value.
DISCUSSION
Sarcopenia is well known to highly correlate with frailty and increases the risk of falling in the elderly and also rep- resents an important risk factor for disability and mortality.
[10,11] Recently, several study groups have been trying to make common consensus of definition, diagnosis, and treat- ment of sarcopenia.[4,8,9] In this study, demographic data of Korean women is quite different with other studies groups.
We found that SMI of 30’s and 40’s had peak ASM and Mean and standard deviation of SMI in those ages was 5.9±0.7 kg/m2. Cutoff value of Korean reference groups was 4.4 kg/
m2 in this study.
The cutoff point for low SMI is most widely accepted mea- sures, as suggested by the EWGSOP and IWG. Muscle mass was assessed by DXA, which is currently considered the gold standard. In 2010, the EWGSOP has recommended using SMI values which are two standard deviations below the mean observed in young adult from the population under study. An alternate recommendation was to consid- er an SMI value <20th percentile to define low muscle mass.
EWGSOP suggested the cutoff value in women would be 5.5 kg/m2.[4] In 2014, the AWGS suggested 5.4 kg/m2 as the cutoff value in women. However, this study was quite different from worldwide guidelines. The cutoff point for low SMI in Korean women was 4.4 kg/m2 in this study. We think that the reason of lower the cutoff point in Korean women than other Asian countries was likely to be because the muscle mass in Koreans in their 30’s and 40’s was low, while they were taller in comparison to people within the same age group in other Asian countries.[12-14] Wen et al.[15] reported the low prevalence encountered among the Chinese population and the cutoff points for the Chi- nese population are lower than for Americans (4.82 vs. 5.45 in women, respectively for Chinese and North-Americans), with young people of the same ethnic group as reference.
There could be lots of other reasons for these differences such as trends in physical appearances to be slim and life styles living with minimum of movements.
Some studies have suggested that sarcopenia is highly
prevalent: 30% in the population over the age of 65 years.
[16-18] However, when 4.4 kg/m2 was applied to older sub- jects (≥65) in the study group, very few was diagnosed with low SMI. In fact, SMI in 60's was higher than one in 30's. It is similar to other Korean studies. Kim et al.[19] evaluated definitions of sarcopenia to investigate the prevalence. Us- ing same method that we used, they found the prevalence of sarcopenia lower in Koreans compared with published results in white and Hispanic populations. When sarcope- nia was defined as two lower quintiles of ASM/height2 in their study, the prevalence of sarcopenia was 10 times high- er than using a cutoff point of two standard deviation for SMI in the young reference group. This was likely to have been caused by a big difference of height between the young reference group and the older group. The difference in height between age groups in Korea was bigger than other Asian countries.[12,13,20] This could be related to the fact that nutritional values have improved rapidly with the Korean economy being quickly developed in the 30 years gap.
This study has several limitations. First, this study was cross sectional design and not enough to draw enough conclusions. Second, we did not exactly exclude women who have metabolic disease such as hyperthyroidism, dia- betes mellitus, and other disease, which have influenced on lean body mass.
It is definitely necessary to set a cutoff value that can be widely accepted in Korea to prevent confusion. This study used most widely accepted measures and shows that 4.4 kg/m2 of SMI in Korean women was cutoff value of sarco- penia. However, using of this cutoff value as sarcopenia in women, further study is clearly mandatory because the cut- off point in this study is lower than other previous reports.
REFERENCES
1. Rosenberg IH. Sarcopenia: origins and clinical relevance. J Nutr 1997;127:990S-1S.
2. Delmonico MJ, Harris TB, Lee JS, et al. Alternative definitions of sarcopenia, lower extremity performance, and function- al impairment with aging in older men and women. J Am Geriatr Soc 2007;55:769-74.
3. Goodpaster BH, Park SW, Harris TB, et al. The loss of skele- tal muscle strength, mass, and quality in older adults: the health, aging and body composition study. J Gerontol A
Biol Sci Med Sci 2006;61:1059-64.
4. Cruz-Jentoft AJ, Baeyens JP, Bauer JM, et al. Sarcopenia:
European consensus on definition and diagnosis: report of the European Working Group on Sarcopenia in Older People. Age Ageing 2010;39:412-23.
5. Studenski SA, Peters KW, Alley DE, et al. The FNIH sarcope- nia project: rationale, study description, conference rec- ommendations, and final estimates. J Gerontol A Biol Sci Med Sci 2014;69:547-58.
6. Wang ZM, Visser M, Ma R, et al. Skeletal muscle mass: eval- uation of neutron activation and dual-energy X-ray absorp- tiometry methods. J Appl Physiol (1985) 1996;80:824-31.
7. Chien MY, Huang TY, Wu YT. Prevalence of sarcopenia esti- mated using a bioelectrical impedance analysis prediction equation in community-dwelling elderly people in Taiwan.
J Am Geriatr Soc 2008;56:1710-5.
8. Chen LK, Liu LK, Woo J, et al. Sarcopenia in Asia: consen- sus report of the Asian Working Group for Sarcopenia. J Am Med Dir Assoc 2014;15:95-101.
9. Fielding RA, Vellas B, Evans WJ, et al. Sarcopenia: an undi- agnosed condition in older adults. Current consensus def- inition: prevalence, etiology, and consequences. Interna- tional working group on sarcopenia. J Am Med Dir Assoc 2011;12:249-56.
10. Chastin SF, Ferriolli E, Stephens NA, et al. Relationship be- tween sedentary behaviour, physical activity, muscle qual- ity and body composition in healthy older adults. Age Age- ing 2012;41:111-4.
11. Landi F, Liperoti R, Fusco D, et al. Sarcopenia and mortality among older nursing home residents. J Am Med Dir Assoc 2012;13:121-6.
12. Lim TO, Ding LM, Zaki M, et al. Distribution of body weight, height and body mass index in a national sample of Ma- laysian adults. Med J Malaysia 2000;55:108-28.
13. Cheng Q, Zhu X, Zhang X, et al. A cross-sectional study of loss of muscle mass corresponding to sarcopenia in healthy Chinese men and women: reference values, prevalence, and association with bone mass. J Bone Miner Metab 2014;
32:78-88.
14. Marwaha RK, Garg MK, Bhadra K, et al. Assessment of lean (muscle) mass and its distribution by dual energy X-ray absorptiometry in healthy Indian females. Arch Osteopo- ros 2014;9:186.
15. Wen X, Wang M, Jiang CM, et al. Are current definitions of sarcopenia applicable for older Chinese adults? J Nutr Heal- th Aging 2011;15:847-51.
16. Baumgartner RN, Koehler KM, Gallagher D, et al. Epidemi- ology of sarcopenia among the elderly in New Mexico. Am J Epidemiol 1998;147:755-63.
17. Iannuzzi-Sucich M, Prestwood KM, Kenny AM. Prevalence of sarcopenia and predictors of skeletal muscle mass in healthy, older men and women. J Gerontol A Biol Sci Med Sci 2002;57:M772-7.
18. Cawthon PM, Marshall LM, Michael Y, et al. Frailty in older men: prevalence, progression, and relationship with mor- tality. J Am Geriatr Soc 2007;55:1216-23.
19. Kim TN, Yang SJ, Yoo HJ, et al. Prevalence of sarcopenia and sarcopenic obesity in Korean adults: the Korean sar- copenic obesity study. Int J Obes (Lond) 2009;33:885-92.
20. Kim S, Won CW, Kim BS, et al. The association between the low muscle mass and osteoporosis in elderly Korean peo- ple. J Korean Med Sci 2014;29:995-1000.