© 2016 Korean Breast Cancer Society. All rights reserved. http://ejbc.kr | pISSN 1738-6756
INTRODUCTION
Cancer is a polygenic disease of the eukaryotic cell cycle, in- volving genetic and epigenetic alterations in the genes playing a vital role in controlling the cell cycle [1]. Cell cycle progres- sion is a highly organized series of events, involving multiple checkpoints to monitor growth signals and DNA integrity
during cell division [2]. Any dysregulation at these check- points due to aberrant expression of the genes involved in the cell cycle machinery (E2F5/pRb) may lead to proliferation and carcinogenesis [3]. Among these events, G1/S transition is crucial for maintaining DNA conservation and this step is ac- tively controlled by the availability of E2F family of transition factors [4]. E2F is a protein family comprising nine members, four of which are transcriptional activators (E2F1–E2F3) and five are transcriptional repressors (E2F4–E2F8) [5]. The E2F family can bind with Rb proteins and regulate the G1/S phase of cell cycle [6]. These cell cycle regulatory genes, along with the associated regulatory factors, play a fundamental role in the proliferation of cells and pathogenesis of cancer [7]. Over- expression of the activator E2Fs and downregulation of the repressor E2Fs may cause abnormal proliferation of cells, a common phenomenon in various types of malignancies [3].
Among the E2F family, the E2F5 gene has growth-repres-
Aberrant Promoter Methylation at CpG Cytosines Induce the Upregulation of the E2F5 Gene in Breast Cancer
Arshad Ali1,2,*, Farman Ullah1,2,*, Irum Sabir Ali3, Ahmad Faraz3, Mumtaz Khan3, Syed Tahir Ali Shah4, Nawab Ali2, Muhammad Saeed1
1Cancer Genetics and Epigenetics Lab, Department of Biosciences, COMSATS Institute of Information Technology, Islamabad; 2Department of
Biotechnology & Genetic Engineering, Kohat University of Science & Technology, Kohat; 3Department of Surgical C Unit, Post Graduate Medical Institution, Lady Reading Hospital, Peshawar; 4Department of Surgery, Divisional Headquarter Hospital, Kohat, Pakistan
ORIGINAL ARTICLE
Purpose: The promoter methylation status of cell cycle regulatory genes plays a crucial role in the regulation of the eukaryotic cell cycle. CpG cytosines are actively subjected to methylation dur- ing tumorigenesis, resulting in gain/loss of function. E2F5 gene has growth repressive activities; various studies suggest its in- volvement in tumorigenesis. This study aims to investigate the epigenetic regulation of E2F5 in breast cancer to better under- stand tumor biology. Methods: The promoter methylation status of 50 breast tumor tissues and adjacent normal control tissues was analyzed. mRNA expression was determined using SYBR® green quantitative polymerase chain reaction (PCR), and methyl- ation-specific PCR was performed for bisulfite-modified genom- ic DNA using E2F5-specific primers to assess promoter methyl- ation. Data was statistically analyzed. Results: Significant (p<0.001) upregulation was observed in E2F5 expression among tumor tissues, relative to the control group. These sam- ples were hypo-methylated at the E2F5 promoter region in the tumor tissues, compared to the control. Change in the methyl-
ation status (∆meth) was significantly lower (p=0.022) in the tu- mor samples, indicating possible involvement in tumorigenesis.
Patients at the postmenopausal stage showed higher methyl- ation (75%) than those at the premenopausal stage (23.1%). In- terestingly, methylation levels gradually increased from the early to the advanced stages of the disease (p<0.001), which sug- gests a putative role of E2F5 methylation in disease progression that can significantly modulate tumor biology at more advanced stage and at postmenopausal age (Pearson’s r=0.99 and 0.86, respectively). Among tissues with different histological status, methylation frequency was higher in invasive lobular carcinoma (80.0%), followed by invasive ductal carcinoma (46.7%) and ductal carcinoma in situ (20.0%). Conclusion: Methylation is an important epigenetic factor that might be involved in the upregu- lation of E2F5 gene in tumor tissues, which can be used as a prognostic marker for breast cancer.
Key Words: Breast neoplasms, E2F5 transcription factor, Methylation, Promoter
Correspondence to: Muhammad Saeed
Cancer Genetics and Epigenetics Lab, Department of Biosciences, COMSATS Institute of Information Technology (CIIT), Park Road, Chak Shahzad, Islamabad 44000, Pakistan
Tel: +92-51-9240-576, Fax: +92-51-4442-805 E-mail: [email protected]
*These authors contributed equally to this work.
This research was supported by a grant from the Higher Education Commission (HEC).
Received: January 27, 2016 Accepted: April 27, 2016
Cancer
sive characteristics that have been observed in solid osteosar- coma [8] and cancer of the colon [9], ovary [3], and breast [10]. Overexpression of E2F5 proteins has been observed in both ovarian and breast cancers [3,10]. Moreover, elevated ex- pression of E2F5 has been reported in early as well as ad- vanced stages of ovarian cancer, which suggests a putative role of E2F5 in cancer pathogenesis [3]. These elevated levels of ex- pression have been attributed to many genetic factors [11]
such as abnormal splicing causing impaired DNA amplicons in sporadic colorectal carcinoma [9] and chromosomal aber- rations involving the E2F5 gene in breast cancer [10]. Howev- er, the role of epigenetic modifications such as DNA methyl- ation in the regulation of E2F5 remains largely unclear.
Many epigenetic alterations such as DNA and histone meth- ylation as well as chromatin remodeling functions such as his- tone acetylation, phosphorylation, and ubiquitination are cru- cial for regulating the growth patterns of many genes [12].
Among these, promoter methylation at the CpG sites is the most important epigenetic tag that may correlate with gene ex- pression [13]. Moreover, CpG methylation at the promoter re- gion of a gene may correspond to the gain of function of onco- genes and loss of function of the tumor suppressor gene, thus contributing key characteristics that can lead to tumorigenesis [14]. Aberrant DNA methylation has been observed in tumor cells and is thought to be helpful to develop disease markers for early prognosis of cancer pathogenesis [15,16].
This study attempts to elucidate E2F5 promoter methylation in breast cancer tissue to highlight a possible role in cancer pathogenesis, which may be used for early prognosis of breast cancer in clinical settings.
METHODS
Subject enrollment and sample collection
Fifty tumor tissue samples and adjacent normal control tis- sue (ANCT) samples were collected from breast cancer pa- tients in RNAlater® stabilization solution (Thermo Fisher, Waltham, USA) at the time of surgery at Khyber Pakhtunkhwa.
ANCT was selected from the area about 2 cm away from the affected site and selected by an oncologist on the basis of his- topathological observations. Patients with history of other in- fectious and familial diseases were excluded from this study.
This study was conducted after prior approval from the Ethical Review Committee (CIIT-09-10-14) of the COMSTAS Institute of Information Technology (CIIT), Islamabad, Pakistan, and the collaborating hospital. Written informed consent was obtained from every patient, prior to sample collection. Samples were stored at -80°C until analysis.
Extraction and bisulfite conversion of genomic DNA
DNA from the tissue samples was extracted using the stan- dard phenol-chloroform method [17]. About 2 to 5 µg of ge- nomic DNA was chemically modified using the commercially available EpiJETTM Bisulfite Conversion Kit (Cat# K1461;
Thermo Scientific, Waltham, USA) as per the manufacturer’s instructions. Bisulfite treatment specifically converts non- methylated cytosine “C” residues to thymine “T” residues, but it retains methylated cytosine “C.”
Primer designing for methylation-specific polymerase chain reaction (PCR)
E2F5 methylation status was analyzed in both sets of tissues.
The targeted region is located at a site 523 bp downstream from the transcription start site. Moreover, methylation-spe- cific primers were designed for the targeted site (NCBI
“85177579-85178045”) and comprised 51 CpG sites. Promot- er methylation was analyzed using a set of methylated (for- ward: TGGGGTTGTTTATTATTAAGTTCGT and reverse:
ACGATATCTCCGAACAAAACG) and nonmethylated primers (forward: GAGTTTGGGGTTGTTTATTATTA- AGTTT and reverse: CACAATATCTCCAAACAAAA- CACC) on the MethPrimer freely online available tool (http://
www.urogene.org/methprimer/) [18].
Methylation-specific PCR
Methylation-specific PCR (MSP) was performed to amplify the targeted promoter region of E2F5 from the bisulfite-con- verted genomic DNA by using methylation-specific primers.
Briefly, 4 µL (~100 ng) bisulfite-converted genomic DNA was amplified using methylated and nonmethylated primers in a 50-µL reaction mixture. The PCR conditions were as follows:
a single cycle at 98°C for 30 seconds (initial denaturation); fol- lowed by 35 cycles at 98°C for 10 seconds (denaturation), 62°C for 30 seconds (annealing), and 72°C for 30 seconds (ex- tension); and a single cycle at 72°C for 7 minutes (final exten- sion) by using 1.0 units Thermo ScientificTM Maxima Hot Start Taq DNA PolymeraseTM (Cat# EP0601; Thermo Scientif- ic). MSP validity was checked by amplifying CpG-methylated human genomic DNA obtained from Thermo Scientific Cat#
SD1131 (Thermo Scientific) as the positive control; PCR wa- ter was used as the negative control. However, for the non- methylation-specific PCR, bisulfite-unconverted human ge- nomic DNA was used as the positive control.
Gel electrophoresis and quantification
PCR products were visualized under the UV illuminator BioDoc AnalyzeTM (Biometra, Göttingen, Germany) after electrophoresis on 2% agarose gel, followed by staining with
ethidium bromide. The bands intensities were quantified us- ing ImageJ densitometer, freely available online (Laboratory for Optical and Computational Instrumentation, University of Wisconsin, Madison, USA) to compare the degree of meth- ylation and nonmethylation. Change in methylation status (∆meth) was calculated by subtracting the intensity of methyl- ation from that of nonmethylation. CpG human methylated DNA was used as the positive control, while the nonmethyl- ated material was used as the control.
mRNA extraction and real-time qPCR analysis
RNA extraction from all tissues was performed using the standard Trizol method [19], and cDNA was synthesized using the commercially available cDNA synthesis kit (Thermo Scientific). Following were the primers used: E2F5 gene (left primer, CACCTTCTGGTACACAACTG; right primer, GGCTTAGATGAACTCGACTC); β-actin as the internal control (left primer, CACTCTTCCAGCCTTCCTTC; right primer, TGATCTCCTTCTGCATCGTG). StepOnePlusTM Real-Time PCR system (Applied Biosystems, Waltham, USA) was used for PCR amplification by the SYBR® Green method.
The thermocycler was set to the following conditions: 95°C for 10 minutes (initial denaturation); followed by 40 cycles at 95°C for 15 seconds, 56°C for 60 seconds, and 72°C for 20 seconds; and final extension at 72°C for 1 minute. mRNA expression was calculated using the delta-delta Ct values.
Data analysis
Data were analyzed using OriginPro 2015 statistic software (OriginLab, Northampton, USA). The correlation among dif- ferent factors was assessed at 95% confidence intervals by us- ing the Mann-Whitney test, Kruskal Wallis test, and ANOVA
test, and specific comparison were undertaken by standard descriptive analysis. A p-value of <0.05 was considered significant.
RESULTS
E2F5 promoter methylation analysis among tumor and normal tissues from breast cancer patients
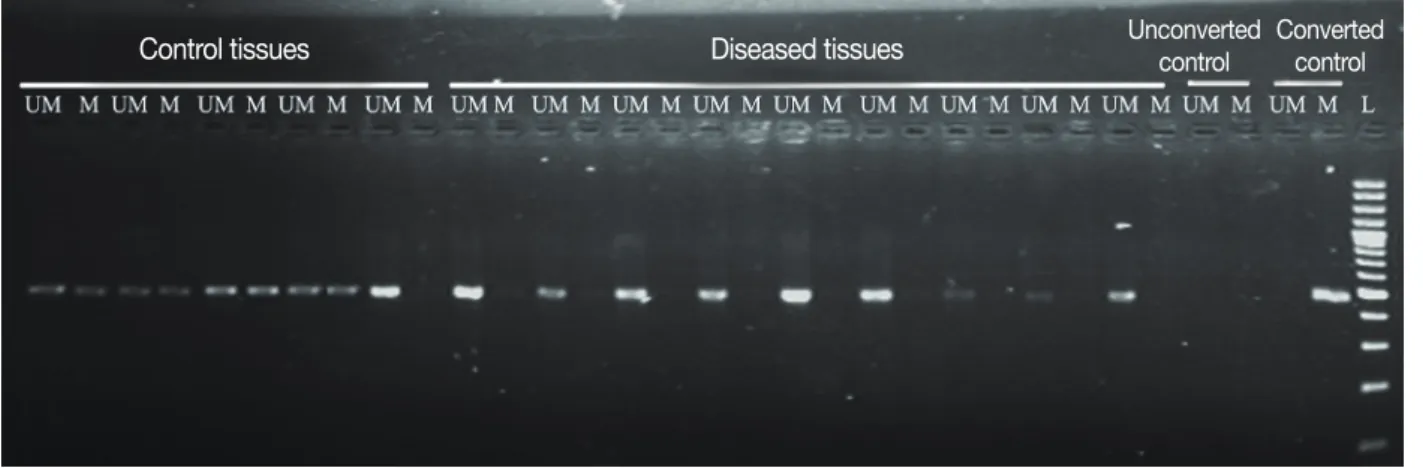
The methylation status of E2F5 promoter was analyzed for both tumor tissues and ANCTs in breast cancer. Both methyl- ation- and nonmethylation-specific primers yielded products in case of normal tissue, whereas majority of tumor tissues yielded products only with nonmethylation-specific primers (Figure 1). Reduced methylation level at the E2F5 promoter region (48%) was observed in the tumor tissues compared to the normal tissues (80%), as shown in Table 1 and Figure 2.
Δmeth was found to be statistically different (p=0.022) be- tween normal and tumor tissues (Table 2). This highlights a possible role of E2F5 promoter methylation in breast cancer prognosis, which can be correlated to its well-reported elevat- ed expression levels in many cancer types.
Promoter methylation status among patients from different age groups
The promoter methylation status of the E2F5 gene was studied between two study cohorts of breast cancer, namely,
<45 and ≥45 years. Interestingly, the methylation frequency was higher among control tissues, compared to the tumor tis- sues, among our subjects. In both study cohorts, the methyl- ation frequency in the control tissues was higher (63.6% and 92.9%, respectively), compared to that in the tumor tissues (27.3% and 64.3%, respectively). Statistical analysis showed
Figure 1. Agarose gel (2%) showing promoter methylation pattern of E2F5 gene in tumors and control tissues of breast cancer. “M” and “UM” repre- sent methylation and unmethylation, respectively. “Converted control” means bisulphite treated CpG methylated human genomic DNA, whereas “un- converted control” means bisulphite untreated human genomic DNA. The letter “L” represent 100 bp DNA size ladder.
Control tissues Diseased tissues Unconverted
control Converted control
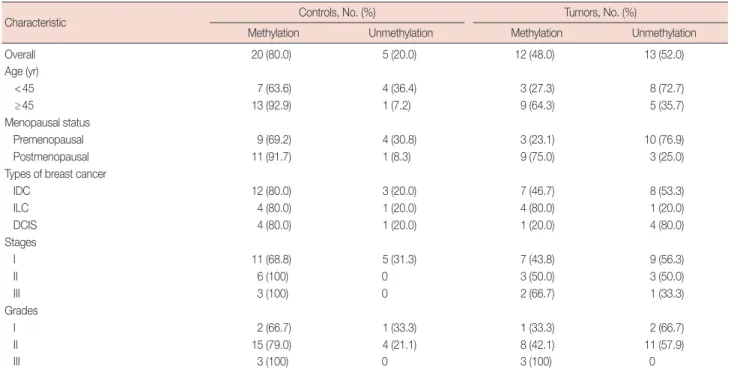
Table 1. Promoter methylation status of E2F5 gene among various studied parameters in breast cancer
Characteristic Controls, No. (%) Tumors, No. (%)
Methylation Unmethylation Methylation Unmethylation
Overall 20 (80.0) 5 (20.0) 12 (48.0) 13 (52.0)
Age (yr)
<45 7 (63.6) 4 (36.4) 3 (27.3) 8 (72.7)
≥45 13 (92.9) 1 (7.2) 9 (64.3) 5 (35.7)
Menopausal status
Premenopausal 9 (69.2) 4 (30.8) 3 (23.1) 10 (76.9)
Postmenopausal 11 (91.7) 1 (8.3) 9 (75.0) 3 (25.0)
Types of breast cancer
IDC 12 (80.0) 3 (20.0) 7 (46.7) 8 (53.3)
ILC 4 (80.0) 1 (20.0) 4 (80.0) 1 (20.0)
DCIS 4 (80.0) 1 (20.0) 1 (20.0) 4 (80.0)
Stages
I 11 (68.8) 5 (31.3) 7 (43.8) 9 (56.3)
II 6 (100) 0 3 (50.0) 3 (50.0)
III 3 (100) 0 2 (66.7) 1 (33.3)
Grades
I 2 (66.7) 1 (33.3) 1 (33.3) 2 (66.7)
II 15 (79.0) 4 (21.1) 8 (42.1) 11 (57.9)
III 3 (100) 0 3 (100) 0
IDC=invasive ductal carcinoma; ILC=invasive lobular carcinoma; DCIS=ductal carcinoma in situ.
Table 2. Statitical analysis of E2F5 gene promoter methylation studied among various parameters in breast cancer patients
Characteristic
Controls Tumors Controls vs.
tumors
SEM 95% CI
Skewness SEM 95% CI
Skewness p-value
Upper Lower Upper Lower
∆Meth 0.002
Overall 309.5 1,001.3 2,279.0 0.3 370.8 1,869.6 3,400.3 -0.1
mRNA expression <0.001
Overall 0.4 0.2 1.8 2.7 1.5 -1.0 5.0 4.6
∆Meth (yr) <0.001
<45 396.9 1,400.5 3,169.0 -0.8 503.4 2,281.8 4,524.9 -1.2
≥45 419.3 227.8 2,039.5 1.2 486.3 980.6 3,081.8 0.6
Menopausal status <0.001
Premenopausal 427.8 966.2 2,830.3 -0.5 453.2 2,412.5 4,387.3 -1.0
Postmenopausal 453.4 362.6 2,358.6 1.1 512.2 679.0 2,933.5 0.9
Types of breast cancer <0.001
IDC 415.3 678.9 2,460.8 0.6 460.9 1,021.4 2,998.4 0.4
ILC 601.3 664.3 4,003.4 -1.0 686.2 1,537.9 5,348.5 -1.5
DCIS 720.3 -842.6 3,157.0 0.3 826.6 1,406.9 5,996.7 -1.5
Stages <0.001
I 392.3 1,115.7 2,788.2 0.1 467.9 1,872.6 3,867.0 -0.4
II 530.2 -565.3 2,160.6 0.1 721.5 -1.2 3,707.9 0.8
III 1,024.4 -2,745.2 6,069.7 1.4 1,260.0 -2,475.9 8,366.9 -1.0
Grades <0.001
I 1,277.7 -4,724.4 6,270.7 1.6 298.7 3,336.4 5,906.6 1.0
II 349.1 1,044.7 2,511.8 0.4 431.2 1,412.8 3,224.4 0.2
III 751.3 -1,599.9 4,864.9 -0.3 881.0 -1,138.9 6,442.9 -1.7
SEM=standard error of mean; CI=confidence interval; ΔMeth=unmethylation-methylation; IDC=invasive ductal carcinoma; ILC=invasive lobular carcinoma;
DCIS=ductal carcinoma in situ.
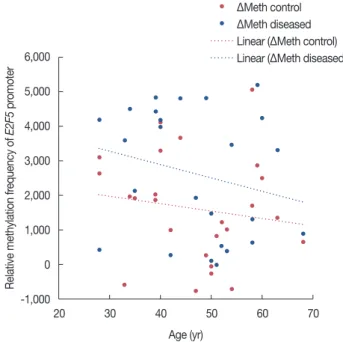
that changes in the methylation status (∆meth) are signifi- cantly related to both tissue types (p<0.001) (Tables 1, 2, Figure 3). These results propose the occurrence of age-inde- pendent changes in the E2F5 promoter methylation status, which points toward a more direct involvement of methyl- ation in breast cancer.
Promoter methylation analysis among premenopausal and postmenopausal patients
Methylation frequencies were also analyzed among pre- menopausal and postmenopausal breast cancer patients. Of the total subjects (n=25), 13 belonged to the premenopausal group and 12 patients belonged to the postmenopausal group.
The methylation frequency in premenopausal patients was lower in the tumor tissues (23.1%); it was 75.0% in postmeno- pausal patients. Moreover, in both cohorts, the frequency of
methylation was higher in the control group. Moreover, the methylation levels were significantly different (p<0.001) among patients of the premenopausal and postmenopausal groups (Tables 1, 2).
Methylation frequency among different stages and grades of breast cancer
Breast cancer patients with different clinical manifestations or at different stages were analyzed for their E2F5 promoter methylation status. In patients at initial stages of tumor pro- gression (i.e., Stage I), the methylation frequency was lower
Figure 2. Change in methylation (Δmeth) among control and diseased tissues of breast cancer.
Unmeth=unmethylation; Meth=methylation; ΔMeth=unmethylation- methylation.
2,500
2,000
1,500
1,000
500
0
Control Diseased
Methylation status
Methylation vs. unmethylation frequency
Unmeth Meth ΔMeth
Figure 3. Age wise distribution of promoter methylation status at E2F5 gene in breast cancer patients.
ΔMeth=unmethylation-methylation.
6,000
5,000
4,000 3,000
2,000
1,000
0 -1,000
20 30 40 50 60 70 Age (yr)
Relative methylation frequency of E2F5 promoter
ΔMeth control ΔMeth diseased Linear (ΔMeth control) Linear (ΔMeth diseased)
Figure 4. Promoter methylation of E2F5 gene among various stages of breast cancer.
Unmeth=unmethylation; Meth=methylation; ΔMeth=unmethylation-methylation.
4,000 3,500 3,000 2,500 2,000 1,500 1,000 500 0 -500 -1,000
Control unmeth Control meth Control ∆meth Diseased unmeth Diseased meth Diseased ∆meth
Relative frequency of E2F5 promoter
Stage I Stage II Stage III
(43.8%) compared to patients at an advanced stage (Stage II, 50%; Stage III, 66.7%). This suggests a potential role of E2F5 promoter methylation in disease progression, and highlights its prognostic value as an early biomarker. ∆meth was signifi- cantly different (p<0.001) among patients of all disease groups (Tables 1, 2, Figure 4). Similar results were observed in patients with Grade I (33.3%), Grade II (42.1%), and Grade III (100%) disease. ∆meth was also found to be significantly different (p<0.001) among the three tumor classes (Tables 1, 2, Figure 5). This indicates potential involvement of E2F5
methylation in disease progression. Moreover, ∆meth is a progressive epigenetic factor that could significantly modulate tumor biology at a more advanced disease stage in the sample set (Pearson’s r=0.99) (Table 3).
Methylation status among various histopathological groups of breast cancer
Methylation levels among various histopathological classes of breast cancer were also analyzed. Among the three histo- pathological classes, patients with invasive ductal carcinoma Figure 5. E2F5 promoter methylation status among different histologi-
cal grades of breast cancer.
ΔMeth=unmethylation-methylation.
3,000 2,500 2,000 1,500 1,000 500 0 -500 -1,000
Control ∆meth Diseased ∆meth Relative
Relative methylation frequency of E2F5 promoter G I
G II G III
Figure 6. Change in methylation (Δmeth) of E2F5 promoter among dif- ferent histopathological type of breast cancer patients.
IDC =invasive ductal carcinoma; ILC =invasive lobular carcinoma;
DCIS=ductal carcinoma in situ; ΔMeth=unmethylation-methylation.
3,000 2,500 2,000 1,500 1,000 500 0 -500 -1,000
Control ∆meth Diseased ∆meth Relative
Relative methylation frequency of E2F5 promoter IDC
ILC DCIS
Table 3. Correlation analysis of E2F5 gene among various clinicopathological factors in breast cancer patients
Characteristic Controls Tumors
DF Pearson's r Adj. R2 F-value Prob >F DF Pearson's r Adj. R2 F-value Prob >F Age (yr)
<45 9 0.25 -0.04 0.59 0.46 9 0.99 0.99 2319.74 0.00
≥45 12 -0.10 -0.07 0.11 0.75 12 0.88 0.76 41.70 0.00
Menopausal status
Premenopausal 11 0.25 -0.02 0.75 0.40 11 0.10 0.99 3,083.28 0.00
Postmenopausal 10 0.57 0.25 4.75 0.05 10 0.86 0.71 28.48 0.00
Types of breast cancer
IDC 13 0.42 0.11 2.78 0.12 13 0.88 0.75 43.55 0.00
ILC 3 0.04 -0.33 0.01 0.95 3 0.99 0.99 798.95 0.00
DCIS 3 0.34 -0.18 0.38 0.58 3 0.99 0.99 630.53 0.00
Stages
I 14 -0.09 -0.06 0.13 0.73 14 -0.51 0.21 4.96 0.04
II 4 0.18 -0.21 0.14 0.73 4 0.98 0.94 75.44 0.00
III 1 0.55 -0.41 0.42 0.63 1 0.99 0.99 446.43 0.03
Grades
I 1 0.99 0.97 66.62 0.08 1 0.99 0.99 144.78 0.05
II 17 0.39 0.10 3.00 0.10 17 0.91 0.82 84.33 0.00
III 1 -0.79 0.26 1.71 0.42 1 0.99 0.99 812.33 0.02
DF=degree of freedom; Adj. R2=adjusted R2; Prob=probability; IDC=invasive ductal carcinoma; ILC=invasive lobular carcinoma; DCIS=ductal carcinoma in situ.
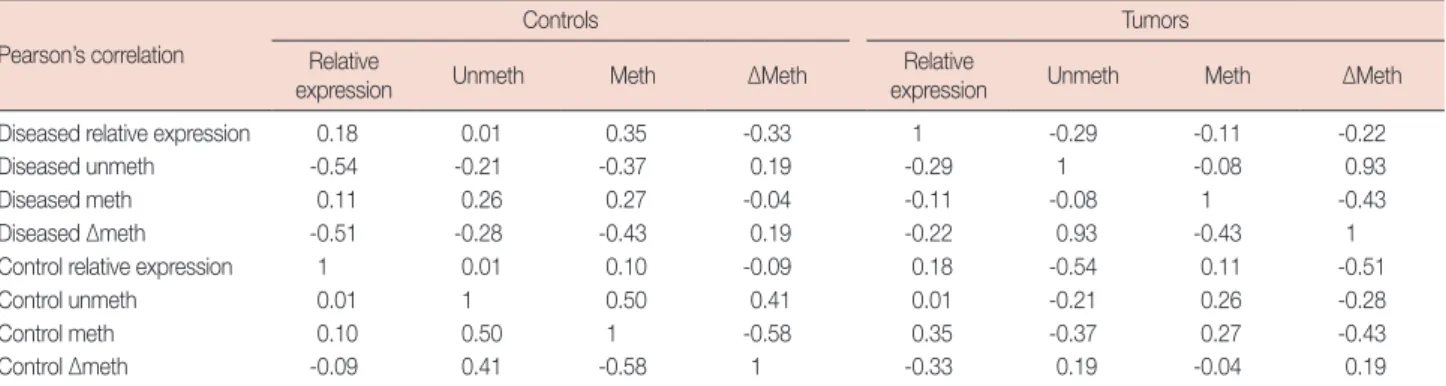
Table 4. Pearson correlation among expression and methylation status of E2F5 gene in breast cancer patients Pearson’s correlation
Controls Tumors
Relative
expression Unmeth Meth ∆Meth Relative
expression Unmeth Meth ∆Meth
Diseased relative expression 0.18 0.01 0.35 -0.33 1 -0.29 -0.11 -0.22
Diseased unmeth -0.54 -0.21 -0.37 0.19 -0.29 1 -0.08 0.93
Diseased meth 0.11 0.26 0.27 -0.04 -0.11 -0.08 1 -0.43
Diseased ∆meth -0.51 -0.28 -0.43 0.19 -0.22 0.93 -0.43 1
Control relative expression 1 0.01 0.10 -0.09 0.18 -0.54 0.11 -0.51
Control unmeth 0.01 1 0.50 0.41 0.01 -0.21 0.26 -0.28
Control meth 0.10 0.50 1 -0.58 0.35 -0.37 0.27 -0.43
Control ∆meth -0.09 0.41 -0.58 1 -0.33 0.19 -0.04 0.19
Unmeth=unmethylation; Meth=methylation; ΔMeth=unmethylation-methylation.
had 46.7% methylation in the tumor tissues compared to those with invasive lobular carcinoma (80%). Moreover, pa- tients with ductal carcinoma in situ showed 20% methylation in tumor tissues. All three classes showed a significant differ- ence (p<0.001) in their methylation status (Tables 1, 2, Figure 6).
This suggests that the methylation level of the E2F5 promoter might have varying consequences depending on the origin of the tumor.
E2F5 mRNA transcript expression is significantly upregulated in tumor tissues
Quantitative real-time PCR was performed to determine E2F5 mRNA transcript expression in both tumor and control tissues. The relative expression of E2F5 mRNA transcript was found to be significantly higher (p<0.001) in the tumor tis- sues compared to the ANCTs, irrespective of the age and dis- ease status of the patient (Table 2, Figure 7). Moreover, Pear- son’s correlation among the relative expression in the control and tumor samples with their ∆meth shows negative correla- tion (-0.09 and -0.22, respectively), which suggests the possi-
ble role of E2F5 promoter methylation in its upregulation, leading to breast cancer pathogenesis (Table 4).
DISCUSSION
Cell cycle regulatory genes and associated regulatory pro- teins are vital factors that play a critical role in cell prolifera- tion and tumorigenesis. Promoter methylation has a critical role in the regulation of gene expression, resulting in normal growth pattern [13]. E2F5 gene is cytogenetically mapped to the human chromosome 8q21.2 and comprises 10 exons [20].
They have a highly conserved DNA-binding domain, Dp-1 domain for dimerization, and a transactivation domain in the C-terminus of the protein. The DNA-binding domain of E2F5, in association with DP-1, binds with the target promot- er and regulates the expression of the reporter gene [21]. Un- like E2F1–3, E2F4 and E2F5 are highly expressed in quiescent (G0) cells, and associate with retinoblastoma-related proteins (p107/p130), instead of pRB, and show antioncogenic activity [21]. Both Rb1/p107 and Rb2/p130 form complexes with E2F4 or E2F5, resulting in the formation of cyclin E repressor complex (CERC) [22]. These CERC play a pivotal role in the transcriptional repression of Cyclin E1 promoter in the G1 phase and in the blockade of cell proliferation. Thus, aberrant expression of the E2F5 gene may lead to uncontrolled cell di- vision and tumor formation. Higher E2F5 expression has al- ready been reported in various tumor types, including colon [9], ovarian [3], and breast cancer [10], but the factors regulat- ing E2F5 gene expression remains elusive. Moreover, cBiopor- tal showed significantly high expression of E2F5 gene in 281 (26%) breast cancer patients out of 1,100 patients, although E2F5 expression profiles were not significantly correlated with patient survival data on the same portal [23]. Our results also support the observation that higher E2F5 expression occurs in malignant tissues. Moreover, our results indicate that E2F5 is aberrantly methylated to a lesser extent in the breast tumor Figure 7. Fold relative mRNA expression of E2F5 gene among tumor
and control tissues of breast cancer patients.
3.0 2.5 2.0 1.5 1.0 0.5 0
Control Diseased
mRNA Fold relative mRNA expression of E2F5 gene in tissues of breast cancer patients
tissues (48% of all cases), compared to the control samples (80%). ∆Meth status was found to be significantly different (p=0.022) among the control and tumor tissues. Deregulated methylation at the E2F5 gene promoter may be considered re- sponsible for elevated expression levels in breast tumor tissues and may have a prognostic role; however, this needs further validation in other tumor types. Alternatively, higher methyla- tion levels at the E2F5 promoter may extend protective effects against breast cancer pathogenesis. This is supported by the fact that lower methylation frequencies were noticed for breast tumor tissues in all control study cohorts (age-based, tumor stage-based, and so forth). Similarly, a gradual decrease in methylation levels was observed at the E2F5 promoter in the breast cancer patients at an advanced stage. This observa- tion highlights the prognostic involvement of E2F5 promoter in tumor progression and can be used as an early diagnostic marker of breast cancer. This is supported by the fact that well-differentiated (Grade I) tumors are less methylated com- pared to poorly differentiated tumors (Grade III). This might furtehr detrioate other cellular mechanisms leading to com- plications at this disease stage that have adverse effects on dis- ease management, owing to poor socioeconmic sittuation of Pakistani population [24]. Interestingly, tumors of different tissue origins (histopathological groups) were found to have varying degrees of methylation levels, suggesting that the con- sequences of E2F5 promoter methylation might have different effects depending on the area of tumor origin. The level of methylation increased as the tumors progressed to the ad- vanced stages and showed significantly reduced expression of the tumor suppressor gene [25].
Generally, promoter methylation is considered an age-de- pendent phenomenon [26]. It is hypothesized that age-depen- dent DNA hyper-methylation is associated with aberrant telomerase activities and plays a critical role in age-related dis- orders such as cancer [27]. The present study shows an age- independent change in methylation status at the E2F5 gene promoter. In both study cohorts (<45 and ≥45 years), the difference in methylation was negligible, given the fact that the methylation status was statistically different from that of the corresponding controls (p<0.01) (Table 2). This suggests a more direct involvement of E2F5 promoter methylation in breast cancer pathogenesis and supports our aforementioned hypothesis that E2F5 promoter methylation does exert a pro- tective effect against breast cancer.
Many studies have reported C/T transitions in the coding and regulatory regions of the genes involved in aging and var- ious cancers and related disorders [28]. Consistent with this is the fact that the promoter-rich CpG sites are hotspots for methylation and that they are vulnerable to mutagens [29].
The conversion of cytosine to thymidine renders methylation at that position, which may induce pronounced effects on gene expression [30]. Interestingly, the E2F5 gene has 27 re- ported C/T conversions in the chromosomal region (8q21.2)
>gi|568815590:85177579-85178045 present about 523 bp around the E2F5 TSS. This supports our findings that methyl- ation at the E2F5 promoter has a prognostic role in breast cancer, although no literature is available on disease suscepti- bility for the population harboring these single nucleotide polymorphisms. Based on these findings, screening C >T conversion in normal individuals seems to be an interesting domain to explore.
CONFLICT OF INTEREST
The authors declare that they have no competing interests.
ACKNOWLEDGMENTS
The authors specially acknowledge and are thankful to all the participants as well as the supporting staff at PGMI; Lady Reading Hospital, Peshawar. We express our gratitude to the members of the Cancer Genetics & Epigenetics Laboratory, Biosciences (CIIT), Islamabad, Pakistan, for their kind coop- eration and provision of the research platform.
REFERENCES
1. Colozza M, Azambuja E, Cardoso F, Sotiriou C, Larsimont D, Piccart MJ. Proliferative markers as prognostic and predictive tools in early breast cancer: where are we now? Ann Oncol 2005;16:1723-39.
2. Eymin B, Gazzeri S. Role of cell cycle regulators in lung carcinogenesis.
Cell Adh Migr 2010;4:114-23.
3. Kothandaraman N, Bajic VB, Brendan PN, Huak CY, Keow PB, Razvi K, et al. E2F5 status significantly improves malignancy diagnosis of epithe- lial ovarian cancer. BMC Cancer 2010;10:64.
4. Attwooll C, Lazzerini Denchi E, Helin K. The E2F family: specific func- tions and overlapping interests. EMBO J 2004;23:4709-16.
5. Chen HZ, Tsai SY, Leone G. Emerging roles of E2Fs in cancer: an exit from cell cycle control. Nat Rev Cancer 2009;9:785-97.
6. Bertoli C, Skotheim JM, de Bruin RA. Control of cell cycle transcription during G1 and S phases. Nat Rev Mol Cell Biol 2013;14:518-28.
7. Crijns AP, Fehrmann RS, de Jong S, Gerbens F, Meersma GJ, Klip HG, et al. Survival-related profile, pathways, and transcription factors in ovarian cancer. PLoS Med 2009;6:e24.
8. Fuchs B, Zhang K, Schabel A, Bolander ME, Sarkar G. Identification of twenty-two candidate markers for human osteogenic sarcoma. Gene 2001;278:245-52.
9. Lassmann S, Weis R, Makowiec F, Roth J, Danciu M, Hopt U, et al. Ar- ray CGH identifies distinct DNA copy number profiles of oncogenes and tumor suppressor genes in chromosomal- and microsatellite-un-
stable sporadic colorectal carcinomas. J Mol Med (Berl) 2007;85:293- 304.
10. Polanowska J, Le Cam L, Orsetti B, Vallés H, Fabbrizio E, Fajas L, et al.
Human E2F5 gene is oncogenic in primary rodent cells and is amplified in human breast tumors. Genes Chromosomes Cancer 2000;28:126- 30.
11. Reimer D, Sadr S, Wiedemair A, Stadlmann S, Concin N, Hofstetter G, et al. Clinical relevance of E2F family members in ovarian cancer: an evaluation in a training set of 77 patients. Clin Cancer Res 2007;13:144- 51.
12. Sharma S, Kelly TK, Jones PA. Epigenetics in cancer. Carcinogenesis 2010;31:27-36.
13. Baxter E, Windloch K, Gannon F, Lee JS. Epigenetic regulation in can- cer progression. Cell Biosci 2014;4:45.
14. Ng JM, Yu J. Promoter hypermethylation of tumour suppressor genes as potential biomarkers in colorectal cancer. Int J Mol Sci 2015;16:2472- 96.
15. Ozdemir F, Altinisik J, Karateke A, Coksuer H, Buyru N. Methylation of tumor suppressor genes in ovarian cancer. Exp Ther Med 2012;4:1092- 6.
16. Fearon ER. Molecular genetics of colorectal cancer. Annu Rev Pathol 2011;6:479-507.
17. Strauss WM. Preparation of genomic DNA from mammalian tissue.
Curr Protoc Mol Biol 2001;Chapter 2:Unit2.2.
18. Li LC, Dahiya R. MethPrimer: designing primers for methylation PCRs. Bioinformatics 2002;18:1427-31.
19. Lee JT, Tsang WH, Chow KL. Simple modifications to standard TRIzol® protocol allow high-yield RNA extraction from cells on re- sorbable materials. J Biomater Nanobiotechnol 2011;2:41-8.
20. Kim TM, Yim SH, Shin SH, Xu HD, Jung YC, Park CK, et al. Clinical implication of recurrent copy number alterations in hepatocellular car-
cinoma and putative oncogenes in recurrent gains on 1q. Int J Cancer 2008;123:2808-15.
21. Hijmans EM, Voorhoeve PM, Beijersbergen RL, van ‘t Veer LJ, Ber- nards R. E2F-5, a new E2F family member that interacts with p130 in vivo. Mol Cell Biol 1995;15:3082-9.
22. Le Cam L, Polanowska J, Fabbrizio E, Olivier M, Philips A, Ng Eaton E, et al. Timing of cyclin E gene expression depends on the regulated asso- ciation of a bipartite repressor element with a novel E2F complex.
EMBO J 1999;18:1878-90.
23. Ciriello G, Gatza ML, Beck AH, Wilkerson MD, Rhie SK, Pastore A, et al. Comprehensive molecular portraits of invasive lobular breast cancer.
Cell 2015;163:506-19.
24. Aziz Z, Sana S, Akram M, Saeed A. Socioeconomic status and breast cancer survival in Pakistani women. J Pak Med Assoc 2004;54:448-53.
25. Ullah F, Khan T, Ali N, Malik FA, Kayani MA, Shah ST, et al. Promoter methylation status modulate the expression of tumor suppressor (RbL2/p130) gene in breast cancer. PLoS One 2015;10:e0134687.
26. Almén MS, Nilsson EK, Jacobsson JA, Kalnina I, Klovins J, Fredriksson R, et al. Genome-wide analysis reveals DNA methylation markers that vary with both age and obesity. Gene 2014;548:61-7.
27. Weng NP, Levine BL, June CH, Hodes RJ. Regulated expression of telomerase activity in human T lymphocyte development and activa- tion. J Exp Med 1996;183:2471-9.
28. Cui H, Kong Y, Zhang H. Oxidative stress, mitochondrial dysfunction, and aging. J Signal Transduct 2012;2012:646354.
29. Jin B, Robertson KD. DNA methyltransferases, DNA damage repair, and cancer. Adv Exp Med Biol 2013;754:3-29.
30. Yu H, Huang YJ, Liu Z, Wang LE, Li G, Sturgis EM, et al. Effects of MDM2 promoter polymorphisms and p53 codon 72 polymorphism on risk and age at onset of squamous cell carcinoma of the head and neck. Mol Carcinog 2011;50:697-706.