INTRODUCTION
Currently, breast cancer in men accounts for <0.5%
of all male cancer diagnoses made annually, and con- stitutes approximately 1% of all breast cancer cases in the United States [1]. Although male breast cancer is
uncommon, its incidence is increasing [2,3]. Due to its rarity, men with breast cancer have been largely un- derrepresented in clinical trials and population studies.
At present time, no results from prospective national or international clinical trials, solely focusing on male breast cancer patients, have been reported. This pau-
Received: Sep 11, 2020 Accepted: Oct 15, 2020 Published online Dec 4, 2020 Correspondence to: Elizabeth B. Elimimian https://orcid.org/0000-0001-5168-5781
Department of Hematology-Oncology, Maroone Cancer Center, Cleveland Clinic Florida, 2950 Cleveland Clinic Blvd, Weston, FL 33331, USA.
Tel: +1-954-659-5840, Fax: +1-954-659-5810, E-mail: [email protected]
*Abstract selected for poster presentation at the 2019 San Antonio Breast Cancer Symposium.
Copyright © 2021 Korean Society for Sexual Medicine and Andrology
Male Breast Cancer: A Comparative Analysis from the National Cancer Database
Elizabeth B. Elimimian1 , Leah Elson1 , Hong Li2 , Hong Liang1 , Nadeem Bilani1 , Emily C. Zabor2,3 , Abby Statler3 , Zeina Nahleh1
1Department of Hematology-Oncology, Maroone Cancer Center, Cleveland Clinic Florida, Weston, FL, 2Department of Quantitative Health Sciences, Cleveland Clinic, 3Taussig Cancer Institute, Cleveland Clinic, Cleveland, OH, USA
Purpose:
Purpose: Breast cancer (BC) in males accounts for <0.5% of all male cancer diagnoses and ~1% of all BCs in the United States. We sought to describe clinicopathologic characteristics among male and female BC patients and differences in overall survival (OS) through the National Cancer Database over 13 years (2004–2016).
Materials and Methods:
Materials and Methods: Secondary to the 1:99 ratio of male to female BC cases, we randomly selected female cases for equal comparison to males cases by diagnosis year. Chi-square and t-tests compared demographic and tumor characteristics. OS was examined using Kaplan–Meier survival analysis.
Results:
Results: Among the ~2.7 million BC patients, 9 per 1,000 BCs were in males, the rate remained similar over time. The mean (SD) age was 64.9±13.0 years for males and 60.7±13.6 years for females. Most of the male BC cases were white (non-Hispanic) (n=19,015 [80.2%]), clinical stage I (n=7,353 [32.1%]) or stage II disease (n=7,923 [34.6%]), and tumors were moderate or poorly differentiated (84.5%). Males exhibited more comorbidities, presented with a larger proportion of disease, and de- creased OS (p<0.005) than females. Male OS was >10% lower at 5-years and nearly 20% lower at 10-years for males. More males had primary BC tumors under the nipple; the 10-year OS rate for this site was 48.8%.
Conclusions:
Conclusions: This study reports clinicopathologic characteristics of a large cohort of male BC. Males present at older age, with a greater comorbidity index, at later stages of disease. Increased education regarding the continued risks of male breast cancer may be warranted.
Keywords:
Keywords: Breast neoplasms, male; Epidemiology; Neoplasms; Patient-relative outcomes
This is an Open Access article distributed under the terms of the Creative Commons Attribution Non-Commercial License (http://creativecommons.org/licenses/by-nc/4.0) which permits unrestricted non-commercial use, distribution, and reproduction in any medium, provided the original work is properly cited.
pISSN: 2287-4208 / eISSN: 2287-4690 World J Mens Health 2021 Jul 39(3): 506-515 https://doi.org/10.5534/wjmh.200164
city of male-specific information necessitates the use of results from clinical trials focused on ‘female’ breast cancer patients to inform disease management. As such, the treatment of male breast cancer patients pre- dominantly mirrors that of postmenopausal women [4].
While breast cancer represents a relatively small proportion of all diagnosed cancers among men, it is associated with one of the highest mortality rates. In 2019, the American Cancer Society reported that more than three times as many men will be diagnosed with testicular cancer than with breast cancer. However, paradoxically, over the last five years, more men have died from breast cancer than testicular cancer [5,6].
These reported findings underscore the importance of continuing research for male-specific breast cancer.
Therefore, population-based studies may be helpful in providing significant insight into these rare tumor types, and may assist in the subsequent development of treatment guidelines and recommendations.
Using a large dataset extracted from the National Cancer Database (NCDB), we sought to investigate the demographic and clinical differences between male vs.
female breast cancer patients, and how these differenc- es may contribute to disparities in overall survival (OS).
We also sought to further explore the mortality gap between male and female patients with breast cancer.
MATERIALS AND METHODS
1. Subject and ethics statement
After obtaining Cleveland Clinic Institutional Re- view Board (IRB) approval (No. FLA 19-044), we con- ducted a retrospective analysis of male and female patients diagnosed with breast cancer between 2004 and 2016, as reported to the NCDB. Male and female designations were made based upon biological sex. The NCDB is a United States cancer registry that serves as a repository for cancer diagnoses and clinical outcomes.
Information in the NCDB represents more than 1,500 medical facilities utilizing standardized reporting mea- sures approved by the Commission on Cancer and the American College of Surgeons [7]. Currently, the NCDB captures more than 70% of cancer cases diagnosed in the United States [7]. Access to the NCDB registry was achieved based on a Participant User File award granted to the principal investigator (Z.N.).
Using the NCDB dataset, we identified both female
through stage IV breast cancer, diagnosed between 2004 and 2016. The International Classification of Dis- ease for Oncology (ICD-O3) codes were used to classify histologic information. The base population included n=2,696,734 primary cases of male and female breast cancer patients. Overall, 23,990 male patients were included in our analyses. Because of an approximate 1:99 ratio of male to female patients included within the dataset, the same number of female breast cancer patients as male breast cancer patients, in each diag- nosis year, were randomly selected for this study using simple random sample method.
2. Statistical considerations
Chi-square and t-tests, where appropriate, were used to compare demographic and clinical characteristics between the male and sampled female group, includ- ing: categorical age (<50 years, 50–69 years, ≥70 years), race (white, black, Hispanic, Asian, and other including Pacific Islander, Native American, and other races), insurance type (not insured, private insurance, Medic- aid, Medicare, other government), categorical income (<$30,000, $30,000–34,999, $35,000–45,999, ≥$46,000), area of residence (metro, urban, rural), clinical staging (0, I, II, III, IV), disease grade (well differentiated, mod- erately differentiated, poorly/undifferentiated), location of tumor at breast (“primary tumor site”: axillary tail, upper-outer quadrant, upper-inner quadrant, central/
nipple, lower-outer quadrant, lower-inner quadrant, overlapping), invasive behavior (yes or no), estrogen receptor (ER+) status (yes or no), progesterone recep- tor (PR+) status (yes or no), human epidermal growth factor receptor 2 (HER2+) status (yes or no), and Charl- son–Deyo comorbidity score (0, 1, 2, ≥3). All variables included less than 10% of missing data, except for grade (11.7%) and HER2 status (52.2% overall; ~3% af- ter 2010). HER2 status was not widely reported to the NCDB until after 2009. Follow-up time was calculated from the date of diagnosis to the date of death or last alive contact, and patients still alive were censored for OS. The Kaplan–Meier method estimated OS accord- ing to sex, and the log-rank test was used to compare sexes. Both 5-year and 10-year survival estimates are presented.
Multivariable analyses using Cox proportional hazard models were conducted to understand which demographic and clinical factors were independently
Table 1. Baseline characteristics of study population
Variable Total No. of subject Male (n=23,990) Female (n=23,990) p-value
Age at diagnosis (y) 47,980 64.9±13.0 60.7±13.6 <0.001
<50 3,150 (13.1) 5,410 (22.6)
50–70 12,378 (51.6) 12,574 (52.4)
≥70 8,462 (35.3) 6,006 (25.0)
Race 47,465 <0.001
White 19,015 (80.2) 18,686 (78.7)
Black 3,123 (13.2) 2,861 (12.0)
Hispanic 881 (3.7) 1,274 (5.4)
Asian 499 (2.1) 746 (3.1)
Other 194 (0.8) 186 (0.78)
Insurance 47,096 <0.001
Not insured 566 (2.4) 466 (2.0)
Private insurance/managed care 10,244 (43.6) 12,719 (53.9)
Medicaid 1,032 (4.4) 1,408 (6.0)
Medicare 11,301 (48.1) 8,744 (37.1)
Other government 357 (1.5) 259 (1.1)
Income 46,514 <0.001
<$30,000 2,742 (11.8) 2,432 (10.4)
$30,000–34,999 3,671 (15.8) 3,501 (15.0)
$35,000–45,999 6,197 (26.7) 6,272 (26.9)
≥$46,000 10,630 (45.7) 11,069 (47.6)
Area of residence 47,980 0.008
Metro 19,982 (83.3) 20,232 (84.3)
Urban 2,975 (12.4) 2,793 (11.6)
Rural 1,033 (4.3) 965 (4.0)
Clinical staging 46,107 <0.001
Stage 0 2,914 (12.7) 4,697 (20.3)
Stage I 7,353 (32.1) 9,674 (41.7)
Stage II 7,923 (34.6) 5,837 (25.2)
Stage III 3,267 (14.3) 2,049 (8.8)
Stage IV 1,461 (6.4) 932 (4.0)
Grade 42,364 <0.001
Well differentiated 3,307 (15.5) 4,514 (21.5)
Moderately differentiated 10,658 (50.0) 9,238 (43.9)
Poorly or undifferentiated 7,360 (34.5) 7,287 (34.6)
Ductal histology 47,980 17,971 (74.9) 16,035 (66.8) <0.001
Primary tumor site 47,980 <0.001
Axillary tail 57 (0.24) 103 (0.43)
Upper-outer quadrant 4,082 (17.0) 7,941 (33.1)
Upper-inner quadrant 1,238 (5.2) 2,581 (10.8)
Central/nipple 7,879 (32.8) 1,385 (5.8)
Lower-outer quadrant 974 (4.1) 1,674 (7.0)
Lower-inner quadrant 643 (2.7) 1,327 (5.5)
Overlapping/NOS 9,117 (38.0) 8,979 (37.4)
Invasive behavior 47,980 21,008 (87.6) 19,264 (80.3) <0.001
ER+ 44,398 20,432 (92.1) 18,025 (81.2) <0.001
PR+ 43,888 18,261 (83.1) 15,520 (70.8) <0.001
HER2+ (available 2010 or later) 22,928 1,481 (12.4) 1,564 (14.2) <0.001
groups. Independent factors were identified from de- mographic and clinical factors listed in Table 1 (except for HER2 receptor status) using stepwise model selec- tion procedures with significance level of p<0.01 as entry-criteria and p<0.001 as stay-criteria, due to the large sample size. For the first model, the hazard ratio (HR) for male compared to female was initially esti- mated using the inclusion of age, clinical staging, and Charlson–Deyo comorbidity score. For the next sub- sequent model, independent predictors were included with demonstrated impact on OS.
Due to biological differences, a gender stratified anal- ysis was performed to identify common and uncommon predictors in both the male and female groups.
All statistical analyses were conducted with SAS ver. 9.4 (SAS Institute Inc. Cary, NC, USA). Two-sided p-values are presented, p<0.001 is considered as signifi- cant.
RESULTS
A total study population of 47,980 (23,990 males and 23,990 females) was included in our analyses. Male and female median (interquartile range) follow-up time from diagnosis to death or last contact was 4.0 years (1.9–6.9) and 4.7 years (2.3–7.7), respectively. Compara- tive demographic and clinical characteristics between groups are presented in Table 1.
Univariate analyses (Table 1) showed that the follow- ing demographic and clinical characteristics were sig- nificantly different (p<0.001) according to sex: age, race, insurance status, income, clinical staging, Charlson–
Deyo comorbidity score, disease grade, primary tumor site, invasive behavior, ER+ status, and PR+ status.
Of note at diagnosis, male patients were older, present with later clinical staging, exhibit worse disease grade, had more ductal histology, and worse comorbidity
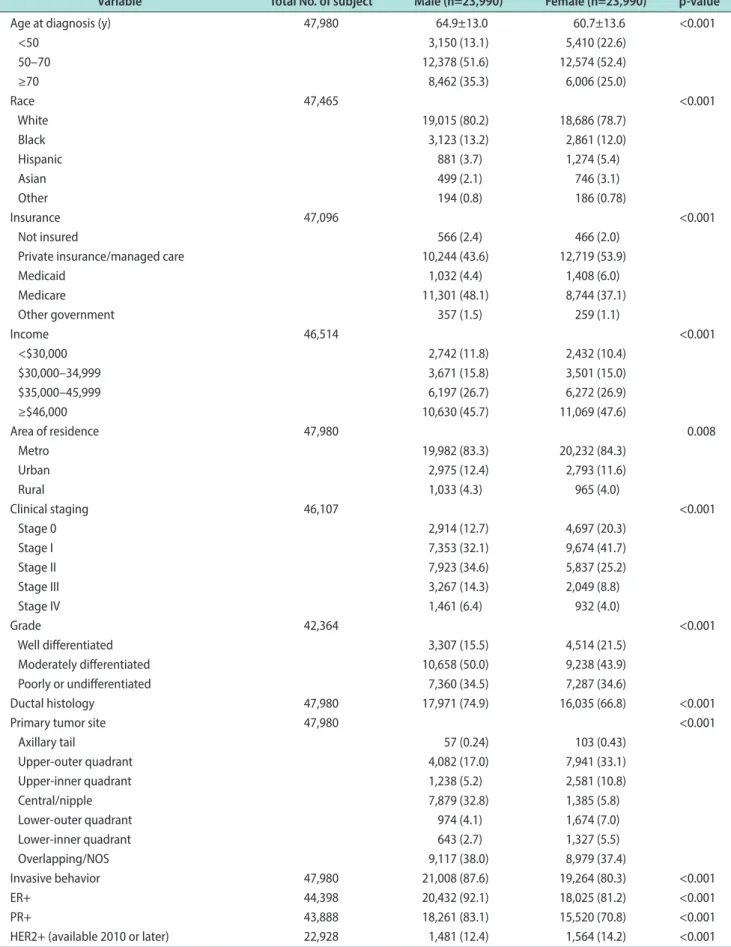
scores. In addition, the distribution of primary tumor site was different between male and females groups:
with males exhibiting more central/nipple disease ten- dency (32.8% vs. 5.8%), and females exhibiting more up- per-outer quadrant disease tendency (33.1% vs. 17.0%).
There were similar rates of primary tumors with over- lapping sites (Fig. 1). The male group also demonstrated a lower rate of private insurance coverage compared with the female group. Male breast cancer patients presented more frequently with ER+ (92.1% vs. 81.2%, p<0.001) and PR+ (83.1% vs. 70.8%, p<0.001) disease than female patients (Table 1).
Notably, males exhibited significantly worse OS (p<0.001) than females. The 5-year OS was 72.8% in males vs. 83.4% in females, and the 10-year survival was 52.5% in males vs. 69.1% in females (Fig. 2A). Ad- ditionally, the median OS was 10.7 years for the male group, but the median survival for the female group was not reached. The unadjusted hazard of early death was 75% higher (unadjusted HR, 1.75; 95% confidence interval [CI], 1.69–1.82) in males than in females (Fig.
2B). In a stepwise, multivariable model, after adjusting for age, clinical stage, and Charlson–Deyo comorbid- Table 1. Continued.
Variable Total No. of subject Male (n=23,990) Female (n=23,990) p-value
Charlson–Deyo score 47,980 <0.001
0 18,888 (78.7) 20,387 (85.0)
1 3,741(15.6) 2,842 (11.8)
2 976 (4.1) 562 (2.3)
≥3 385 (1.6) 199 (0.83)
Values are presented as number only, mean±standard deviation, or number (%).
NOS: not otherwise specified, ER+: estrogen receptor, PR+: progesterone receptor, HER2+: human epidermal growth factor receptor 2.
Fig. 1. Primary breast cancer (BC) tumor site, stratified by sex.
Malevs.female primary BC sites
Axillary tail of breast
Axillary tail of breast
Male Female
Upper-inner quadrant
Upper-outer quadrant
Upper-outer quadrant
Lower-outer quadrant
Lower-outer quadrant
Overlapping lesion 38% Overlapping lesion 37%
Lower-inner quadrant
17% 5%
4% 3%
<1%
11% 33%
7%
6%
6%
<1%
ity score, with 87.5% of the study sample, the hazard of early death was still observed to be higher in the male group (adjusted HR, 1.25; 95% CI, 1.20–1.30) (Fig.
2B). These results remained the same (adjusted HR, 1.28; 95% CI, 1.21–1.35) when expanding the analyses to a second, stepwise multivariable model to include additional independent protectors identified from this study and reported elsewhere, including: race, income, insurance type, grade, and both ER+ and PR+ status, in addition to the primary tumor site, which has been uniquely identified from this study with 70% of the study sample (Table 2). The age (mean, 62.9 vs. 62.2 years old), clinical staging (III or IV) (16.5% vs. 17.4%), and grade 3 (34.6% vs. 34.2%) were similar between pa- tients included in multivariate analysis and those who were excluded. The 5-year (70.8% vs. 75.6%–84.9%) and the 10-year (48.8% vs. 58.4%–69.2%) OS for primary tu- mors originating under the nipple or the central breast location, was the worst compared to all other locations (Table 3).
Owing to the inherent biological differences between meles and females, multivariable analyses were next stratified by gender. All variables listed in Table 1 (ex- cept HER2+ status data, which was not available until after 2009) were included in the analyses to identify factors independently associated with OS separately for males and females (Table 2). Due to variance in completeness of data, the final multivariable model in- cluded 70% of the study population for both males and females after excluding cases with missing values. The top three factors identified as being associated with
early death, in both males and females, were: late clini- cal stage, older age, and Charlson–Deyo score. Other factors associated with early death for both males and females included: being African American, having low income, using Medicaid insurance type, and presenting with poorer grade. With respect to uncommon factors, primary tumor site was associated with early death for males only (Table 2).
DISCUSSION
This analysis represents one of the largest studies evaluating demographic characteristics, clinical charac- teristics, and survival outcomes associated with gender disparities among patients with breast cancer. Similar to previous reports, patients with male breast cancer were more likely to have ER+ and PR+ tumors, ductal histology, and present at later stages of disease, com- pared to female patients with breast cancer [8-11]. Sur- vival analyses in this study indicated that males with breast cancer have an observed survival disadvantage when compared to their female counterparts, demon- strating significantly poorer 5-year and 10-year OS.
These results may be partially explained by indepen- dent factor analyses indicating that males were found to be older at diagnosis (mean age 64.9 years for males vs. 60.7 years for females), present with later stages of disease, exhibit different primary tumor location, and experience different disease management, when com- pared with females.
These findings corroborate earlier studies, which also Fig. 2. (A) Comparison of overall survival (OS) in male and female breast cancer; numbers indicate % OS at 5-years and 10-years in each group. (B) Hazard ratio of death for male vs. female patients (adjusted and unadjusted). aAdjusted for age, clinical stage, and Charlson–Deyo comorbidity score. CI: confidence interval.
0 100
75
50
25
15
Overallsurvival(%)
Years from diagnosis 0
5 10
Male Female p (logrank) <0.001
83.4
72.8
69.1
52.5
1.00 Unadjusted
Adjusteda
2.00 Hazard ratio (95% CI)
1.25 1.50 1.75
1.25 (1.20 1.30) 1.25 (1.20 1.30)
1.75 (1.69 1.82) 1.75 (1.69 1.82)
A B
report the median age for male breast cancer patients to be in the 60s [2,12-14]. Older patients exhibit a higher
toxicity of systemic or radiotherapies. Additionally, age related-immune dysfunction/immunosenescence results Table 2. Factors independently associated with OS in male and female
Variable
Male Female
No. of subject
KM OS (%) Cox multivariable
No. of subject
KM OS (%) Cox multivariable 5-year OS
(95% CI) HR (95% CI) p-value 5-year OS
(95% CI) HR (95% CI) p-value Stage
Stage 0 2,679 89.6 (88.3–91.0) 1 4,312 93.9 (93.0–94.7) 1
Stage I 6,665 83.7 (82.7–84.7) 1.36 (1.15–1.60) <0.001 8,744 89.1 (88.4–89.9) 1.57 (1.34–1.83) <0.001 Stage II 7,205 73.2 (72.0–74.4) 2.06 (1.76–2.42) <0.001 5,355 82.3 (81.1–83.4) 2.46 (2.11–2.86) <0.001 Stage III 3,003 58.1 (56.1–60.2) 3.38 (2.88–3.98) <0.001 1,891 67.1 (64.8–69.5) 4.85 (4.13–5.71) <0.001 Stage IV 1,313 19.8 (17.3–22.3) 12.26 (10.33–14.55) <0.001 819 23.5 (20.1–26.9) 17.38 (14.61–20.68) <0.001
Age (y)
<50 2,917 84.1 (82.5–85.6) 1 4,997 90.7 (89.8–91.7) 1
50–70 11,257 80.4 (79.5–81.2) 1.20 (1.07–1.35) 0.002 11,432 88.1 (87.4–88.8) 1.40 (1.24–1.58) <0.001 ≥70 7,712 57.8 (56.5–59.1) 2.64 (2.32–3.01) <0.001 5,471 67.3 (65.9–68.7) 3.65 (3.17–4.20) <0.001
Charlson–Deyo score
0 17,245 76.8 (76.0–77.5) 1 18,637 85.4 (84.8–85.9) 1
1 3,444 63.6 (61.7–65.5) 1.49 (1.39–1.60) <0.001 2,590 75.9 (74.0–77.8) 1.29 (1.17–1.42) <0.001 2 884 46.6 (42.8–50.4) 2.34 (2.09–2.61) <0.001 508 60.7 (55.9–65.6) 2.09 (1.78–2.46) <0.001 ≥3 313 32.0 (25.9–38.0) 2.71 (2.31–3.19) <0.001 165 45.5 (36.9–54.1) 3.56 (2.80–4.52) <0.001
Insurance type
Not insured 531 67.7 (62.9–72.4) 1.55 (1.27–1.88) <0.001 437 76.8 (72.3–81.3) 1.40 (1.06–1.83) 0.016
Private 9,399 84.2 (83.4–85.1) 1 11,684 90.6 (90.0–91.2) 1
Medicaid 927 67.4 (63.7–71.0) 1.72 (1.48–1.99) <0.001 1,266 80.4 (77.9–83.0) 1.68 (1.44–1.97) <0.001 Medicare 10,256 63.3 (62.2–64.4) 1.53 (1.41–1.65) <0.001 7,898 73.6 (72.5–74.7) 1.50 (1.35–1.66) <0.001 Other government 312 67.7 (61.2–74.3) 1.45 (1.11–1.90) 0.007 239 90.5 (86.3–94.8) 1.12 (0.71–1.77) 0.62
Grade
1 3,023 83.0 (81.5–84.6) 1 4,121 88.9 (87.8–90.0) 1
2 9,633 75.3 (74.3–76.3) 1.13 (1.03–1.25) 0.011 8,339 84.9 (84.0–85.8) 1.1113 (1.0005–1.2345) 0.049 3 6,735 65.9 (64.6–67.2) 1.41 (1.27–1.55) <0.001 6,661 78.6 (77.5–79.8) 1.32 (1.17–1.48) <0.001
Race
White 17,403 72.8 (72.0–73.5) 1 17,146 83.6 (83.0–84.3) 1
Black 2,798 68.3 (66.3–70.4) 1.05 (0.96–1.15) 0.28 2,571 77.1 (75.2–78.9) 1.15 (1.03–1.28) 0.012 Hispanic 805 80.7 (77.4–84.0) 0.66 (0.55–0.80) <0.001 1,133 88.1 (85.9–90.4) 0.70 (0.58–0.86) <0.001 Asian 447 80.8 (76.3–85.2) 0.755 (0.576–0.988) 0.041 669 90.6 (87.9–93.3) 0.63 (0.47–0.84) 0.002 Other 170 79.5 (71.9–87.1) 0.81 (0.53–1.24) 0.34 164 88.8 (83.1–94.5) 0.72 (0.41–1.27) 0.26
Income
<$30,000 2,510 66.7 (64.5–68.8) 1.29 (1.18–1.42) <0.001 2,192 76.5 (74.4–78.5) 1.19 (1.05–1.33) 0.004 $30,000–$34,999 3314 67.3 (65.4–69.2) 1.28 (1.18–1.38) <0.001 3,203 80.4 (78.8–82.0) 1.13 (1.02–1.26) 0.016 $35,000–$45,999 5,645 72.4 (71.1–73.8) 1.12 (1.04–1.20) 0.002 5,748 81.8 (80.7–83.0) 1.02 (0.94–1.12) 0.59
≥$46,000 9,733 76.3 (75.4–77.3) 1 10,095 86.4 (85.7–87.2) 1
PR status
Negative 3,424 66.4 (64.6–68.2) 1.27 (1.18–1.36) <0.001 - - - -
Positive 16,515 74.1 (73.3–74.9) 1 - - - -
ER status
Negative - - - - 3,826 76.2 (74.7–77.7) 1.39 (1.26–1.52) <0.001
Positive - - - - 16,360 85.1 (84.4–85.7) 1
which may actually promote the progression or devel- opment of cancer [15]. In elderly patients, the immune system produces myeloid cells from the bone marrow at an increased frequency and subsequently decreases B and T cell progenitors [15]. Exposure to chemother- apy can accelerate these processes, making older pa- tients more vulnerable to infection and chemotherapy- induced side effects [16]. Clinical trials which evaluate male breast cancer patients, stratified by age, would further the understanding of chemotherapy-dependent effects in elderly patients, at the cellular level.
Another possible contributing factor to the mortal- ity differences noted between sex is the differences in stage at diagnosis. Our analyses revealed that male patients were diagnosed with later stage breast cancer, compared to female patients, a trend widely supported in the literature [8-11]. However, mortality differences between genders have been observed, even in early stages of breast cancer [17]. This supports the notion
that factors beyond age and staging may also contrib- ute to the survival disparities noted here. In fact, in this study, after adjusting for age, clinical stage, and comorbidity index, the risk of death for breast cancer among male patients decreased by 50%, but male were
‘still’ observed to exhibit a significantly higher risk of death than female.
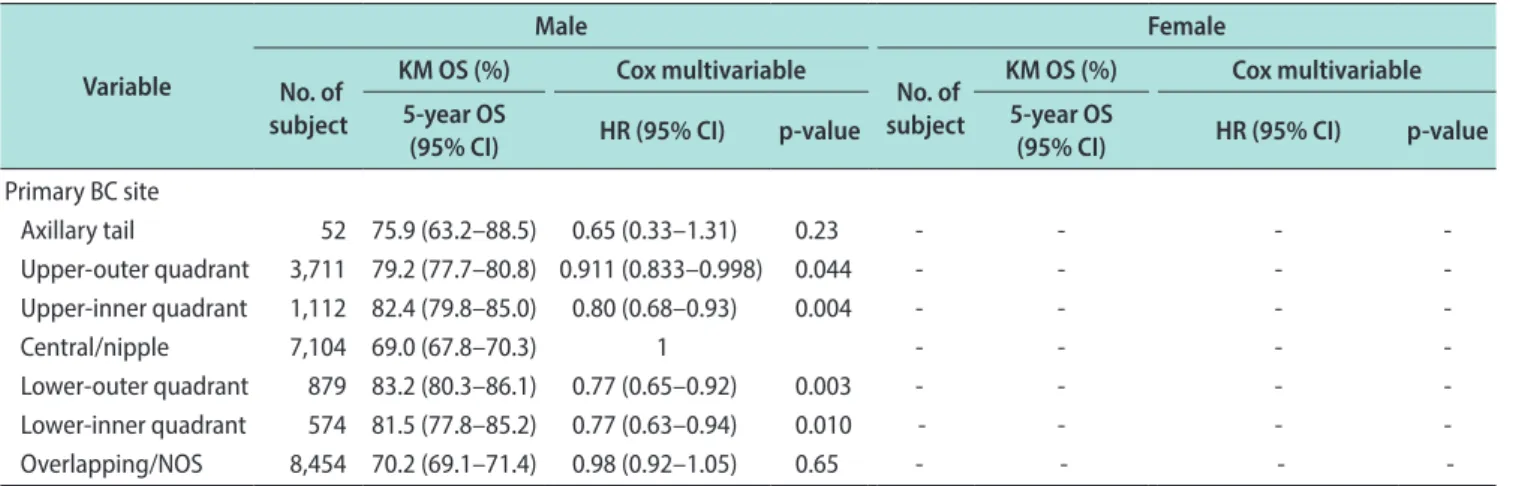
Sex-based survival differences may also be due to primary tumor site. Among the unique observations of our analyses, is the effect of primary tumor site on breast cancer mortality, stratified by gender. Male with breast cancer had more tumors diagnosed under the nipple/central breast area (33%) compared to fe- male with breast cancer (6%). This clinicopathologic difference may contribute to the adverse prognoses observed in male, as the 5-year OS for centrally-located breast cancers was significantly worse than tumors in the upper outer quadrant of the breast (71% vs. 83%, respectively). Similarly, at 10 years, the OS for nipple/
central tumors was significantly worse than the sur- vival rate for tumors in the upper-outer quadrant (49%
vs. 69%, respectively). Unlike clinical grade, lymph node involvement, and hormone receptors and HER2 status, primary breast tumor location is not widely regarded as a prognostic factor. However, several studies have reported ‘some’ association between breast tumor loca- tion and OS. An analysis of 305,443 female with breast cancer, as recorded in the SEER database between 1990 and 2009, found that mortality was increased for pri- mary tumors in the left central portion of the breast as well as the left and right lower outer quadrants [18].
Similar studies found that breast tumors in the me- Table 3. Overall survival and primary breast cancer site (p<0.001)
Primary site % of 5-year survival (95% CI)
% of 10-year survival (95% CI) Overall 78.1 (77.7–78.6) 60.9 (60.2–61.6) Axillary tail 79.7 (72.7–86.6) 63.8 (52.9–74.8) UO quadrant 83.2 (82.4–84.0) 68.9 (67.6–70.2) UI quadrant 84.9 (83.5–86.3) 69.2 (66.6–71.8) Central/nipple 70.8 (69.6–71.9) 48.8 (47.0–50.5) LO quadrant 84.0 (82.2–85.7) 68.3 (65.2–71.3) LI quadrant 84.2 (82.2–86.1) 67.1 (63.7–70.5) Overlapping 75.6 (74.8–76.3) 58.4 (57.2–59.6) CI: confidence interval, UO: upper-outer, UI: upper-inner, LO: lower- outer, LI: lower-inner.
Table 2. Continued
Variable
Male Female
No. of subject
KM OS (%) Cox multivariable
No. of subject
KM OS (%) Cox multivariable 5-year OS
(95% CI) HR (95% CI) p-value 5-year OS
(95% CI) HR (95% CI) p-value
Primary BC site
Axillary tail 52 75.9 (63.2–88.5) 0.65 (0.33–1.31) 0.23 - - - -
Upper-outer quadrant 3,711 79.2 (77.7–80.8) 0.911 (0.833–0.998) 0.044 - - - -
Upper-inner quadrant 1,112 82.4 (79.8–85.0) 0.80 (0.68–0.93) 0.004 - - - -
Central/nipple 7,104 69.0 (67.8–70.3) 1 - - - -
Lower-outer quadrant 879 83.2 (80.3–86.1) 0.77 (0.65–0.92) 0.003 - - - -
Lower-inner quadrant 574 81.5 (77.8–85.2) 0.77 (0.63–0.94) 0.010 - - - -
Overlapping/NOS 8,454 70.2 (69.1–71.4) 0.98 (0.92–1.05) 0.65 - - - -
OS: overall survival, KM: Kaplan–Meier, CI: confidence interval, HR: hazard ratio, PR+: progesterone receptor, ER+: estrogen receptor, BC: breast cancer, NOS: not otherwise specified, -: not available.
dial breast adversely impacted OS [19]. Although these studies focused on a smaller population of patients and included only females, our analyses adds to the existing literature and further suggests an association between primary tumor site and mortality.
Another possible explanation for the survival dispar- ity between male and female breast cancer patients is based on management. A recent NCDB analysis, be- tween 2004 and 2014, revealed a shift in the manage- ment preferences among male breast cancer patients, with more men choosing to receive mastectomy vs.
breast-conserving surgery (BCS) [20]. One possible ex- planation for this trend is that male patients wanted to avoid the radiotherapy that accompanies BCS [14,20,21]. But Yadav et al [14] reported a possible cor- relation between total mastectomy and decreased OS.
Additionally, there was a significant survival benefit for male patients who received adjuvant radiotherapy with BCS, even among stage I male breast cancer cases [14], which may underscore the potential importance of radiotherapy for patients with male breast cancer.
Future research evaluating gender survival differences by management can improve the mortality of male breast cancer patients.
In our analysis, we noted that the 5-year OS was lowest for the following combination of factors for male patients with breast cancer: >70 years of age, >2 comorbidities, median income <$30,000, and insurance with Medicare (compared to other types of insurance).
Unfortunately, the clinical characteristics of those with the poorest survival outcomes among their respective subcategory is typically not reflective of the majority of patients recruited into clinical trials. For instance, older patients are significantly underrepresented in clinical cancer trials [22]; while younger, healthier, and more highly educated patients are well represented [23].
Even those over the age of 64 years, with universal access to Medicare, were found to be less likely to par- ticipate in a clinical trial [24]. This data calls for more inclusive participation in clinical trials as a crucial step towards addressing the survival gap between male and female breast cancer patients.
The current paucity of medical resources and male- specific preventative guidelines might also present an obstacle to closing the mortality gap between genders.
Since the implementation of public health initiatives in the 1980s, which promoted the use of screening mam-
have decreased significantly [25]. In fact, the female breast cancer death rate reached its peak in 1989, and has been steadily declining in the years since [5], attrib- utable to early detection via regular screening, symp- tom awareness, and management. The development and wide implementation of breast cancer screening recommendations for high-risk male populations might similarly lead to improvements in early detection and survival. Currently, breast cancer screening recommen- dations for male exist for those with a genetic predis- position (including BRCA1 or BRCA2 gene mutations) and/or a strong family history (1st degree relative with confirmed mutation or breast cancer diagnosis at age 40 or younger) [26]. The current clinical efficacy of the implementation of these guidelines remains unclear.
It is our hope that the information provided from our analysis of the NCDB is used to shape future medical guidelines and practical recommendations towards the management of male breast cancer.
The strengths of this analysis include: 1) the 13-year duration of data collection, which allowed for the cal- culation of median survivorship in males and for the analysis of patient outcomes over time; 2) the large sample size of males, considering the rarity of this dis- ease; 3) utilizing data collected from a national registry which allowed for a homogenous sampling of patients across accredited centers in the United States; 4) the standardized method of data collection within the NCDB which maximized the fidelity of the data col- lected. The limitations of this study include those that are typically encountered when utilizing a registry- based data set such as limited pathologic information, comorbidity information limited to categorical ranking, and lack of detailed treatment categories.
CONCLUSIONS
This analysis of a large population of male and fe- male patients, diagnosed with breast cancer between 2004 and 2016, suggests that male patients with breast cancer were older at diagnosis, exhibited more comor- bidities, presented with a larger proportion of disease metastasis, and exhibited more poorly differentiated tumor grades. Independent factors found to be associ- ated with poorer OS were: male sex, older age, African American ethnicity, presenting with 2 or more comor- bidities, having lower income, presenting at later clini-
Based on the above data, we propose four recommen- dations: 1) strongly implementing specific breast can- cer screening recommendations for high risk male; 2) considering sex specific differences including primary tumor site as prognostic criteria with implications on mortality and treatment e.g., inclusion of radiation; 3) widening the clinical trials eligibility criteria to include historically underrepresented male with breast cancer;
and 4) increasing efforts to promote awareness of dis- parities in male vs. female breast cancer.
Conflict of Interest
The authors have nothing to disclose.
Author Contribution
Conceptualization: EBE, ZN. Data curation: ECZ, HL, HL. For- mal analysis: ECZ, HL, HL. Supervision: ZN. Writing – original draft: EBE. Writing – review & editing: LE, NB, AS, ZN.
REFERENCES
1. Siegel RL, Miller KD, Jemal A. Cancer statistics, 2016. CA Cancer J Clin 2016;66:7-30.
2. Giordano SH, Cohen DS, Buzdar AU, Perkins G, Hortobagyi GN. Breast carcinoma in men: a population-based study.
Cancer 2004;101:51-7.
3. Hodgson NC, Button JH, Franceschi D, Moffat FL, Living- stone AS. Male breast cancer: Is the incidence increasing?
Ann Surg Oncol 2004;11:751-5.
4. Hassett MJ, Somerfield MR, Baker ER, Cardoso F, Kansal KJ, Kwait DC, et al. Management of male breast cancer: ASCO guideline. J Clin Oncol 2020;38:1849-63.
5. United States Cancer Statistics Working Group. United States cancer statistics: 1999-2012 incidence and mortality web- based report. Atlanta: U.S. Department of Health & Human Services, Centers for Disease Control and Prevention, and National Cancer Institute; 2015.
6. Tarver T. Book reviews. Cancer facts & figures 2012.
American Cancer Society (ACS). J Consum Health Internet 2012;16:366-7.
7. Bilimoria KY, Stewart AK, Winchester DP, Ko CY. The Na- tional Cancer Data Base: a powerful initiative to improve can- cer care in the United States. Ann Surg Oncol 2008;15:683-90.
8. Miao H, Verkooijen HM, Chia KS, Bouchardy C, Pukkala E, Larønningen S, et al. Incidence and outcome of male breast cancer: an international population-based study. J Clin Oncol
2011;29:4381-6.
9. Giordano SH. Breast cancer in men. N Engl J Med 2018;378:2311-20.
10. Cardoso F, Bartlett JMS, Slaets L, van Deurzen CHM, van Leeuwen-Stok E, Porter P, et al. Characterization of male breast cancer: results of the EORTC 10085/TBCRC/BIG/
NABCG International Male Breast Cancer Program. Ann Oncol 2018;29:405-17.
11. Anderson WF, Jatoi I, Tse J, Rosenberg PS. Male breast can- cer: a population-based comparison with female breast can- cer. J Clin Oncol 2010;28:232-9.
12. Cardoso F, Bartlett JMS, Slaets L, van Deurzen CHM, van Leeuwen-Stok E, Porter P, et al. Characterization of male breast cancer: results of the EORTC 10085/TBCRC/BIG/
NABCG International Male Breast Cancer Program. Ann Oncol 2017;29:405-17.
13. Masci G, Caruso M, Caruso F, Salvini P, Carnaghi C, Gior- dano L, et al. Clinicopathological and immunohistochemical characteristics in male breast cancer: a retrospective case se- ries. Oncologist 2015;20:586-92.
14. Yadav S, Karam D, Bin Riaz I, Xie H, Durani U, Duma N, et al. Male breast cancer in the United States: treatment pat- terns and prognostic factors in the 21st century. Cancer 2020;126:26-36.
15. Bailur JK, Pawelec G, Hatse S, Brouwers B, Smeets A, Neven P, et al. Immune profiles of elderly breast cancer patients are altered by chemotherapy and relate to clinical frailty. Breast Cancer Res 2017;19:20.
16. Onyema OO, Decoster L, Njemini R, Forti LN, Bautmans I, De Waele M, et al. Chemotherapy-induced changes and im- munosenescence of CD8+ T-cells in patients with breast can- cer. Anticancer Res 2015;35:1481-9.
17. Wang F, Shu XO. Lead-time bias in the analyses of overall mortality of breast cancer in men vs women-reply. JAMA Oncol 2020;6:442.
18. Bao J, Yu KD, Jiang YZ, Shao ZM, Di GH. The effect of lat- erality and primary tumor site on cancer-specific mortality in breast cancer: a SEER population-based study. PLoS One 2014;9:e94815.
19. Gaffney DK, Tsodikov A, Wiggins CL. Diminished survival in patients with inner versus outer quadrant breast cancers. J Clin Oncol 2003;21:467-72.
20. Mahmood U, Hanlon AL, Koshy M, Buras R, Chumsri S, Tkaczuk KH, et al. Increasing national mastectomy rates for the treatment of early stage breast cancer. Ann Surg Oncol 2013;20:1436-43.
21. Kummerow KL, Du L, Penson DF, Shyr Y, Hooks MA. Na- tionwide trends in mastectomy for early-stage breast cancer.
JAMA Surg 2015;150:9-16.
22. Hutchins LF, Unger JM, Crowley JJ, Coltman CA Jr, Albain KS. Underrepresentation of patients 65 years of age or older in cancer-treatment trials. N Engl J Med 1999;341:2061-7.
23. Mohd Noor A, Sarker D, Vizor S, McLennan B, Hunter S, Suder A, et al. Effect of patient socioeconomic status on ac- cess to early-phase cancer trials. J Clin Oncol 2013;31:224-30.
24. Unger JM, Hershman DL, Albain KS, Moinpour CM, Peters-
en JA, Burg K, et al. Patient income level and cancer clinical trial participation. J Clin Oncol 2013;31:536-42.
25. Siegel RL, Miller KD, Jemal A. Cancer statistics, 2017. CA Cancer J Clin 2017;67:7-30.
26. Network NCCN. NCCN Clinical practice guidelines in oncol- ogy: genetic/familial high-risk assessment: breast and ovarian and pancreatic. Version 3. Plymonth Meeting (PA): National Comprehensive Cancer Network; 2019.