http://dx.doi.org/10.5534/wjmh.2012.30.3.183
Original Article
Received: Nov 3, 2012; Revised: Nov 24, 2012; Accepted: Nov 26, 2012 Correspondence to: Jun Ho Lee
Department of Urology, National Police Hospital, 123, Songi-ro, Songpa-gu, Seoul 138-708, Korea.
Tel: +82-2-3410-1266, Fax: +82-2-3410-1277, E-mail: [email protected] Copyright © 2012 Korean Society for Sexual Medicine and Andrology
This is an Open Access article distributed under the terms of the Creative Commons Attribution Non-Commercial License (http://creativecommons.
org/licenses/by-nc/3.0) which permits unrestricted non-commercial use, distribution, and reproduction in any medium, provided the original work is properly cited.
Relationship between Lower Urinary Tract Symptoms/Benign Prostatic Hyperplasia and Metabolic Syndrome in Korean Men
Yeon Won Park, Seung Ki Min, Jun Ho Lee
Department of Urology, National Police Hospital, Seoul, Korea
Purpose: To investigate any associations between lower urinary tract symptoms (LUTS)/benign prostate hyperplasia (BPH) and metabolic syndrome (MetS).
Materials and Methods: In all, 1,224 male police officers in their 50s who had participated in health examinations were included.
LUTS/BPH was assessed by serum prostate-specific antigen, International Prostate Symptom Score (IPSS), transrectal ultrasonography, maximum urinary flow rate (Q max), and postvoid residual urine volume (PVR). In addition, testosterone was also examined. The MetS was defined using NCEP-ATP III guidelines. We used the multiple linear regression test and logistic regression analyses to examine the relationships.
Results: MetS was diagnosed in 29.0% of participants. There was no significant difference in the percentage of cases of BPH (IPSS
>7, Q max <15 ml/sec, and prostate gland volume ≥ 20 ml) (14.2% in the non-MetS group vs. 17.2 in the MetS group; p value=
0.178). The total IPSS score and the Q max were not significantly different. The prostate volume and PVR were significantly greater in the subjects with MetS. After adjusting for age and testosterone, the presence of MetS was not associated with BPH (multivariate odds ratio, 1.122; 95% confidence interval, 0.593∼2.120). Additionally, MetS was not related to IPSS (Beta, −0.189;
p value=0.819), prostate volume (Beta, 0.815; p value=0.285), Q max (Beta, −0.827; p value=0.393), or PVR (Beta, 0.506;
p value=0.837).
Conclusions: According to our results, the MetS was not clearly correlated with LUTS/BPH in Korean men in their 50s.
Key Words: Benign prostatic hyperplasia, Metabolic syndrome, Lower urinary tract symptoms
INTRODUCTION
Benign prostatic hyperplasia (BPH) is a highly prevalent disease of older men caused by nonmalignant, un- regulated growth of the prostate gland,1 and it is a major cause of lower urinary tract symptoms (LUTS).
Despite an extensive research effort, the underlying aetiol- ogy of BPH/LUTS has still not been established. Recently, metabolic syndrome (MetS) has been thought to play an important role in the aetiologies of LUTS/BPH. In contrast with results from the United States and from European countries, no results from Asian populations have shown
a positive association between MetS and LUTS/BPH.2 However, studies from Asia have had the following limi- tations: First, a limited number of men aged 50 years old and older, usually the clinically important age for develop- ing LUTS/BPH, have been enrolled. Gao et al3 collected data from 3,103 men, but the median age for their study population was in the 30s. Additionally, other studies from South Korea and Japan have enrolled fewer than 600 men (>50 years old).4-6 Second, most of these studies have used only self-reporting of the International Prostate Symptom Score (IPSS) questionnaire in evaluating LUTS/BPH.3-5 This practise introduces a potential for re- sponse bias, as the respondents might inaccurately report their urinary symptoms. Additionally, some patients might not fully understand the meanings of the questions posed.
Third, serum testosterone levels were not evaluated in any of the data from Asian populations.3-6 This omission might be a limitation, considering that many studies have estab- lished the potential relationship between testosterone lev- els and MetS, and recent studies have indicated inverse as- sociations between testosterone and LUTS.7
To control for these factors in the present study, we ad- ministered the IPSS questionnaire, transrectal ultrasonog- raphy, and uroflowmetry, and we tested for residual urine volume and serum testosterone, coupled with a full meta- bolic work-up, in a large middle-aged population (1,224 men in their 50s). Using the data collected, we then inves- tigated the relationship between MetS and LUTS/BPH.
MATERIALS AND METHODS
1. Study subjects
The institutional review board of the National Police Hospital approved this study in May 2011. From August 2011 to December 2011, 1,224 male police officers in their 50s who had participated in health examinations for their prostates at the National Police Hospital were included. This study excluded patients who had been di- agnosed with urologic disease, including BPH, urologic malignancies, and neurogenic bladder, or who had been administered a related drug, including alpha blockers, an- ticholinergics, 5-alpha reductase inhibitors, and phospho- diesterase-5 inhibitors. All of the patients provided written informed consent.
2. LUTS/BPH assessment
Medical histories were collected using a standardised structural questionnaire. The Korean version of the IPSS was administered to the respondents to evaluate urinary symptoms. The prostate volume was calculated using transrectal ultrasonography (UltraView 800; BK Medical, Herlev, Denmark), and the glands were examined by digi- tal rectal examination. The maximum flow rate (URODYNⓇ; Medtronic Inc., Minneapolis, MN, USA) and postvoid re- sidual urine volume (UltraView 800) were also assessed.
Serum prostate-specific antigen (PSA) levels and serum to- tal testosterone were measured in the morning (between 7:00 and 9:00 AM) after an overnight fast, and these levels were determined using radioimmunoassay.
3. MetS assessment
Two blood pressure (mmHg) measurements were ob- tained 5 minutes apart with a mercury sphygmoman- ometer under the right arm, and the measurements were averaged. Waist circumference (cm) was measured mid- way between the lowest rib and the ilium to the nearest 0.1 cm. Body weight (kg) and body height (cm) were also measured. Blood samples were obtained with the subject in the fasting state at the same time as PSA and testo- sterone. The biochemical analyses included serum glu- cose, total cholesterol, triglycerides, low-density lip- oprotein cholesterol, and high-density lipoprotein choles- terol (HDL-C). The other laboratory tests performed in- cluded a complete blood cell count, routine clinical chemistry (i.e., liver function tests, electrolyte battery, blood urea nitrogen, creatinine), and urinalysis. The diag- nostic criteria for MetS had to satisfy three or more of the NCEP-ATP III criteria,8 as follows: 1) blood pressure
≥130/85 mmHg and/or antihypertensive medication; 2) fasting blood sugar ≥110 mg/dl and/or antidiabetic medi- cation; 3) waist circumference ≥90 cm; 4) HDL-C <40 mg/dl and/or antihypercholesterolaemic medication; and 5) triglycerides ≥150 mg/dl and/or antihypercholeste- rolaemic medication.
4. Statistical analysis
The 1,224 men were classified into two groups accord- ing to the presence of MetS. We compared the two groups’
Table 1. Patient characteristics
Variable All men Non-MetS MetS p value*
Men Age (yr) Height (cm) Body weight (kg) BMI (kg/m2) Waist Cir. (cm) SBP (mmHg) DBP (mmHg) TG (mg/dl) HDL-C (mg/dl) FBS (mg/dl) Testosterone (ng/ml)
1,224 (100.0) 54.0 (52.0∼56.0) 172.0 (170.0∼175.0)
73.0 (69.0∼79.0) 24.7 (23.2∼26.4) 86.0 (84.0∼90.0) 131.0 (123.0∼140.0)
83.0 (77.0∼90.0) 121.0 (85.0∼176.0)
48.0 (41.0∼55.0) 102.0 (96.0∼111.0)
5.1 (4.1∼6.2)
869 (71.0) 54.0 (52.0∼56.0) 172.0 (169.0∼175.0)
72.0 (67.0∼76.0) 24.2 (22.9∼25.6) 85.0 (82.0∼88.5) 130.0 (120.0∼140.0)
82.0 (76.0∼88.0) 104.0 (77.0∼140.0)
50.0 (45.0∼57.0) 100.0 (94.0∼107.0)
5.3 (4.3∼6.4)
355 (29.0) 54.0 (52.0∼56.0) 172.0 (170.0∼175.0)
78.0 (74.0∼83.0) 26.4 (24.2∼27.7) 91.0 (86.0∼91.0 137.0 (130.0∼144.0)
86.0 (80.0∼91.0) 186.5 (152.0∼262.0)
40.0 (37.0∼48.0) 110.0 (100.0∼122.0)
4.7 (3.9∼5.7)
- 0.230 0.138
<0.001
<0.001
<0.001
<0.001
<0.001
<0.001
<0.001
<0.001
<0.001 Values are presented as number (%) or median (interquartile range).
MetS: metabolic syndrome group, BMI: body mass index, Waist Cir.: waist circumference, SBP: systolic blood pressure, DBP:
diastolic blood pressure, TG: triglycerides, HDL-C: high-density lipoprotein cholesterol, FBS: fasting blood sugar.
*Mann-Whitney test.
IPSS total score, IPSS quality of life (QoL) score, maximum flow rate, postvoid residual urine volume, prostate vol- ume, and serum PSA. The proportions of severity of LUTS according to IPSS total score (moderate: IPSS >7; severe:
IPSS >19), maximal flow rate <15 ml/s, prostate size
≥20 ml, and an obstructed flow pattern diagnosed by Siroky nomogram,9 were also examined in the two groups. Finally, the association of MetS with BPH10,11 (IPSS
>7, maximal flow rate <15 ml/s, prostate gland volume
≥20 ml), prostate gland volume, IPSS, maximal flow rate, or postvoid residual urine volume was evaluated after ad- justing for age and serum testosterone level.
Because of the markedly skewed distribution of IPSS scores and demographic characteristics, medians and inter- quartile ranges were adopted. Statistical analyses were per- formed with the Mann-Whitney test, χ2 tests, multiple line- ar regression test, and logistic regression analyses, using the SPSS program, version 11.0 (SPSS Inc., Chicago, IL, USA).
p<0.05 was considered statistically significant.
RESULTS
1. Patient characteristics
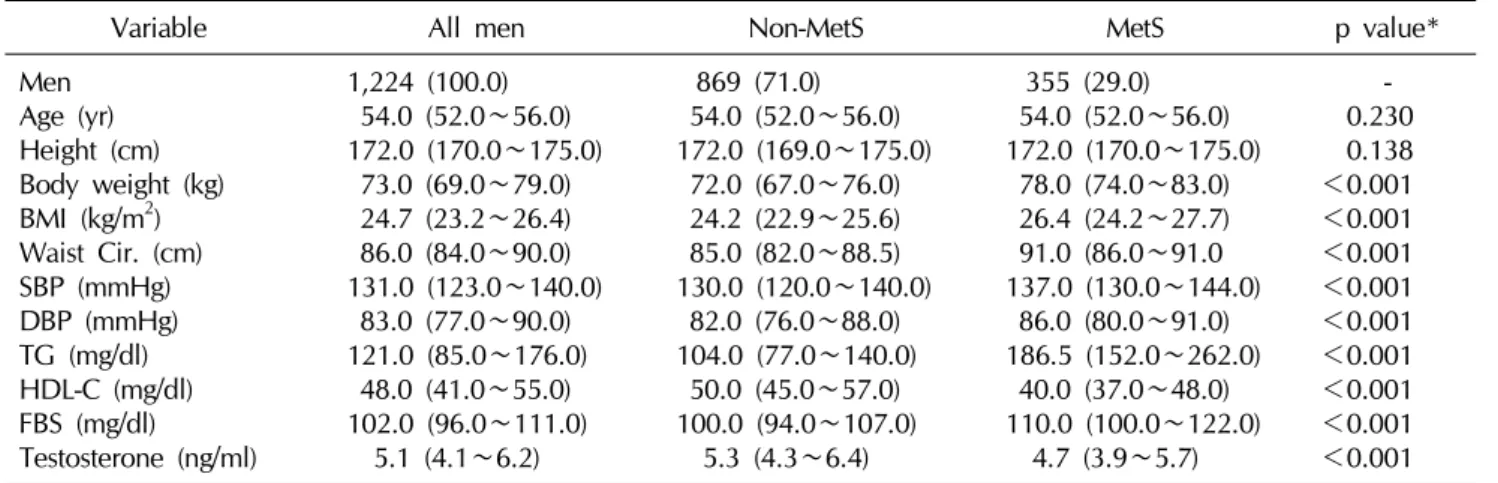
The characteristics of this study population are shown in Table 1. Of a total of 1,224 men, 355 (29.0%) had MetS.
There were no differences in age or height. However, body weight, body mass index, waist circumference, sys-
tolic blood pressure, diastolic blood pressure, trigly- cerides, and fasting blood sugar were significantly higher in the subjects with MetS. Additionally, HDL-C was sig- nificantly lower in the MetS group, and there was a sig- nificant difference in median serum testosterone (5.3 ng/ml in the non-MetS group vs. 4.7 ng/ml in the MetS group; p value <0.001).
2. Comparison of LUTS/BPH between the MetS and non-MetS groups
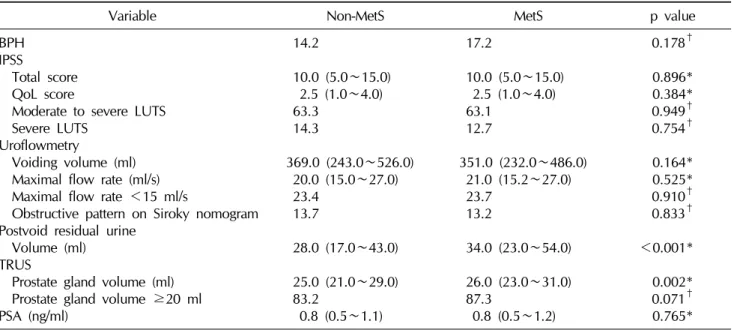
As shown in Table 2, there was no significant difference in the percentage of cases of BPH (14.2% in the non-MetS group vs. 17.2 in the MetS group; p value=0.178). In terms of LUTS, the total IPSS score and QoL score were not significantly different between the two groups. Additionally, the percentages of subjects with moderate to severe LUTS and severe LUTS did not show any differences. There was no significant difference in the percentage of cases of max- imal flow rate less than 15 ml/s and obstructive patterns on Siroky nomography. Prostate volume and postvoid re- sidual urine volume were significantly greater in the sub- jects with MetS. However, the prostate gland volume (>20 ml) did not show significant differences. The PSA levels were not significantly different between the two groups.
3. Correlation between MetS and LUTS/BPH After adjusting for age and testosterone, there was no
Table 2. Comparison of lower urinary tract symptoms/benign prostate hyperplasia between metabolic syndrome and non-metabolic syndrome groups
Variable Non-MetS MetS p value
BPH IPSS
Total score QoL score
Moderate to severe LUTS Severe LUTS
Uroflowmetry
Voiding volume (ml) Maximal flow rate (ml/s) Maximal flow rate <15 ml/s
Obstructive pattern on Siroky nomogram Postvoid residual urine
Volume (ml) TRUS
Prostate gland volume (ml) Prostate gland volume ≥20 ml PSA (ng/ml)
14.2
10.0 (5.0∼15.0) 2.5 (1.0∼4.0)
63.3 14.3
369.0 (243.0∼526.0) 20.0 (15.0∼27.0) 23.4
13.7
28.0 (17.0∼43.0) 25.0 (21.0∼29.0) 83.2
0.8 (0.5∼1.1)
17.2
10.0 (5.0∼15.0) 2.5 (1.0∼4.0) 63.1
12.7
351.0 (232.0∼486.0) 21.0 (15.2∼27.0) 23.7
13.2
34.0 (23.0∼54.0) 26.0 (23.0∼31.0) 87.3
0.8 (0.5∼1.2)
0.178† 0.896*
0.384*
0.949† 0.754† 0.164*
0.525*
0.910† 0.833†
<0.001*
0.002*
0.071† 0.765*
Values are presented as percentage or median (interquartile range).
MetS: metabolic syndrome group, BPH: benign prostatic hyperplasia (IPSS >7, maximal flow rate <15 ml/s, and prostate gland volume ≥20 ml), IPSS: International Prostate Symptom Score, QoL: quality of life, LUTS: lower urinary tract symptoms (Moderate to severe LUTS: IPSS >7, Severe LUTS: IPSS >19), TRUS: transrectal ultrasound, PSA: prostate-specific antigen.
*Mann-Whitney test, †χ2 tests.
Table 3. Correlation of BPH with metabolic syndrome and components of metabolic syndrome Variable Age and testosterone
adjusted OR 95% CI p value*
Waist Cir. (≥90 cm) HTN
TG (≥150 mg/dl) HDL-C (<40 mg/dl) FBS (≥110 mg/dl) MetS
1.526 1.450 0.757 1.295 0.878 1.122
0.935∼2.491 0.972∼2.163 0.495∼1.160 0.828∼2.025 0.585∼1.318 0.593∼2.120
0.091 0.068 0.201 0.258 0.530 0.724
BPH: benign prostatic hyperplasia (IPSS >7, maximal flow rate <15 ml/s, and prostate gland volume ≥20 ml), OR: odds ratio, CI: confidence interval, Waist Cir.: waist circumference, HTN: hypertension, TG: triglycerides, HDL-C: high-density lipoprotein cholesterol, FBS: fasting blood sugar, MetS: metabolic syndrome.
*Logistic regression analysis.
association between MetS and BPH (odds ratio [OR]=
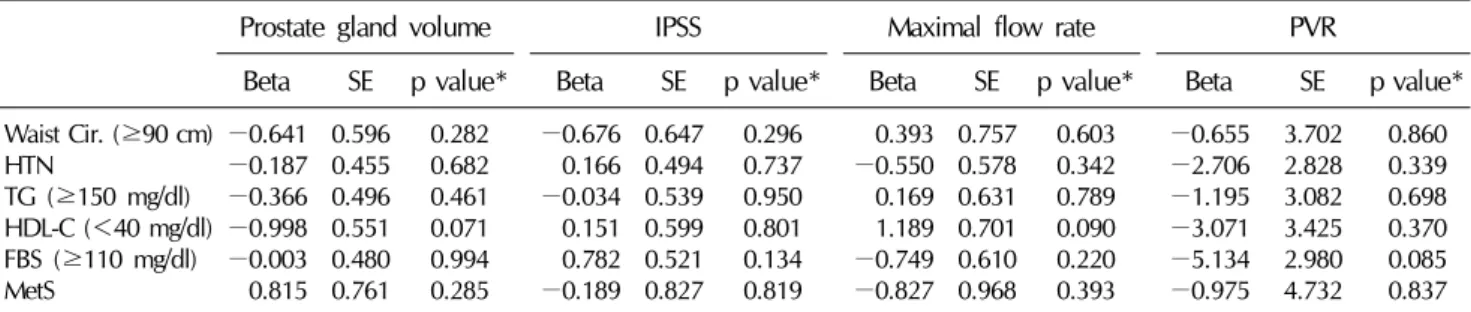
1.122, 95% confidence interval [CI]=0.593∼2.120; p value=0.724) (Table 3). Also, components of MetS were not significantly related to BPH. Additionally, MetS and its components were not correlated with prostate gland vol- ume, IPSS total score, maximal flow rate, or postvoid re- sidual urine volume after adjusting for age and testoster- one using a multiple linear regression test (Table 4).
DISCUSSION
To our knowledge, these are the first data assessing LUTS/BPH using uroflowmetry among studies evaluating the associations between BPH/LUTS and MetS. Most stud- ies have assessed LUTS/BPH using the IPSS only or in com- bination with transrectal ultrasound. There are no data concerning uroflowmetry or postvoid residual urine volume. Our results indicate that MetS is not clearly asso-
Table 4. Correlation between prostate gland volume, IPSS, maximal flow rate, or postvoid residual urine volume and components of metabolic syndrome, or metabolic syndrome
Prostate gland volume IPSS Maximal flow rate PVR
Beta SE p value* Beta SE p value* Beta SE p value* Beta SE p value*
Waist Cir. (≥90 cm) HTNTG (≥150 mg/dl) HDL-C (<40 mg/dl) FBS (≥110 mg/dl) MetS
−0.641
−0.187
−0.366
−0.998
−0.003 0.815
0.596 0.455 0.496 0.551 0.480 0.761
0.282 0.682 0.461 0.071 0.994 0.285
−0.676 0.166
−0.034 0.151 0.782
−0.189 0.647 0.494 0.539 0.599 0.521 0.827
0.296 0.737 0.950 0.801 0.134 0.819
0.393
−0.550 0.169 1.189
−0.749
−0.827 0.757 0.578 0.631 0.701 0.610 0.968
0.603 0.342 0.789 0.090 0.220 0.393
−0.655
−2.706
−1.195
−3.071
−5.134
−0.975 3.702 2.828 3.082 3.425 2.980 4.732
0.860 0.339 0.698 0.370 0.085 0.837 IPSS: International Prostate Symptom Score, PVR: postvoid residual urine volume, SE: standard error, Waist Cir.: waist circumference, HTN: hypertension, TG: triglycerides, HDL-C: high-density lipoprotein cholesterol, FBS: fasting blood sugar, MetS: metabolic syndrome.
*Multiple linear regression test: adjusted for age and testosterone.
ciated with BPH/LUTS in Korean men in their 50s.
We defined BPH as an IPSS >7, maximal flow rate
<15 ml/s, and prostate gland volume ≥20 ml. This defi- nition is open to dispute. However, this definition has been widely used in investigating the prevalence of BPH.10,11 According to this definition, the rate of BPH was 14.2% in subjects without MetS and 17.2% in subject with MetS. There was no significant difference between the two groups. In addition, LUTS severity, depending on the IPSS questionnaire, was no different between the two groups, nor was the IPSS total score or QoL score. Additionally, the IPSS subscore (obstructive symptoms and irritative symptoms) was not significantly different (data not shown). After adjusting for age and testosterone, MetS was not associated with BPH, IPSS total score, prostate gland volume, maximal flow rate or postvoid residual urine volume. The prostate volume and postvoid residual vol- ume were significantly greater in subjects with MetS.
Nevertheless, the differences (1 ml in prostate size and 6 ml in postvoid residual urine volume) were too small to ac- cept them as clinically significant differences.
In a recent review article,2 results from an Asian pop- ulation did not consistently show a positive association between MetS and LUTS/BPH. The results of the present study correspond with the results of earlier studies. In data from China3 collected from 3,103 men with a median age of 35 years, MetS was not associated with the severity of LUTS according to IPSS (multivariate OR=0.97, 95%
CI=0.67∼1.39) after adjusting for age, smoking status, and alcohol consumption. Data from 900 men in Japan,
with a mean age of 56.7 years in the non-MetS group and 56.4 years in the MetS group who underwent digital rectal examinations of the prostate and who completed the IPSS, did not show a clear association between LUTS and MetS.
Data from 538 men in South Korea with a mean age of 48.8 years did not show differences in scores on the IPSS or on an overactive bladder questionnaire short form.4 In another Korean study of 348 men assessing IPSS and trans- rectal ultrasonography, no significant differences were found in the mean IPSS score (11.1 in MetS vs. 12.3 in non-MetS) or prostate volume (20.7 ml in MetS vs. 19.4 in non-MetS).6 However, these studies had clear limitations, as discussed in introduction. We tried to compensate for the weaknesses of the former studies. Our data are from the largest study sample of men in their 50s to date.
Furthermore, we evaluated the prevalence of BPH syn- thetically, depending on uroflowmetry, transrectal ultra- sonography, and IPSS, and we also evaluated associations between BPH/LUTS and MetS after adjusting for con- founding factors, including testosterone. In addition, we evaluated single occupational clusters, with the result that both subjects in the MetS and non-MetS groups had sim- ilar socioeconomic backgrounds. However, there was no clear association between LUTS/BPH and MetS.
We speculate that there were several reasons that a pos- itive association between MetS and LUTS/BPH was not found in the present study or formerly among Asian data, unlike non-Asian data.
The reason for this difference might be population characteristics. We collected data from policemen through
prostate health examinations. In general, policemen ex- ercise more regularly than the general population. A re- cent meta-analysis showed that moderate to heavy phys- ical activity was associated with a decreased risk of BPH/LUTS. The OR for moderate activity was 0.74 (moderate activity: 95% CI=0.60∼0.92, p=0.005) and for heavy activity was 0.74 (95% CI=0.59∼0.92, p=0.006).12 We speculate that the protective effect of physical activity could counterbalance the negative ef- fects of MetS for BPH/LUTS.
A second explanation for our findings is eating habits.
In general, Asians eat vegetables frequently compared to people in Western countries. Such eating habits would re- duce the effects of MetS on LUTS/BPH. A cross-sectional study including 2,397 men older than 60 years of age showed that men in the top four quintiles for vitamin E, ly- copene, and selenium had a non-statistically significant 25% to 50% reduced odds of LUTS, compared with men in the bottom quintile. Similarly, a case-control study in- cluding 1,369 cases and 1,451 controls reported that the risk of BPH significantly decreased with increasing intake of carotene (OR=0.80), alpha-carotene (OR=0.83), be- ta-carotene (OR=0.82), and cis-beta-carotene (OR=0.82).13 Several limitations of the present study warrant mentio- ning. First, the cross-sectional nature of the data set ren- dered causal inferences problematic. Additionally, be- cause this study was performed at a single institution and was conducted in a single occupational cluster, there might be a potential for selection bias. However, despite these limitations, we believe that the results of this study are highly relevant because it is the first study to use uro- flowmetry, transrectal ultrasound, and IPSS simulta- neously, and because it is the largest study to date recruit- ing men in their 50s among studies evaluating BPH/LUTS and MetS.
CONCLUSIONS
In conclusion, the present results have shown that LUTS/BPH is not clearly associated with MetS in Korean men in their 50s. Future investigations should explore the temporal relationship between MetS and LUTS in Asian men. The confirmation of these associations in a pro- spective, longitudinal data set would be informative.
REFERENCES
1. Berry SJ, Coffey DS, Walsh PC, Ewing LL. The development of human benign prostatic hyperplasia with age. J Urol 1984;132:474-9
2. De Nunzio C, Aronson W, Freedland SJ, Giovannucci E, Parsons JK. The correlation between metabolic syndrome and prostatic diseases. Eur Urol 2012;61:560-70
3. Gao Y, Wang M, Zhang H, Tan A, Yang X, Qin X, et al. Are metabolic syndrome and its components associated with lower urinary tract symptoms? Results from a Chinese male population survey. Urology 2012;79:194-201
4. Hong GS, Shim BS, Chung WS, Yoon H. Correlation be- tween metabolic syndrome and lower urinary tract symp- toms of males and females in the aspect of gender-specific medicine: a single institutional study. Korean J Urol 2010;
51:631-5
5. Ohgaki K, Hikima N, Horiuchi K, Kondo Y. Association be- tween metabolic syndrome and male lower urinary tract symptoms in Japanese subjects using three sets of criteria for metabolic syndrome and International Prostate Symptom Score. Urology 2011;77:1432-8
6. Park HK, Lee HW, Lee KS, Byun SS, Jeong SJ, Hong SK, et al; Korean Longitudinal Study on Health and Aging. Rela- tionship between lower urinary tract symptoms and meta- bolic syndrome in a community-based elderly population.
Urology 2008;72:556-60
7. Shigehara K, Namiki M. Late-onset hypogonadism syn- drome and lower urinary tract symptoms. Korean J Urol 2011;52:657-63
8. Grundy SM, Cleeman JI, Daniels SR, Donato KA, Eckel RH, Franklin BA, et al; American Heart Association; National Heart, Lung, and Blood Institute. Diagnosis and manage- ment of the metabolic syndrome: an American Heart Asso- ciation/National Heart, Lung, and Blood Institute Scientific Statement. Circulation 2005;112:2735-52
9. Siroky MB, Olsson CA, Krane RJ. The flow rate nomogram:
I. Development. J Urol 1979;122:665-8
10. Garraway WM, Collins GN, Lee RJ. High prevalence of be- nign prostatic hypertrophy in the community. Lancet 1991;
338:469-71
11. Chute CG, Panser LA, Girman CJ, Oesterling JE, Guess HA, Jacobsen SJ, et al. The prevalence of prostatism: a pop- ulation-based survey of urinary symptoms. J Urol 1993;150:
85-9
12. Parsons JK, Kashefi C. Physical activity, benign prostatic hy- perplasia, and lower urinary tract symptoms. Eur Urol 2008;
53:1228-35
13. Kristal AR, Arnold KB, Schenk JM, Neuhouser ML, Goodman P, Penson DF, et al. Dietary patterns, supplement use, and the risk of symptomatic benign prostatic hyperplasia: results from the prostate cancer prevention trial. Am J Epidemiol 2008;167:925-34