Printed in the Republic of Korea
알약에서의 Levofloxacin와 Ambroxol의 검출을 위한 동시 UV 분광법의 개발 및 검정
Tabassum Patil and Yogesh Pore*
Department of Pharmaceutical Chemistry, Government College of Pharmacy, Karad, Maharashtra, 415 124, India (2008. 2. 12 접수)
Development and Validation of Simultaneous UV Spectrophotometric Method for the Determination of Levofloxacin and Ambroxol in Tablets
Tabassum Patil and Yogesh Pore*
Department of Pharmaceutical Chemistry, Government College of Pharmacy, Karad, Maharashtra, 415 124, India (Received February 12, 2008)
요 약. 알약형태에 포함되어 있는 levofloxacin (LFX)과 ambroxol (ABX) 을 동시분석하기 위하여 정확하고, 정
밀한 UV 분광법을 개발하였다. 이 방 법은 용매로서 증류수를 사용하여 219 (등흡광점)와 287 nm에서 Q-흡수 방정식 의 형성을 포함하고 있다. Levofloxacin과 ambroxol에 대한 직선성은 각각 2-20 µg/ml와5-50 µg/ml 범위 이다. 회 수율은 알약에서 levofloxacin와 ambroxol 각각에 대하여 100-101%와 99-102% 였다. 이 결과는 알약에서 알약에서
levofloxacin와 ambroxol를 정확하고 정밀하게 동시에 평가할 수 있음을 알 수 있다.
주제어: Levofloxacin Hemihydrate, Ambroxol Hydrochloride, UV 분광법, Q 분석, 투여량 형태
ABSTRACT. An accurate, specific and precise UV spectrophotometric method was developed for the simultaneous determination of levofloxacin (LFX) and ambroxol (ABX) in pharmaceutical dosage forms. The method involves for- mation of Q-absorbance equation at 219 (isoabsorptive point) and at 287 nm, using distilled water as a solvent. The lin- earity for both levofloxacin and ambroxol was in the range of 2-20 µg/ml and 5-50 µg/ml respectively. The % recovery was found to be 100-101% and 99-102% for levofloxacin and ambroxol respectively indicating proposed method is accu- rate and precise for simultaneous estimation of levofloxacin and ambroxol in tablets.
Keywords: Levofloxacin Hemihydrate, Ambroxol Hydrochloride, UV Spectrophometry, Q analysis, Dosage Form
INTRODUCTION
Levofloxacin hemihydrate (LFX) (Fig. 1A) chem- ically, [(-)(s)-9-fluro-2,3-dihydro-3-methyl-10-(4- methyl-1-piperazinyl-7-oxo-7H-pyrido[1,2,3-de]- 1,4-benzoxazine-6-carboxylic acid is an optically L-isomer of ofloxacin.1 It is a broad spectrum fluo- roquinolone class of antibacterial agent and effec- tive against many gram positive and gram negative bacteria.2,3 It is a potent inhibitor of bacterial DNA gyrase enzyme (topoisomerase II & IV), which is
necessary for negative supercoiling of DNA prior to replication.4
Ambroxol hydrochloride (ABX) (Fig. 1B) chem- ically, 4-[(2-amino-3,5-dibromophenyl)-methyl]- amino] cyclohexanol hydrochloride is a mucolytic expectorant and used to reduce the viscosity of mucous secretions.5
A fixed dose combination of levofloxacin hemi- hydrate (LFX) and ambroxol hydrochloride (ABX) is available for the treatment of upper and lower respiratory tract infections.
Literature survey reveals that several methods have been developed for the quantitative determina- tion of LFX in formulations as well as in plasma and urine. These include capillary electrophoresis and UV spectrophotometry,6 HPLC,7-10 simulta- neous HPTLC method with ornidazole11 and flow injection analysis.12
It has been reported that ambroxol hydrochloride has been estimated by capillary electrophoresis,13-15 spectrophotometry,16 gas chromatography,17,18 liquid chromatography with potentiometric estimation,19 MS detection,20 UV detection,21-24 RP HPLC,25,21 Raman spectroscopy,26 liquid chromatography with roxithromycin27 and derivative UV and HPLC.28 Simultaneous reversed phase high performance liq- uid chromatographic method for determination of LFX and ABX in pharmaceutical formulations has been also reported.29
However, most of the analytical methods devel- oped for the quantization of LFX and ABX involve analysis of single component, except HPTLC for LFX and HPLC for ABX, which are simultaneous and quite expensive. To our knowledge, no simulta- neous UV spectrophotometric method is available for quantitative determination of LFX and ABX in pharmaceutical dosage form.
This work was aimed to investigate the utility of UV spectrophotometric method in the simultaneous determination of LFX and ABX in pharmaceutical preparations. The method had sufficiently good accuracy, precision and permitted a simple and cost effective assay for these compounds in mixtures.
RESULTS AND DISCUSSION
Method development
LFX and ABX, both are freely soluble in water, hence double distilled water was chosen as a sol-
vent for their determination in solid dosage forms.
The UV spectra of standard solutions of LFX and ABX (10 μg/mL each) were determined separately in distilled water (Fig. 2A and 2B). The λmax of LFX was found to be 287 nm whereas the λmax of ABX was recorded at 245 nm.
Initially, simultaneous equation method was tried for the determination of drugs in their dosage forms, as ABX showed negligible absorbance at the λmax of LFX. However, LFX showed considerable absor- bance at the λmax of ABX. Therefore, absorbance ratio (Q analysis) method was applied for the anal- ysis of both the drugs in tablets.
The developed method for the simultaneous anal- ysis of LFX and ABX was validated with respect to stability, linearity, sensitivity, precision, accuracy, specificity, robustness and ruggedness.30-33
The stability of both the drugs in distilled water was checked by recording their UV spectra at an appropriate time interval for up to 36 hours. They were compared with freshly prepared solutions and not any difference was found between them. This indicated that both these drugs were highly stable in solution phase. Further, a UV spectrum of standard solution containing LFX and ABX (mixture) was also recorded to check any chemical interaction between these drugs. The λmax of both the drugs in a mixture was found to be similar as compared to individual drugs indicating no chemical interfer- ence with each other (Fig. 2C).
Q analysis method
The ratio of two absorbance determined on the two solutions at two different wavelengths is con- stant. This constant is termed as Q value. The Q value is independent of concentration and thick- ness of solution and therefore is used to access the purity of compounds. The absorbance ratio method is a modification of the simultaneous equation pro- cedure. Graphical absorption ratio method uses the ratio of observed absorbance at two selected wave- lengths, one of which is isoabsorptive point. It depends on property for that substance which obeys Beer’s law at all wavelengths. The ratio of absor- bance at any wavelength is constant value indepen- Fig. 1. (A) Chemical structure of levofloxacin (LFX), (B)
Chemical structure of ambroxol (ABX).
dent of concentration or path length.
For Q analysis method, the overlain spectra of LFX and ABX were recorded in the range of 400 to 200 nm. It showed that (Fig. 2D) the peaks were well resolved, satisfying the criteria for obtaining maximum precision, based on absorbance ratios.34 The criteria being the ratios, (A2/A1)/(ax2/ax1) and (ay2/ay1)/(A2/A1), should lie outside the range 0.1-2.0 for the precise determination of X (LFX) and Y (ABX), respectively. Where A1, A2 represents the absorbance of the mixture at λ1 (wavelength at iso- absorptive point) and λ2 (λmax of LFX), ax1 and ax2 denote absorptivities of X at λ1 and λ2, and ay1 and ay2 denote absorptivities of Y at λ1 and λ2, respec-
tively. In the present work, the above criteria was found to be satisfied for LFX (X) and ABX (Y), where λ1 was 219 nm and λ2 287 nm for Q-absor- bance method.
In the quantitative assay of LFX and ABX in an admixture by absorbance ratio method, absorbances were measured at any two wavelengths, one being iso-absorptive point (λ1) and the other being λmax of one of the component i.e. LFX (λ2). Two equa- tions were constructed as described below (Eq. 1 and Eq. 2), using the relationship ax1=ay1 atλ1 and b
= 1 cm. Equations are
A1 = ax1CX + ax1CY at λ1⇒ ax1=ay1 at λ1 (1) Fig. 2. (A) λmax of levofloxacin (LFX) in distilled water, (B) λmax of ambroxol (ABX) in distilled water, (C) λmax of mixture of levofloxacin + ambroxol in distilled water, (D) Overlain spectra of levofloxacin and ambroxol in distilled water.
and
A2 = ax2CX + ay2CY at λ2 (2) Dividing Eq. 2 by Eq. 1
Dividing each term by CX+CY and let FX = CX / (CX+CY) and FY = CY/(CX + CY) where, FX and FY are the fractions of X and Y respectively in the mixture of LFX and ABX.
But FY = 1− FX
Let
(3)
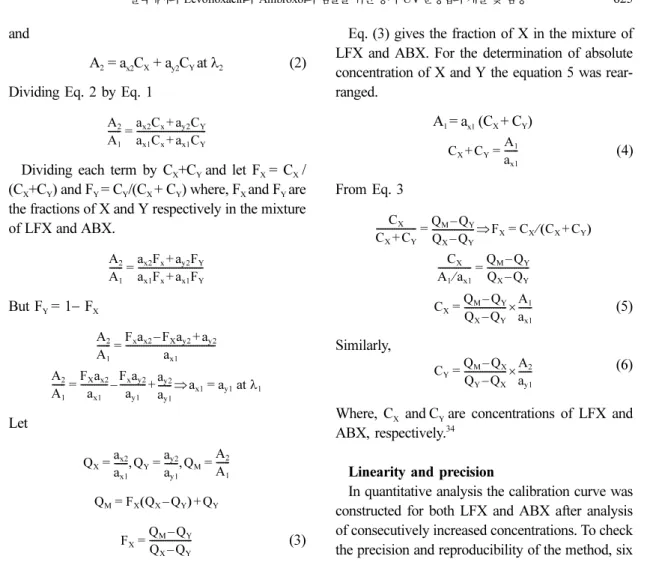
Eq. (3) gives the fraction of X in the mixture of LFX and ABX. For the determination of absolute concentration of X and Y the equation 5 was rear- ranged.
A1 = ax1 (CX + CY)
(4)
From Eq. 3
(5)
Similarly,
(6)
Where, CX andCY are concentrations of LFX and ABX, respectively.34
Linearity and precision
In quantitative analysis the calibration curve was constructed for both LFX and ABX after analysis of consecutively increased concentrations. To check the precision and reproducibility of the method, six A2
A1
--- ax2Cx+ay2CY ax1Cx+ax1CY ---
=
A2 A1
--- ax2Fx+ay2FY ax1Fx+ax1FY ---
=
A2 A1
--- Fxax2–FXay2+ay2 ax1 ---
= A2
A1 --- FXax2
ax1 --- Fxay2
ay1 ---
– ay2
ay1 ---⇒ax1
+ ay1 at λ1
= =
QX ax2 ax1 --- Q, Y ay2
ay1
--- Q, M A2 A1 ---
= = =
QM=FX(QX–QY) Q+ Y
FX QM–QY QX–QY ---
=
CX+CY A1 ax1 ---
=
CX CX+CY
--- QM–QY QX–QY
---⇒FX CX⁄(CX+CY)
= =
CX A1⁄ax1
--- QM–QY QX–QY ---
=
CX QM–QY QX–QY --- A1
ax1 ---
×
=
CY QM–QX QY–QX --- A2
ay1 ---
×
=
Table 1. Validation parameters for standard LFX and ABX.
Parameter LFX ABX
Linearity range (µg/ml) 2-20 5-50
Correlation coefficient (r2) 0.9962a 0.9944a
0.9978b 0.9905b
Intercept -0.0066a 0.08273a
0.0078b 0.002067b
Slope 0.03667a 0.03283a
0.06228b 0.003812b
Regression equation
y = 0.03667x− 0.0066a y = 0.06228x + 0.0078b
y = 0.03283x+ 0.08273a y = 0.002067x + 0.003812b
LOD (µg/ml) 0.1a 0.11a
0.2b 0.02b
LOQ (µg/ml) 0.31a 0.35a
0.38b 3.5b
Precision (% RSD)* 0.83 0.29
LFX: Levofloxacin; ABX: Ambroxol hydrochloride; a: at 219 nm; b: at 287 nm; *Indicates mean of six determinations (n=6).
samples of the same concentration (n=6) of LFX and ABX were prepared and analysed. The low % RSD values obtained for LFX (0.83) and ABX (0.29) indicated that the method had high precision and reproducibility. The regression equation, slope, intercept, correlation coefficient, precision and lin- earity range are given in Table 1.
Analysis in tablet formulations
For the determination of LFX and ABX from pharmaceutical tablet formulations by Q analysis method, the absorbance of sample solutions and absorptivity values at the particular wavelengths were calculated and substituted in the following equation (equations 4 and 5) to obtain the concen- trations of two components.
CLFX=(QM-QY)×A1/(QX-QY)×ax1, CABX=(QM-QX)×
A1/(QY-QX)×ay1 where, CLFX andCABX are concentra- tions of LFX and ABX, respectively, A1 is the absorbance of sample at 219 nm, ax1 is the absorp- tivity of LFX at 219 nm, ax2 is the absorptivity of LFX at 287 nm, ay1 is absorptivity of ABX at 219 nm, ay2 is absorptivity of ABX at 287 nm, QX was
obtained by using the equation, (absorptivity of LFX at 287 nm ax2)/(absorptivity of LFX at 219 nm ax1). Similarly, QY was obtained from (absorptivity of ABX at 287 nm ay2)/(absorptivity of ABX at 219 nm ay1) and QM from, (absorbance of sample at 287 nm A2)/(absorbance of sample at 219 nm A1). The respective absorptivity values for LFX and ABX at λ1 and λ2 are represented in Table 2. The results obtained from analysis of dosage forms are given in Table 4.
Limit of detection (LOD) and limit of quanti- fication (LOQ)
Limit of detection (LOD) and limit of quantifica- tion (LOQ) decide about the sensitivity of the method.
LOD is the lowest detectable concentration of the analyte by the method while LOQ is the minimum quantifiable concentration. LOD and LOQ of LFX and ABX were calculated according to the equa- tions 6 and 7 respectively at both the λmax where, δ is the standard deviation of blank and s is slope of calibration.35
Table 2. Absorptivity values at 219 nm (isoobsorptive wavelength) and 287 nm (λmax of LFX).
Absorptivity at 219 nm* (Mean ± S.D.) Absorptivity at 287nm* (Mean ± S.D.)
LFX ABX LFX ABX
ax1 ay1 ax2 ay2
36.72 ± 0.25 32.79 ± 0.52 62.26 ± 0.34 3.84 ± 0.23
LFX: Levofloxacin; ABX: Ambroxol hydrochloride; * Indicates mean of three experiments; S.D.: Standard deviation.
Table 3. Comparison of linearity, LOD, and LOQ of LFX and ABX with reported HPLC method.29 Compound UV method Reported HPLC method
LOD (µg/ml) LOQ (µg/ml) LOD (µg/ml) LOQ (µg/ml)
LFX 0.1a
0.2 b
0.31a
0.38b 2.1 7.0
ABX 0.11a
0.02b
0.35a
3.5b 0.6 1.0
LFX: Levofloxacin; ABX: Ambroxol hydrochloride; a: at 219 nm; b: at 287 nm.
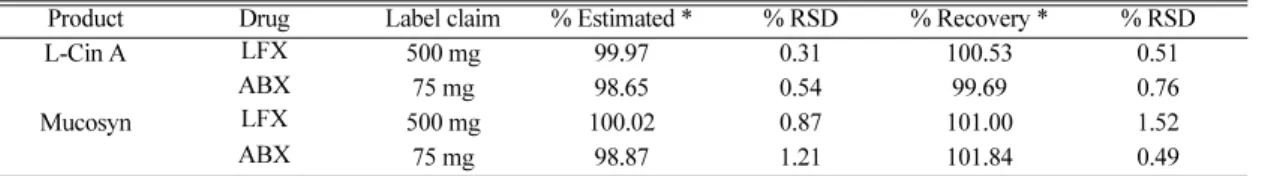
Table 4. Analysis of dosage forms and recovery studies.
Product Drug Label claim % Estimated * % RSD % Recovery * % RSD
L-Cin A LFX 500 mg 99.97 0.31 100.53 0.51
ABX 75 mg 98.65 0.54 99.69 0.76
Mucosyn LFX 500 mg 100.02 0.87 101.00 1.52
ABX 75 mg 98.87 1.21 101.84 0.49
LFX: Levofloxacin; ABX: Ambroxol hydrochloride; * Indicates mean of six determinations (n=6).
LOD = (7)
LOQ = (8)
The limit of detection (LOD) for LFX was 0.1 µg/
ml and 0.2 µg/ml at λmax of 219 nm and λmax of 287 nm respectively while, the limit of quantification (LOQ) was 0.31 µg/ml and 0.38 µg/ml at the respec- tive λmax. For ABX, The LOD was found to be 0.11 µg/ml and 0.02 µg/ml at λmax of 219 nm and λmax of 287 nm respectively while, the LOQ was 0.35 µg/
ml and 3.5 µg/ml at the respective λmax (Table 1).
The linearity, LOD and LOQ values of LFX and ABX obtained from UV method have been com- pared with the reported method.29 The data dis- played in Table 3, indicates high sensitivity of the UV method over reported one.
Reproducibility
The accuracy and specificity of the proposed method was tested by recovery experiments. Recov- ery studies were carried out at 100 % level by add- ing a known quantity of pure drug to the preanalyzed formulation and the proposed method was fol- lowed. From the amount of drug found, percentage recovery was calculated (Table 4). The % recovery for LFX and ABX were found to be in the range of 100.53-101% (% RSD 0.51-1.51) and 99.69- 101.84% (% RSD 0.49-0.76) respectively for both the formulations tested. The high recovery rate with low % RSD values indicated that the method had a good accuracy and specificity, as there was no inter- ference from the excipients present in formulations.
Intra-day precision and accuracy were evaluated by analyzing three samples of two different concen- trations, prepared on same day. Inter-day variabil- ity was assessed by analyzing two concentrations on three different days, over a period of one week.
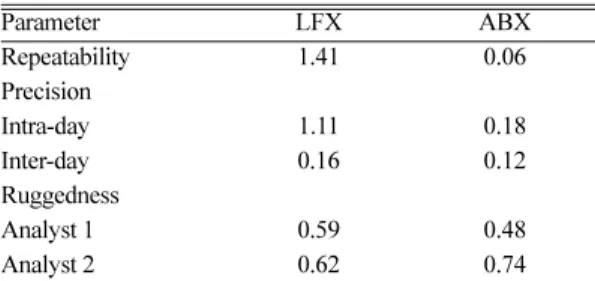
No significant difference was found in these exper- iments, indicating accuracy and reproducibility of the assays. The % RSD values reported in Table 5 shows that proposed method provides acceptable intra-day and inter-day variation of LFX and ABX.
Ruggedness of the proposed methods was deter- mined by analyzing LFX and ABX by different
analysts, using similar operational and environmen- tal conditions; the % RSD values are reported in Table 5 and found to be less than 2 %.
Robustness of the proposed method was checked by minor changes on the selected wavelength. Since the absorbance was not significantly affected, the proposed method could be considered as robust.
EXPERIMENTAL
Instrumentation
A Shimadzu 1700 UV (Shimadzu, Japan) spec- trophotometer with 1 cm matched quartz cells was used for the estimation.
Chemicals and reagents
LFX and ABX were kindly supplied by Cipla Ltd., Mumbai, India, as gift samples. Tablets con- taining LFX and ABX were procured from local pharmacy. All the reagents were of analytical grade.
Double distilled water was used throughout the experiment.
Standard Preparation
Accurately weighed quantities (10 mg each) of LFX and ABX were dissolved separately in suffi- cient quantity of distilled water in a 100 ml volu- metric flask. The solutions were sonicated and the volume was adjusted up to the mark with distilled water to obtain a stock solution of 100 µg/ml; each of LFX and ABX. For the selection of analytical wavelength for the Q absorbance method, the stock solutions of LFX and ABX were separately diluted 3.3σ
---S 10σ ---S
Table 5. % RSD values for repeatability, intra- day, inter-day variation and ruggedness (n=3).
Parameter LFX ABX
Repeatability 1.41 0.06
Precision
Intra-day 1.11 0.18
Inter-day 0.16 0.12
Ruggedness
Analyst 1 0.59 0.48
Analyst 2 0.62 0.74
LFX: Levofloxacin; ABX: Ambroxol hydrochloride; n: No.
of experiments.
in distilled water, to get concentrations of 10 μg/ml each, and scanned in the wavelength range of 200- 400 nm. From the overlain spectra of both drugs, wavelengths 219 nm (isoabsorptive point) and 287 nm (λmax of LFX) were selected for the formation of Q-absorbance equation. For calibration curves, stock solutions of LFX and ABX were appropri- ately diluted to obtain concentration range of 2-20 μg/ml and 5-50 μg/ml respectively. The absorbance of LFX was measured at 287 nm and 219 nm, and calibration curves were plotted. Similarly the absor- bance of ABX was measured at 219 nm and 287 nm, and calibration curves were plotted. The absorptivi- ties (A1%, 1 cm) of each drug at both the wave- lengths were also determined.
Sample preparation
For the estimation of drugs from the commercial formulations, twenty tablets of two brands L-cin A (Lupin Ltd., Mumbai, India) and Mucosyn (Alem- bic Ltd., Vadodara, India) containing 500 mg of LFX and 75 mg of ABX were weighed, and finely powdered. For the analysis of drugs, a standard addition method was used. An accurately weighed 175 mg of pure ABX was added to finely pow- dered samples to bring the concentration of ABX in linearity range. With this addition, the ratio of LFX to ABX in samples was brought to 2:1. Quantity of powder equivalent to 20 mg of LFX and 10 mg of ABX was transferred to 100 ml volumetric flask, dissolved in sufficient quantity of distilled water, sonicated and the volume was adjusted up to the mark with distilled water to obtain a stock solution of 200 µg/ml of LFX and 100 µg/ml of ABX. The solution was then filtered through Whatman filter paper No. 41 and the filtrate was appropriately diluted to obtain final concentrations 10 µg/ml of LFX and 5 µg/ml of ABX. Absorbance of this solu- tion was measured at appropriate wavelengths, and values were substituted in the respective formulae to obtain concentrations.
CONCLUSION
The proposed method was successfully applied to
the simultaneous determination of LFX and ABX from pharmaceutical tablet formulation. The pre- sented method was found to be simple, accurate, precise, rugged and robust. It can be directly and easily applied to the analysis of the combined phar- maceutical tablet formulation of LFX and ABX.
Moreover, the present method is quick and cost- effective as compared to chromatographic tech- niques. Therefore, it can be concluded that the pro- posed method provides an alternative procedure for the quality control of LFX and ABX in pharmaceu- tical formulations.
Acknowledgements. We are grateful to Cipla Ltd., Mumbai, India, for providing gift samples of drug for research work. We are thankful to Principal, Govt. College of Pharmacy, Karad for providing laboratory facilities and constant encouragement.
REFERENCES
1. Sweetman, S. C. Martindale The Complete Drug Ref- erence; 33rd ed., Pharmaceutical Press: London, 2002;
p. 219.
2. Bertino, J.; Fish, D. Clin. Ther. 2000, 22, 798.
3. Lorian, V.; Williams, L. Antibiotics in Laboratory Med- icine; 4th ed., 1996; p. 591.
4. Hardman, J.; Goodman, A. The Pharmacological Basis of Therapeutics; 9th ed., McGraw-Hill: NY, 1996; p.
1065.
5. Budavari, S. The Merck Index; 12th ed., Merck and Co.
Inc.: Whitehouse Station, NJ, 1996; p. 404.
6. Belal, F.; Al-Majed, A.; Al-Obaid, A. M. Talanta.
1999, 50, 765.
7. Ines, M.; Santoro, R. M.; Singh, A. K.; Erika, R. M.;
Hackmam, K. J. Pharm. Biomed. Anal. 2006, 40, 179.
8. Neckle, U.; Joukhadar, C.; Mayer, B. X. Anal. Chim.
Acta. 2002, 463, 199.
9. Wong, F. A.; Juzwin, S. J.; Flor, S. C. J. Pharm.
Biomed. Anal. 1997, 15, 765.
10. Siewert, S. J. Pharm. Biomed. Anal. 2006, 41, 1360.
11. Chepurwar, S. B.; Shirkhedkar, S. B.; Bari, S. B.; Fur- sule, R. A.; Surana, S. J. J. Chromatogr. Sci. 2007, 45, 531.
12. Altiokka, G.; Atkosar, Z.; Can, N. O. J. Pharm. Biomed.
Anal. 2002, 30, 881.
13. Pospíilová, M.; Poláek, M.; Jokl, V.; J. Pharm. Biomed.
Anal. 2001, 24, 421.
14. Perez-Ruiz, T.; Martínez-Lozano, C. C.; Sanz, C.; Bravo, E. J. Chromatogr. B. 2000, 742, 205.
15. Pérez-Ruiz, T.; Martínez-Lozano, C.; Sanz, A.; Bravo, E. J. Chromatogr. B. 1997, 692, 199.
16. Reddy, N. M.; Kanna Rao, K. V.; Swapna, M.; Sarkar, D. G. Indian J. Pharm. Sci. 1998, 60, 249.
17. Colombo, L.; Marcucci, F. M.; Marini, G. M.; Pierfe- derici, P.; Mussini, E. J. Chromatogr. B. 1990, 530, 141.
18. Schmid, J. J. Chromatogr. 1987, 414, 65.
19. Bazylak, G.; Nagels, L. J. J. Pharm. Biomed. Anal.
2003, 32, 887.
20. Kim, H.; Yoo, J. Y.; Han, S. B.; Lee, H. J.; Lee, K. R.
J. Pharm. Biomed. Anal. 2003, 32, 209.
21. Heinänen, M.; Barbas, C. J. Pharm. Biomed. Anal. 2001, 24, 1005.
22. Koundourellis, J. E.; Malliou, E. T.; Broussali, T. A. J.
Pharm. Biomed. Anal. 2000, 23, 469.
23. Nobilis, M.; Pastera, J.; Svoboda, D.; Kvtina, J.; Macek, K. J. Chromatogr. 1992, 581, 251.
24. Brizzi, V.; Pasetti, U. J. Pharm. Biomed. Anal. 1990, 8, 107.
25. Indrayanto, G.; Handayani, R. J. Pharm. Biomed. Anal.
1993, 11, 781.
26. Hwang, M. S.; Cho, S.; Chung, H.; Woo, Y. A. J.
Pharm. Biomed. Anal. 2005, 8, 210.
27. Qi, M.; Wang, P.; Cong R.; Yang, J. J. Pharm. Biomed.
Anal. 2004, 35, 1287.
28. Dinçer, Z.; Basan, H.; Göger, N. G. J. Pharm. Biomed.
Anal. 2003, 5, 867.
29. Kothekar, K. M.; Balasundaram, J.; Khandhar, A. P.;
Mishra, R. K.; Eurasian J. Anal. Chem. 2007, 2, 21.
30. ICH, International Conference on Harmonisation of Technical Requirements for Registration of Pharma- ceuticals for Human Use. ICH Harmonised Tripartite Guideline. 1996.
31. Ermer, J.; Ploss, H. J.; J. Pharm. Biomed. Anal. 2005, 37, 859.
32. Fabre, H.; Altria, K. D. LC-GC. 2001, 14, 302.
33. Braggio, S.; Barnaby, R. J.; Grossi, P.; Cugola, M. A. J.
Pharm. Biomed. Anal. 1996, 14, 375.
34. Beckett, A. H.; Stenlake, J. B. Practical Pharmaceuti- cal Chemistry; 4th ed., Part-II, CBS Publisher: New Delhi, 1997; p. 275.
35. Busaranon, K.; Suntornsuk, W.; Suntornsuk, L. J. Pharm.
Biomed. Anal. 2006, 41, 158.