Cancer Statistics in Korea: Incidence, Mortality and Survival in 2006-2007
Cancer has been the leading cause of death in Korea. Korea is facing a very rapid change and increase in cancer incidence, which draws much attention in public health. This paper overviews the nationwide cancer statistics, including incidence, mortality, and survival rates, and their trends in Korea based on the cancer incidence data from The Korea Central Cancer Registry (KCCR) in year 2006 and 2007. In Korea, there were 153,237 cancer cases and 65,519, cancer deaths observed in 2006, and 161,920 cancer cases and 67,561 cancer deaths in 2007, respectively. The incidence rate for all cancer combined showed an annual increase of 2.8% from 1999 to 2007. Specifically, there was significant increase in the incidence of colorectal, thyroid, female breast, and prostate cancers. The number of cancer deaths has increased over the past two decades, due mostly to population aging, while the age-standardized mortality rates have decreased in both men and women since 2002.
Notable improvement has been observed in the 5-yr relative survival rates for most major cancers and for all cancer combined, with the exception of pancreatic cancer. The
nationwide cancer statistics in this paper will provide essential data for cancer research and evidence-based health policy in Korea.
Key Words: Incidence; Mortality; Survival; Neoplasms; Korea
DOI: 10.3346/jkms.2010.25.8.1113 • J Korean Med Sci 2010; 25: 1113-1121 Oncology & Hematology
INTRODUCTION
Cancer has been the leading cause of death in Korea since 1983 (1) and poses a major public health concern. Over 150,000 new cancer cases are diagnosed annually in Korea and one out of four deaths results from cancer (2, 3). This paper gives an over- view of the nationwide cancer statistics, including the incidence, mortality, and survival rates, and their trends in Korea. This re- port is a part of Special Article series that presents the annually updated nationwide cancer statistics in Korea since 2009 (4).
MATERIALS AND METHODS
Data sourcesThe Korea Ministry of Health and Welfare started a nationwide, hospital-based cancer registry called the Korea Central Cancer Registry (KCCR) in 1980. Details of the history, objectives, and
activities of the KCCR have been documented (5). Incidence data from 1999 to 2007 were obtained from the Korea National Cancer Incidence Database (KNCIDB). Cancer cases were clas- sified according to the International Classification of Diseases
for Oncology 3rd edition (6) and converted to the International Classification of Diseases 10th edition (ICD-10) (7). The survivalanalysis used 1,302,353 cancer cases first diagnosed during 1993-2007 from the KNCIDB, and followed vital status through 31 December 2008.
Mortality data from 1983 to 2007 were obtained from the Ko- rea National Statistics Office (KNSO) (1). Cause of death was coded and classified according to the ICD-10. The population data were also obtained from KNSO using the resident registra- tion population on 1 July each year.
Crude rates (CRs) and age-specific rates of cancer incidence and mortality were calculated. Age-standardized rates (ASRs) were determined using the World Health Organization (WHO)
Kyu-Won Jung1, Sohee Park1,Hyun-Joo Kong1, Young-Joo Won1, You-Kyung Boo2,3, Hai-Rim Shin1,4, Eun-Cheol Park5, and Jin-Soo Lee1 The Korea Central Cancer Registry1, National Cancer Center, Goyang; Korean Medical Record Association2, Seoul; Department of Healthcare Management3, College of Health Industry, Eulji University of Korea, Seongnam, Korea; Data Analysis and Interpretation Group4, Biostatistics and Epidemiology Cluster, International Agency for Research on Cancer, Lyon, France; National Cancer Control Institute5, National Cancer Center, Goyang, Korea
Received: 1 April 2010 Accepted: 3 June 2010 Address for Correspondence:
Sohee Park, Ph.D.
The Korea Central Cancer Registry, National Cancer Center, 323 Ilsan-ro, Ilsandong-gu, Goyang 410-769, Korea Tel: +82.31-920-2015; Fax: +82.31-920-2179 E-mail: [email protected]
This work was supported by a research grant from the National Cancer Center (No. 0710040), and the National Health Promotion Program grant (No. 0960360-1) from the Ministry for Health, Welfare and Family Affairs, Republic of Korea. The authors owed a debt of gratitude to the Korea Central Cancer Registry (KCCR)- affiliated Hospitals, non KCCR-affiliated Hospitals, 7 Regional Cancer Registries (Busan, Daegu & Gyeongbuk, Gwangju &
Jeonnam, Incheon, Daejeon & Chungnam, Ulsan, and Jejudo), the National Health Insurance Corporation, and the National Statistical Office for data collection.
world standard population (8). The cumulative risks of cancer incidence, which are the probability of developing cancer to the life expectancy, were also calculated. Changes in the annual age- standardized cancer incidence rates were examined by calcu- lating the annual percentage change (APC) over a time period as 100(e-1), where e is the slope of the regression of log age-stan- dardized rates on a calendar year (9).
The survival duration of each case was determined as the time difference between the date of initial diagnosis and the date of death, date of loss to follow-up, or closing date for follow-up.
Observed survival rates were calculated using a life table meth- od and relative survival rates were examined with the Ederer II method (10) using an algorithm written in SAS by Paul Dick- man (11), with some minor adaptations.
RESULTS AND DISCUSSION
IncidenceTable 1 presents the number of new cancer cases during 2006- 2007 in Korea by sex and cancer site. 153,237 new cancer cases in 2006, 161,920 new cancer cases in 2007 were observed in Korea.
The cumulative risks for developing a cancer to the life expec-
tancy were 34.6%, 34.4% for men and 27.3%, 28.9% for women during 2006 and 2007, respectively.
Table 2 ranks cancer incidence by sex during 2006-2007. The CRs of all sites combined in 2006 were 334.7 and 292.1 per 100,000 in men and women, respectively, and the ASRs of all sites com- bined were 307.4 and 215.0 per 100,000. The CRs of all sites com- bined in 2007 were 346.2 and 312.8 per 100,000 in men and wom- en, respectively, and the ASRs of all sites combined were 305.9 and 224.9 per 100,000. In males, the five leading primary sites of cancer were the stomach (CR 70.4, ASR 61.2), lung (CR 52.1, ASR 47.5), colon & rectum (CR 49.7, ASR 43.5), liver (CR 45.2, ASR 38.4), and prostate (CR 21.5, ASR 20.0), accounting for 69.0% of all newly diagnosed cancers in 2007. In females, the most com- mon cancer sites were the thyroid (CR 73.5, ASR 55.6), breast (CR 47.4, ASR 34.7), stomach (CR 35.0, ASR 23.9), colon & rec- tum (CR 33.9, ASR 23.4), lung (CR 20.4, ASR 13.3), and liver (CR 15.4, ASR 10.7), accounting for 72.1% of all newly diagnosed can- cers. Thyroid cancer alone accounts for 23.5% (18,019) of inci- dent cases in women in 2007.
From the construction of a KNCIDB for 1999 onward to 2007, the completeness of the Korea Cancer Registry data has improv- ed gradually. This might have contributed in part to the gradual
Table 1. Number of cancer cases and deaths by sex during 2006-2007 in KoreaSite
2006 2007
New cases Deaths New cases Deaths
Both
sexes Males Females Both
sexes Males Females Both
sexes Males Females Both
sexes Males Females
All sites 153,237 82,027 71,210 65,519 41,841 23,678 161,920 85,257 76,663 67,561 42,778 24,783
Lip, oral cavity, & pharynx 2,263 1,671 592 892 695 197 2,312 1,712 600 949 746 203 Esophagus 2,036 1,869 167 1,476 1,351 125 2,035 1,840 195 1,449 1,320 129 Stomach 26,253 17,633 8,620 10,716 7,051 3,665 25,915 17,337 8,578 10,563 6,875 3,688 Colon & rectum 19,570 11,473 8,097 6,195 3,406 2,789 20,558 12,242 8,316 6,608 3,739 2,869 Liver 14,877 11,147 3,730 10,884 8,240 2,644 14,924 11,141 3,783 11,144 8,389 2,755 Gallbladder* 4,057 2,077 1,980 3,385 1,712 1,673 4,149 2,066 2,083 3,408 1,662 1,746 Pancreas 3,771 2,078 1,693 3,445 1,890 1,555 3,937 2,197 1,740 3,569 1,917 1,652 Larynx 1,054 978 76 522 468 54 1,072 1,009 63 490 441 49
Lung 17,578 12,612 4,966 14,027 10,447 3,580 17,846 12,841 5,005 14,278 10,545 3,733
Breast 10,805 52 10,753 1,615 17 1,598 11,639 33 11,606 1,678 8 1,670
Cervix uteri 3,999 - 3,999 1,002 - 1,002 3,616 - 3,616 987 - 987
Corpus uteri 1,280 - 1,280 146 - 146 1,324 - 1,324 165 - 165
Ovary 1,663 - 1,663 712 - 712 1,838 - 1,838 825 - 825
Prostate 4,425 4,425 - 1,004 1,004 - 5,292 5,292 - 1,107 1,107 -
Testis 182 182 - 14 14 - 175 175 - 22 22 -
Kidney 2,634 1,794 840 673 477 196 2,846 1,967 879 715 474 241 Bladder 3,022 2,451 571 920 699 221 3,097 2,464 633 948 700 248 Brain & CNS 1,542 809 733 1,126 596 530 1,594 845 749 1,157 636 521 Thyroid 16,414 2,383 14,031 334 89 245 21,178 3,159 18,019 380 107 273 Hodgkin’s disease 171 105 66 44 32 12 197 124 73 36 22 14 Non-Hodgkin’s lymphoma 3,194 1,822 1,372 1,222 734 488 3,244 1,875 1,369 1,289 792 497 Multiple myeloma 758 380 378 541 297 244 853 440 413 613 297 316 Leukemia 2,393 1,316 1,077 1,410 842 568 2,375 1,328 1,047 1,447 824 623 Other & ill-defined 9,296 4,770 4,526 3,214 1,780 1,434 9,904 5,170 4,734 3,734 2,155 1,579
*Includes gallbladder and other/unspecified parts of biliary tract.
CNS, central nervous system.
overall increases in cancer incidence, especially among the el- derly.
Mortality
A total of 65,519 cancer deaths were reported in Korea, account- ing for about 27.0% of all deaths in 2006 (Table 3). In 2007, can- cer deaths (67,561 cases) account for 27.6% of all deaths. The CRs of all sites combined in 2006 were 170.7 and 97.1 per 100,000 for men and women, respectively, and the ASRs of all sites com- bined were 161.9 and 65.3 per 100,000. In 2007, the CRs of all sites combined were 173.7 and 101.1 per 100,000 for men and women, respectively, and the ASRs of all sites combined were 158.2 and 65.6 per 100,000. Cancers of the lung, liver, stomach and colon & rectum were the most common fatal cancers, which accounted for about 63% of all cancer deaths in 2007 (Table 4).
In men, the five leading primary cancer sites for mortality of the year of 2007 were the lung (CR 42.8, ASR 39.5), liver (CR 34.1, ASR 29.3), stomach (CR 27.9, ASR 25.3), colon & rectum (CR 15.2, ASR 14.0), and pancreas (CR 7.8, ASR 7.1). In women, lung cancer mortality (CR 15.2, ASR 9.4) has increased gradually, was the first cancer sites for mortality in 2007, following stomach (CR 15.0, ASR 9.3), colon & rectum (CR 11.7, ASR 7.3, liver (CR 11.2,
ASR 7.5), and gallbladder (CR 7.1, ASR 4.3).
Trends in cancer incidence
Table 5-1~5-3 show the trends in cancer incidence for all sites combined and for selected cancer sites. The incidence rate for all sites combined increased by 2.8% annually from 1999 to 2007.
The incidence rate for all sites combined increased by 1.3% an- nually in men and by 4.7% in women from 1999 to 2007.
The incidence rates have continued to increase for colorectal and thyroid cancer in both sexes, along with breast cancer in females and prostate cancer in males. Stomach and lung can- cer incidence rates plateaued in men and women, while the in- cidences of liver cancer in both sexes and the cervical cancer in women have decreased.
One notable aspect is the sharp increase (25.7% annually) in the incidence of female thyroid cancer. As diagnostic techniques for thyroid cancer have become more sensitive, such as the ad- vent of ultrasound and fine-needle aspiration, the detection of subclinical disease has become possible. Therefore, the increas- ed incidence of thyroid cancer might reflect improved diagnos- tic techniques for previously undetected disease, rather than a true increase in the occurrence of thyroid cancer (12, 13).
Table 2. Crude and age-standardized cancer incidence rates by sex during 2006-2007 in Korea
Site
2006 2007
Crude incidence rates per
100,000 Age-standardized incidence
rates per 100,000* Crude incidence rates per
100,000 Age-standardized incidence rates per 100,000*
Both
sexes Males Females Both
sexes Males Females Both
sexes Males Females Both
sexes Males Females
All sites 313.5 334.7 292.1 249.9 307.4 215.0 329.6 346.2 312.8 254.5 305.9 224.9
Lip, oral cavity, & pharynx 4.6 6.8 2.4 3.7 6.1 1.8 4.7 7.0 2.4 3.7 6.0 1.8 Esophagus 4.2 7.6 0.7 3.4 7.2 0.5 4.1 7.5 0.8 3.2 6.7 0.5
Stomach 53.7 72.0 35.4 42.6 64.9 24.9 52.7 70.4 35.0 40.4 61.2 23.9
Colon & rectum 40.0 46.8 33.2 32.0 42.7 23.7 41.8 49.7 33.9 32.3 43.5 23.4
Liver 30.4 45.5 15.3 24.4 39.9 11.0 30.4 45.2 15.4 23.5 38.4 10.7
Gallbladder† 8.3 8.5 8.1 6.5 8.0 5.4 8.4 8.4 8.5 6.4 7.7 5.4 Pancreas 7.7 8.5 6.9 6.1 7.9 4.7 8.0 8.9 7.1 6.1 8.0 4.6 Larynx 2.2 4.0 0.3 1.8 3.7 0.2 2.2 4.1 0.3 1.7 3.6 0.2
Lung 36.0 51.5 20.4 28.4 48.9 13.8 36.3 52.1 20.4 27.5 47.5 13.3
Breast 22.1 0.2 44.1 16.8 0.2 33.0 23.7 0.1 47.4 17.6 0.1 34.7
Cervix uteri 8.2 - 16.4 6.3 - 12.1 7.4 - 14.8 5.5 - 10.7
Corpus uteri 2.6 - 5.3 2.1 - 4.0 2.7 - 5.4 2.1 - 4.0
Ovary 3.4 - 6.8 2.7 - 5.3 3.7 - 7.5 2.9 - 5.7
Prostate 9.1 18.1 - 7.2 17.7 - 10.8 21.5 - 8.3 20.0 -
Testis 0.4 0.7 - 0.4 0.7 - 0.4 0.7 - 0.3 0.7 -
Kidney 5.4 7.3 3.4 4.4 6.4 2.7 5.8 8.0 3.6 4.6 6.8 2.7 Bladder 6.2 10.0 2.3 4.9 9.5 1.6 6.3 10.0 2.6 4.8 9.0 1.6 Brain & CNS 3.2 3.3 3.0 2.9 3.1 2.6 3.2 3.4 3.1 3.0 3.3 2.7
Thyroid 33.6 9.7 57.6 25.9 7.7 44.1 43.1 12.8 73.5 32.8 9.9 55.6
Hodgkin’s disease 0.3 0.4 0.3 0.3 0.4 0.3 0.4 0.5 0.3 0.4 0.5 0.3 Non-Hodgkin’s lymphoma 6.5 7.4 5.6 5.4 6.8 4.3 6.6 7.6 5.6 5.3 6.7 4.2 Multiple myeloma 1.6 1.6 1.6 1.3 1.4 1.1 1.7 1.8 1.7 1.3 1.6 1.2 Leukemia 4.9 5.4 4.4 4.8 5.5 4.3 4.8 5.4 4.3 4.7 5.5 4.0 Other & ill-defined 19.0 19.5 18.6 15.8 18.5 13.7 20.2 21.0 19.3 16.2 19.2 13.9
*Age adjusted to the WHO world standard population; †Includes gallbladder and other/unspecified parts of biliary tract.
CNS, central nervous system.
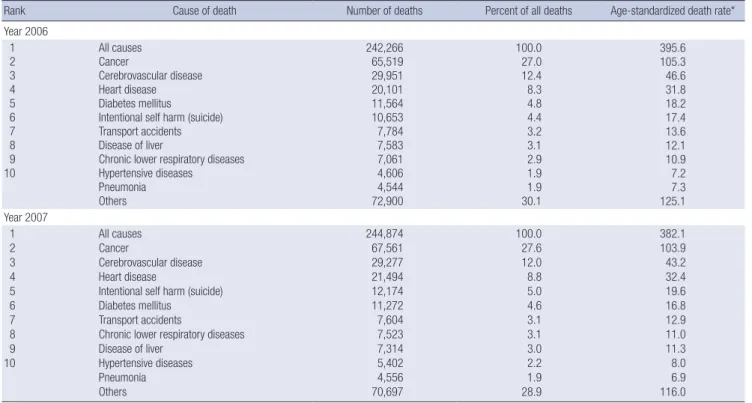
Table 3. Ten leading causes of death during 2006-2007 in Korea
Rank Cause of death Number of deaths Percent of all deaths Age-standardized death rate*
Year 2006 1 2 3 4 5 6 7 8 9 10
All causes Cancer
Cerebrovascular disease Heart disease Diabetes mellitus
Intentional self harm (suicide) Transport accidents Disease of liver
Chronic lower respiratory diseases Hypertensive diseases
Pneumonia Others
242,266 65,519 29,951 20,101 11,564 10,653 7,784 7,583 7,061 4,606 4,544 72,900
100.0 27.0 12.4 8.3 4.8 4.4 3.2 3.1 2.9 1.9 1.9 30.1
395.6 105.3 46.6 31.8 18.2 17.4 13.6 12.1 10.9 7.2 7.3 125.1 Year 2007
1 2 3 4 5 6 7 8 9 10
All causes Cancer
Cerebrovascular disease Heart disease
Intentional self harm (suicide) Diabetes mellitus
Transport accidents
Chronic lower respiratory diseases Disease of liver
Hypertensive diseases Pneumonia Others
244,874 67,561 29,277 21,494 12,174 11,272 7,604 7,523 7,314 5,402 4,556 70,697
100.0 27.6 12.0 8.8 5.0 4.6 3.1 3.1 3.0 2.2 1.9 28.9
382.1 103.9 43.2 32.4 19.6 16.8 12.9 11.0 11.3 8.0 6.9 116.0
*Age adjusted to the WHO world standard population. Source: Mortality Data, Korea National Statistical Office, 2008.
Table 4. Crude and age-standardized cancer mortality rates by sex during 2006-2007 in Korea
Site
2006 2007
Crude mortality rates per
100,000 Age-standardized mortality
rates per 100,000* Crude mortality rates per
100,000 Age-standardized mortality rates per 100,000*
Both
sexes Males Females Both
sexes Males Females Both
sexes Males Females Both
sexes Males Females
All sites 134.0 170.7 97.1 105.3 161.9 65.3 137.5 173.7 101.1 103.9 158.2 65.6
Lip, oral cavity, & pharynx 1.8 2.8 0.8 1.4 2.6 0.5 1.9 3.0 0.8 1.5 2.7 0.6 Esophagus 3.0 5.5 0.5 2.4 5.3 0.3 2.9 5.4 0.5 2.2 4.9 0.3
Stomach 21.9 28.8 15.0 16.9 27.2 9.7 21.5 27.9 15.0 15.9 25.3 9.3
Colon & rectum 12.7 13.9 11.4 9.8 13.3 7.4 13.4 15.2 11.7 10.1 14.0 7.3
Liver 22.3 33.6 10.8 17.7 29.9 7.5 22.7 34.1 11.2 17.5 29.3 7.5
Gallbladder† 6.9 7.0 6.9 5.4 6.8 4.4 6.9 6.7 7.1 5.1 6.3 4.3 Pancreas 7.0 7.7 6.4 5.5 7.3 4.2 7.3 7.8 6.7 5.5 7.1 4.2 Larynx 1.1 1.9 0.2 0.8 1.9 0.1 1.0 1.8 0.2 0.7 1.7 0.1
Lung 28.7 42.6 14.7 22.4 41.2 9.4 29.1 42.8 15.2 21.7 39.5 9.4
Breast 3.3 0.1 6.6 2.6 0.1 4.8 3.4 0.0 6.8 2.6 0.0 4.9
Cervix uteri 2.0 - 4.1 1.6 - 2.8 2.0 - 4.0 1.5 - 2.7
Corpus uteri 0.3 - 0.6 0.2 - 0.4 0.3 - 0.7 0.3 - 0.5
Ovary 1.5 - 2.9 1.1 - 2.1 1.7 - 3.4 1.2 - 2.3
Prostate 2.1 4.1 - 1.6 4.5 - 2.3 4.5 - 1.6 4.6 -
Testis 0.0 0.1 - 0.0 0.0 - 0.0 0.1 - 0.0 0.1 -
Kidney 1.4 1.9 0.8 1.1 1.8 0.5 1.5 1.9 1.0 1.1 1.8 0.7 Bladder 1.9 2.9 0.9 1.4 2.9 0.5 1.9 2.8 1.0 1.4 2.8 0.6 Brain & CNS 2.3 2.4 2.2 2.0 2.3 1.7 2.4 2.6 2.1 1.9 2.4 1.6 Thyroid 0.7 0.4 1.0 0.5 0.4 0.6 0.8 0.4 1.1 0.6 0.4 0.7 Hodgkin’s disease 0.1 0.1 0.0 0.1 0.1 0.0 0.1 0.1 0.1 0.1 0.1 0.0 Non-Hodgkin’s lymphoma 2.5 3.0 2.0 2.0 2.8 1.4 2.6 3.2 2.0 2.0 2.9 1.3 Multiple myeloma 1.1 1.2 1.0 0.9 1.1 0.7 1.2 1.2 1.3 0.9 1.1 0.9 Leukemia 2.9 3.4 2.3 2.6 3.3 1.9 2.9 3.3 2.5 2.6 3.2 2.1 Other & ill-defined 6.6 7.3 5.9 5.3 7.0 4.1 7.6 8.8 6.4 5.9 8.1 4.3
*Age adjusted to the WHO world standard population; †Includes gallbladder and other/unspecified parts of biliary tract. CNS, central nervous system.
Table 5-1. Trends in cancer incidence rates in both sexes during 1999-2007 in Korea
Site Year
1999 2000 2001 2002 2003 2004 2005 2006 2007 APC*
All sites 210.5 205.1 216.7 220.1 226.3 233.5 246.2 249.9 254.5 2.8†
Lip, oral cavity, & pharynx 3.6 4.4 3.6 3.7 3.8 3.7 3.7 3.7 3.7 -0.4
Esophagus 4.1 3.7 3.9 3.8 3.6 3.5 3.5 3.4 3.2 -2.4†
Stomach 43.6 42.3 44.0 43.6 43.1 41.0 44.2 42.6 40.4 -0.6
Colon & rectum 20.4 21.0 22.9 24.7 26.6 28.3 30.7 32.0 32.3 6.6†
Liver 27.9 26.7 27.3 26.5 25.7 25.5 25.7 24.4 23.5 -1.9†
Gallbladder‡ 6.5 6.4 6.7 6.7 6.6 6.9 7.1 6.5 6.4 0.2
Pancreas 5.6 5.5 5.5 5.8 5.8 6.0 6.3 6.1 6.1 1.5†
Larynx 2.3 2.2 2.4 2.2 2.1 1.9 2.0 1.8 1.7 -3.9†
Lung 28.5 27.7 28.3 28.5 27.8 28.7 28.8 28.4 27.5 0.0
Breast 10.7 10.8 12.7 13.9 14.1 14.8 16.0 16.8 17.6 6.6†
Cervix uteri 8.5 7.9 8.3 7.7 7.4 6.8 6.4 6.3 5.5 -5.0†
Corpus uteri 1.4 1.3 1.5 1.7 1.9 1.9 2.0 2.1 2.1 5.8†
Ovary 2.7 2.5 2.5 2.6 2.6 2.7 2.8 2.7 2.9 1.6†
Prostate 3.1 2.7 3.6 3.9 4.7 5.9 6.2 7.2 8.3 15.0†
Testis 0.3 0.3 0.3 0.3 0.3 0.3 0.3 0.4 0.3 3.2†
Kidney 3.0 2.9 3.3 3.4 3.5 3.7 4.1 4.4 4.6 6.0†
Bladder 4.6 4.6 4.9 4.7 5.1 5.1 5.0 4.9 4.8 0.7
Brain & CNS 2.9 2.8 2.8 2.6 2.9 2.9 3.1 2.9 3.0 0.9
Thyroid 6.3 6.1 7.9 9.5 12.7 17.4 21.0 25.9 32.8 25.2†
Hodgkin’s disease 0.2 0.3 0.3 0.3 0.3 0.4 0.3 0.3 0.4 4.2†
Non-Hodgkin’s lymphoma 4.5 4.2 4.5 4.6 4.9 5.2 5.2 5.4 5.3 3.2†
Multiple myeloma 1.0 1.0 1.1 1.1 1.1 1.2 1.3 1.3 1.3 4.0
Leukemia 4.7 4.3 4.7 4.8 4.7 4.8 4.7 4.8 4.7 0.6
Other & ill-defined 14.3 13.5 13.9 13.5 14.9 14.9 15.8 15.8 16.2 -
*APC, annual percent change using age-standardized incidence based on the WHO world standard population; †The APC is significantly different from zero (P<0.05); ‡Includes gallbladder and other/unspecified parts of biliary tract.
CNS, central nervous system.
Table 5-2. Trends in cancer incidence rates in males during 1999-2007 in Korea
Site Year
1999 2000 2001 2002 2003 2004 2005 2006 2007 APC*
All sites 285.0 276.7 288.3 290.0 293.3 297.6 309.6 307.4 305.9 1.3†
Lip, oral cavity, & pharynx 6.1 7.1 6.0 6.2 6.5 6.1 6.0 6.1 6.0 -0.9
Esophagus 8.8 8.0 8.3 8.2 7.7 7.7 7.6 7.2 6.7 -2.7†
Stomach 66.2 65.0 67.2 66.6 65.7 62.1 66.6 64.9 61.2 -0.7
Colon & rectum 26.2 27.2 29.6 32.9 35.0 37.5 40.8 42.7 43.5 7.2†
Liver 46.8 44.7 45.1 43.9 42.2 42.0 42.5 39.9 38.4 -2.1†
Gallbladder‡ 8.1 7.8 8.2 8.1 7.8 8.4 8.7 8.0 7.7 0.1
Pancreas 7.8 7.6 7.6 7.9 7.7 8.0 8.3 7.9 8.0 0.6
Larynx 4.9 4.5 5.1 4.7 4.4 4.1 4.3 3.7 3.6 -3.8†
Lung 51.4 49.8 51.1 51.0 49.8 50.7 50.7 48.9 47.5 -0.7†
Breast 0.2 0.3 0.2 0.3 0.2 0.2 0.2 0.2 0.1 -4.8
Prostate 8.4 7.2 9.5 10.1 12.2 14.8 15.5 17.7 20.0 13.4†
Testis 0.6 0.5 0.6 0.6 0.6 0.6 0.6 0.7 0.7 3.2†
Kidney 4.5 4.4 4.9 5.0 5.1 5.5 6.0 6.4 6.8 5.6†
Bladder 9.0 9.0 9.4 9.0 9.6 9.7 9.7 9.5 9.0 0.5
Brain & CNS 3.2 3.1 3.1 2.9 3.3 3.3 3.4 3.1 3.3 0.8
Thyroid 2.1 1.9 2.4 2.7 3.6 4.9 6.0 7.7 9.9 23.7†
Hodgkin’s disease 0.4 0.4 0.4 0.3 0.4 0.5 0.4 0.4 0.5 2.5
Non-Hodgkin’s lymphoma 5.8 5.5 5.8 5.8 6.2 6.6 6.4 6.8 6.7 2.6†
Multiple myeloma 1.2 1.3 1.4 1.4 1.4 1.4 1.6 1.4 1.6 2.8†
Leukemia 5.5 5.0 5.4 5.8 5.4 5.6 5.5 5.5 5.5 0.5
Other & ill-defined 17.9 16.5 16.8 16.5 18.2 17.9 18.9 18.5 19.2 -
*APC, annual percent change using age-standardized incidence based on the WHO world standard population; †The APC is significantly different from zero (P<0.05); ‡Includes gallbladder and other/unspecified parts of biliary tract.
CNS, central nervous system.
Trends in cancer mortality
Figs. 1, 2 show the trends in cancer deaths for all sites combined and for selected cancer sites. Age-standardized mortality rates have decreased for all sites combined in both sexes since 2002.
Lung cancer surpassed stomach cancer as the leading cause of cancer death in 1999, and is expected to account for 21.1% of all cancer deaths in 2007. The age-standardized mortality rates of lung cancer has decreased slightly for men since 2001, but in- creased in women. The age-standardized mortality rates of stom- ach and cervix uteri cancer have decreased continuously. Along with the significant increases in colorectal, prostate and female breast cancer incidence, the mortality rates of these cancers have also continued to increase.
Age-specific incidence rates for selected cancer sites
Table 6 presents the most common cancer sites by sex and age group in 2006-2007. Leukemia and thyroid were the most com- mon forms in both sexes, for ages 0-14 and 15-34 yr, respective- ly. For males, stomach cancer was the most common in 35-64- yr-olds, while lung cancer was more frequent for those aged 65 and older. For females, the most common sites of cancer were the thyroid for the 35-64-yr-old. For the 65 and over age groups, colorectal cancer was the second common sites in 2006, was most common cancer sites in 2007.
Fig. 3 shows the age-specific incidence rates of the selected cancers for men and women in 2007. The data show that the in- cidence of stomach, lung, liver and colorectal cancers increased gradually with age. In women, the age-specific incidence rates of breast and thyroid cancer has increased with age until the
Table 5-3. Trends in cancer incidence rates in females during 1999-2007 in KoreaSite Year
1999 2000 2001 2002 2003 2004 2005 2006 2007 APC*
All sites 161.1 157.4 169.0 174.6 183.1 192.5 206.5 215.0 224.9 4.7†
Lip, oral cavity, & pharynx 1.6 2.4 1.7 1.7 1.7 1.8 1.9 1.8 1.8 0.0
Esophagus 0.6 0.6 0.6 0.5 0.6 0.5 0.4 0.5 0.5 -2.8†
Stomach 26.7 25.2 26.2 26.3 25.8 24.6 26.8 24.9 23.9 -0.9
Colon & rectum 16.4 16.4 17.9 18.8 20.4 21.3 22.7 23.7 23.4 5.3†
Liver 12.3 11.8 12.2 11.8 11.5 11.3 11.3 11.0 10.7 -1.6†
Gallbladder‡ 5.3 5.5 5.7 5.8 5.8 5.9 6.0 5.4 5.4 0.2
Pancreas 4.0 4.0 4.0 4.2 4.4 4.4 4.7 4.7 4.6 2.4†
Larynx 0.4 0.3 0.3 0.3 0.3 0.3 0.3 0.2 0.2 -9.5†
Lung 12.4 12.5 12.3 12.6 12.3 13.0 13.4 13.8 13.3 1.3†
Breast 20.9 20.9 24.7 27.2 27.7 29.0 31.5 33.0 34.7 6.8†
Cervix uteri 16.3 15.1 15.8 14.8 14.1 13.0 12.3 12.1 10.7 -4.8†
Corpus uteri 2.8 2.6 3.0 3.3 3.8 3.7 3.9 4.0 4.0 6.0†
Ovary 5.0 4.8 4.8 5.0 5.1 5.1 5.4 5.3 5.7 1.8†
Kidney 1.7 1.8 1.9 2.0 2.1 2.2 2.5 2.7 2.7 6.2†
Bladder 1.6 1.6 1.7 1.7 1.8 1.7 1.7 1.6 1.6 0.0
Brain & CNS 2.6 2.5 2.5 2.4 2.5 2.6 2.8 2.6 2.7 1.0
Thyroid 10.4 10.1 13.2 16.2 21.7 29.9 35.8 44.1 55.6 25.7†
Hodgkin’s disease 0.1 0.2 0.2 0.2 0.2 0.2 0.2 0.3 0.3 6.8†
Non-Hodgkin’s lymphoma 3.4 3.2 3.4 3.5 3.9 4.1 4.3 4.3 4.2 4.0†
Multiple myeloma 0.8 0.8 0.9 0.8 0.9 1.0 1.2 1.1 1.2 5.6†
Leukemia 3.9 3.8 4.1 4.0 4.1 4.0 4.0 4.3 4.0 0.8
Other & ill-defined 11.8 11.5 11.8 11.5 12.5 12.7 13.6 13.7 13.9 -
*APC, annual percent change using age-standardized incidence based on the WHO world standard population; †The APC is significantly different from zero (P<0.05); ‡Includes gallbladder and other/unspecified parts of biliary tract.
CNS, central nervous system.
Rate per 100,000
Year
Male Incidence
Male & Female Incidence
Male Mortality
Male & Female Mortality Female Mortality
Female Incidence
83 85 87 89 91 93 95 97 99 01 03 05 07 350
300
250
200
150
100
50
0
Fig. 1. Age-standardized cancer incidence and death rates for all sites by sex during 1983-2007 in Korea.
Age-standardized rate per 100,000 Age-standardized rate per 100,000
Year of death Year of death
Males Females
Stomach Stomach
Colon & Rectum Colon & Rectum
Liver Liver
Lung Lung
Prostate Thyroid
Breast Cervix
83 85 87 89 91 93 95 97 99 01 03 05 07 83 85 87 89 91 93 95 97 99 01 03 05 07 100
80
60
40
20
0
40
30
20
10
0
Fig. 2. Age-standardized cancer mortality for selected cancers by sex during 1983-2007 in Korea.
Age-specific rate per 100,000 Age-specific rate per 100,000
Age group Age group
Males Females
Stomach Stomach
Colon & Rectum Colon & Rectum
Liver Liver
Lung Lung
Prostate Breast
Cervix uteri Thyroid
0- 5- 10- 15- 20- 25- 30- 35- 40- 45- 50- 55- 60- 65- 70- 78- 80- 85- 0- 5- 10- 15- 20- 25- 30- 35- 40- 45- 50- 55- 60- 65- 70- 78- 80- 85- 800
700 600 500 400 300 200 100 0
250
200
150
100
50
0
Fig. 3. Age-specific incidence rates of major cancers during 2007 in Korea.
Table 6. Five major sites of cancer incidence by age group and sex during 2006-2007 in Korea
Rank 2006 2007
0-14 yr 15-34 yr 35-64 yr 65 yr and over 0-14 yr 15-34 yr 35-64 yr 65 yr and over
Males 1 2 3 4 5
Leukemia (4.3) Brain & CNS (2.0)
Non-Hodgkin’s lymphoma (1.7) Kidney (0.5)
Testis (0.4)
Thyroid (4.8) Stomach (3.6)
Leukemia (2.8) Non-Hodgkin’s lymphoma (2.6) Colon & rectum
(2.4)
Stomach (92.0) Liver (71.3) Colon & rectum
(59.2) Lung (44.4)
Thyroid (17.1)
Lung (456.9) Stomach (453.4)
Colon & rectum (298.6) Liver (211.9)
Prostate (187.3)
Leukemia (4.5 ) Brain & CNS (2.4)
Non-Hodgkin’s lymphoma (1.4) Kidney (0.3)
Testis (0.3)
Thyroid (6.2) Leukemia (3.0)
Stomach (2.9) Non-Hodgkin’s lymphoma (2.7) Colon & rectum
(2.1)
Stomach (87.9) Liver (67.2) Colon & rectum
(60.8) Lung (40.5) Thyroid (22.3)
Lung (456.9) Stomach (422.3)
Colon & rectum (305.2)
Liver (211.8) Prostate
(209.9) Females
1 2 3 4 5
Leukemia (4.0) Brain & CNS
(2.1) Non-Hodgkin’s lymphoma (0.7)
Ovary (0.6)*
Kidney (0.6)*
Thyroid (29.6) Breast
(9.2) Stomach
(5.0) Cervix uteri
(4.8) Ovary (2.6)
Thyroid (105.9)
Breast (87.9) Stomach
(39.4) Colon & rectum
(38.1) Cervix uteri (26.2)
Stomach (159.1) Colon & rectum
(152.5) Lung (117.6) Liver (74.2) Gallbladder† (50.3)
Leukemia (3.8) Brain & CNS
(1.9) Non-Hodgkin’s lymphoma (0.8)
Ovary (0.7) Kidney (0.5)
Thyroid (35.3) Breast
(9.8) Stomach
(4.7) Cervix uteri
(4.7) Ovary (3.0)
Thyroid (135.1) Breast
(92.8) Stomach
(37.8) Colon & rectum
(36.7) Cervix uteri (23.4)
Colon & rectum (154.4) Stomach
(153.6) Lung (113.7) Liver (74.5) Thyroid (55.6)
*Same ranks with equal number of incident cases in ovary and kidney cancers for 0-14 yr age group in 2006; †Includes gallbladder and other/unspecified parts of biliary tract.
CNS, central nervous system.
forties and leveled off.
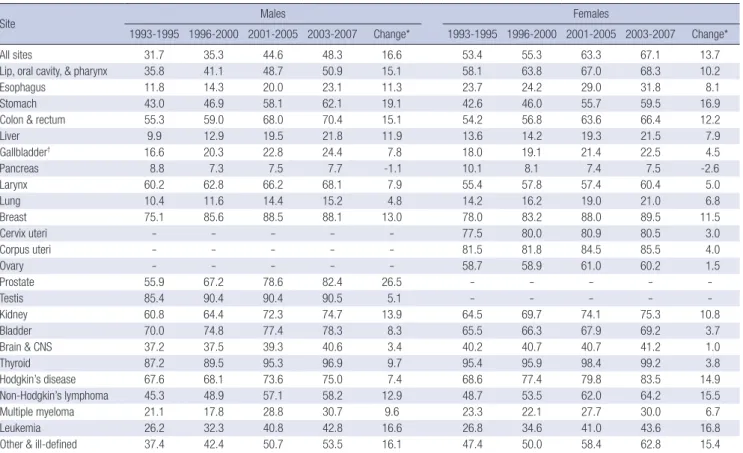
Survival rates
Table 7 shows the 5-yr relative survivals for four different peri- ods: 1993-1995, 1996-2000, 2001-2005 and 2003-2007. Notable improvement has been made in the 5-yr relative survival rates for all cancer sites combined. The 5-yr survival in females ap- peared to be higher than in males, and this can be partly ex- plained by the high frequency of cancers in females that are known to have relatively good prognoses (e.g., thyroid, breast and uterine cervix).
The 5-yr relative survival rates appeared to be higher for most major cancer sites in patients diagnosed during 2003-2007 com- pared to 1993-1995, except for cancers of the pancreas. The great- est improvements were seen in prostate cancer, stomach can- cer, leukemia, non-Hodgkin’s lymphoma. The improving sur- vival rates could be attributable to early detection, as well as to improved treatments (14, 15), but this needs to be evaluated further. Lack of progress in early detection and treatment could explain the observed absence of improvement in the survival rate of pancreatic cancer (16).
Table 7. Trends in the 5-yr relative survival rates (%) by year of diagnosis during 1993-2007 in Korea
Site Males Females
1993-1995 1996-2000 2001-2005 2003-2007 Change* 1993-1995 1996-2000 2001-2005 2003-2007 Change*
All sites 31.7 35.3 44.6 48.3 16.6 53.4 55.3 63.3 67.1 13.7
Lip, oral cavity, & pharynx 35.8 41.1 48.7 50.9 15.1 58.1 63.8 67.0 68.3 10.2
Esophagus 11.8 14.3 20.0 23.1 11.3 23.7 24.2 29.0 31.8 8.1
Stomach 43.0 46.9 58.1 62.1 19.1 42.6 46.0 55.7 59.5 16.9
Colon & rectum 55.3 59.0 68.0 70.4 15.1 54.2 56.8 63.6 66.4 12.2
Liver 9.9 12.9 19.5 21.8 11.9 13.6 14.2 19.3 21.5 7.9
Gallbladder† 16.6 20.3 22.8 24.4 7.8 18.0 19.1 21.4 22.5 4.5
Pancreas 8.8 7.3 7.5 7.7 -1.1 10.1 8.1 7.4 7.5 -2.6
Larynx 60.2 62.8 66.2 68.1 7.9 55.4 57.8 57.4 60.4 5.0
Lung 10.4 11.6 14.4 15.2 4.8 14.2 16.2 19.0 21.0 6.8
Breast 75.1 85.6 88.5 88.1 13.0 78.0 83.2 88.0 89.5 11.5
Cervix uteri - - - 77.5 80.0 80.9 80.5 3.0
Corpus uteri - - - 81.5 81.8 84.5 85.5 4.0
Ovary - - - 58.7 58.9 61.0 60.2 1.5
Prostate 55.9 67.2 78.6 82.4 26.5 - - - - -
Testis 85.4 90.4 90.4 90.5 5.1 - - - - -
Kidney 60.8 64.4 72.3 74.7 13.9 64.5 69.7 74.1 75.3 10.8
Bladder 70.0 74.8 77.4 78.3 8.3 65.5 66.3 67.9 69.2 3.7
Brain & CNS 37.2 37.5 39.3 40.6 3.4 40.2 40.7 40.7 41.2 1.0
Thyroid 87.2 89.5 95.3 96.9 9.7 95.4 95.9 98.4 99.2 3.8
Hodgkin’s disease 67.6 68.1 73.6 75.0 7.4 68.6 77.4 79.8 83.5 14.9
Non-Hodgkin’s lymphoma 45.3 48.9 57.1 58.2 12.9 48.7 53.5 62.0 64.2 15.5
Multiple myeloma 21.1 17.8 28.8 30.7 9.6 23.3 22.1 27.7 30.0 6.7
Leukemia 26.2 32.3 40.8 42.8 16.6 26.8 34.6 41.0 43.6 16.8
Other & ill-defined 37.4 42.4 50.7 53.5 16.1 47.4 50.0 58.4 62.8 15.4
*Change in the 5-yr relative survival between 1993-1995 and 2003-2007 as a percentage; †Includes gallbladder and other/unspecified parts of biliary tract.
CNS, central nervous system.
REFERENCES
1. National Statistical Office. 2009. Available at http://kosis.nso.go.kr [Ac- cessed 14 January 2010].
2. Ministry for Heath, Welfare and Family Affairs. Annual report of cancer incidence (2006) and survival (1993-2006) in Korea; 2009.
3. Won YJ, Sung J, Jung KW, Kong HJ, Park S, Shin HR, Park EC, Ahn YO, Hwang IK, Lee DH, Choi JS, Kim WC, Lee TY, Yoo CI, Bae JM, Kim ON, Chung W, Kong IS, Lee DH, Lee JS. Nationwide cancer incidence in Ko- rea, 2003-2005. Cancer Res Treat 2009; 41: 122-31.
4. Jung KW, Won YJ, Park S, Kong HJ, Sung J, Shin HR, Park EC, Lee JS.
Cancer Statistics in Korea: Incidence, Mortality and Survival in 2005. J Korean Med Sci 2009; 24: 995-1003.
5. Shin HR, Won YJ, Jung KW, Kong HJ, Yim SH, Lee JK, Noh HI, Pisani P, Park JG; Members of the Regional Cancer Registries. Nationwide can- cer incidence in Korea, 1999-2001; first result using the National Cancer Incidence Database. Cancer Res Treat 2005; 37: 325-31.
6. Fritz A, Percy C, Jack A, Shanmugaratnam K, Sobin L, Parkin D, Whel- an S, eds. International classification of diseases for oncology, 3rd ed.
Geneva, Switzerland: World Health Organization; 2000.
7. Manual of the international statistical classification of diseases, injuries, and causes of death, 10th revision. Geneva, Switzerland: World Health Organization; 1992.
8. Segi M. Cancer mortality for selected sites in 24 countries (1950-1957).
Sendai, Japan: Tohoku University School of Medicine; 1960.
9. Ries L, Harkins D, Krapcho M, Mariotto A, Miller B, Feuer E, Clegg L,
Eisner M, Horner M, Howlader N, Hayat M, Hankey B, Edwards B. SEER cancer statistics review, 1975-2003. Available at http://seer.cancer.gov/
csr/1975_2003/, based on November 2005 SEER data submission, post- ed to the SEER Web site, 2006. Bethesda, MD: National Cancer Institute.
[Accessed 12 September 2006].
10. Ederer F, Heise H. Instructions to IBM programmers in processing surviv- al computations. Methodological note No. 10, Bethesda, MD: National Cancer Institute; 1959.
11. Dickman P. Available at http://www.pauldickman.com [Accessed 14 April 2009].
12. Davies L, Welch HG. Increasing incidence of thyroid cancer in the Unit- ed States, 1973-2002. JAMA 2006; 295: 2164-7.
13. Enewold L, Zhu K, Ron E, Marrogi AJ, Stojadinovic A, Peoples GE, De- vesa SS. Rising thyroid cancer incidence in the United States by demo- graphic and tumor characteristics, 1980-2005. Cancer Epidemiol Bio- markers Prev 2009; 18: 784-91.
14. Jung KW, Yim SH, Kong HJ, Hwang SY, Won YJ, Lee JK, Shin HR. Cancer survival in Korea 1993-2002: a population-based study. J Korean Med Sci 2007; 22 Suppl: S5-10.
15. Gondos A, Bray F, Hakulinen T, Brenner H; EUNICE Survival Working Group. Trends in cancer survival in 11 European populations from 1990 to 2009: a model-based analysis. Ann Oncol 2009; 20: 564-73.
16. Dickman PW, Adami HO. Interpreting trends in cancer patient survival.
J Intern Med 2006; 260: 103-17.