경남지역 논 토양 지형과 미생물 군집의 관계
이영한†·안병구1†·손연규2*
경상남도농업기술원, 1전라북도농업기술원, 2국립농업과학원
Relationship of Topography and Microbial Community from Paddy Soils in Gyeongnam Province
Young-Han Lee†, Byung-Koo Ahn1†, and Yeon Kyu Sonn2*
Gyeongsangnam-do Agricultural Research and Extension Services, Jinju 660-370, Korea
1Jeollabuk-do Agricultural Research and Extension Services, Iksan 570-704, Korea
2National Academy of Agricultural Science, RDA, Suin-ro 150, Suwon, 441-707, Korea
The present study was aimed to evaluate the soil microbial communities by fatty acid methyl ester (FAME) method in paddy soils at 20 sites in Gyeongnam Province. The soil microbial biomass carbon content of fan and valley 1,266 mg kg-1 was higher than alluvial plain 578 mg kg-1 (p<0.05). In addition, The dehydrogenase activity of fan and valley 204 ㎍ TPF g-1 24h-1 was higher than alluvial plain 93 ㎍ TPF g-1 24h-1 (p<0.05). The communities of total bacteria and Gram-negative bacteria in the fan and valley paddy soils were significantly higher than those in the alluvial plain paddy soils (p<0.05). Total bacteria communities should be considered as a potential responsible factor for the obvious microbial community differentiation that was observed between the fan and valley and alluvial plain in paddy soils.
Key words: Paddy soil, Microbial community, Soil topography, FAME
접수 : 2011. 11. 17 수리 : 2011. 12. 2
†공동 제1저자
*연락저자 : Phone: +82312900337 E-mail: [email protected]
서 언
지속가능한 농업을 위해서는 토양 속에 살고 있는 미생물 의 다양성과 활성을 증대시키는 방안이 매우 중요하다 (Lee and Kim, 2011; Lee and Yun, 2011). 최근에는 토양 미생물 의 세포벽 지방산 조성을 간단하고 빠르게 분석할 수 있는 Fatty acid methyl ester (FAME) 방법을 사용하여 토양의 미 생물 생체량과 군집을 쉽게 분석할 수 있다 (Kim and Lee, 2011; Lee et al., 2011; Macalady et al., 1998; Schutter and Dick, 2000). 이러한 기술을 Kim and Lee (2011)는 다 양한 녹비작물이 투입된 논에서 토양 미생물 군집을 분석한 결과 토양의 그람음성 세균과 그람양성 세균의 비율은 청보 리 처리구가 자운영과 트리티케일 처리구 보다 유의적인 증 가를 보고하였다. 또한, 환경과 영양적인 스트레스 지표로 사 용되는 (Bossio and Scow, 1998; Kieft et al., 1997) cy17:0 과 16:1ω7c 비율 그리고 cy19:0과 18:1ω7c 비율은 상대적으 로 미생물 영양원이 풍부한 청보리 처리구에서 낮은 경향을 보였다고 하였다.
지형적으로 경남지역 밭 토양 미생물의 군집은 총 세균 함량은 산록경사지가 143 nmol g-1으로 곡간 및 선상지 75 nmol g-1에 비해 1.9배, 구릉지 49 nmol g-1와 하성평탄지 44 nmol g-1 보다 3배 정도 높았다 (Lee and Ha, 2011). 산 록경사지에서 총 세균 군집은 32.8%로 가장 높았으며 곡간 및 선상지 29.8% 및 하성평탄지 29.5%에 비해 유의적인 차 이가 있었으며 내생균근균 군집도 5.3%로 하성평탄지 3.0%, 구릉지 2.5%, 곡간 및 선상지 2.1%에 비해 유의적으로 높은 반면 곰팡이 군집은 13.4%로 하성평탄지 18.6%, 곡간 및 선 상지 18.2%, 구릉지 16.9%에 비해 유의적으로 낮았다 (Lee and Ha, 2011). 그리고 경남지역 지형별 과수원 토양의 총 FAME 함량은 구릉지가 377 nmol g-1으로 가장 높았으며 곡 간 및 선상지가 308 nmol g-1, 산록경사지 306 nmol g-1을 나타냈으며 유의적인 차이는 없었다 (Lee and Lee, 2011).
또한, 지형별 미생물은 곡간 및 선상지에서 곰팡이 17.8%, 내생균근균 3.4%로 가장 높았으나 유의적인 차이는 없었다.
토양 미생물의 군집은 환경에 적응한 균이 토양에서 우 점하게 된다. 그러나 경남지역 논 토양에서 지형적인 조건 에 따른 미생물 군집 변화에 대한 연구결과는 전무한 실정 이다. 따라서 본 연구는 경남지역 곡간 및 선상지 10개소와 하성평탄지 10개소를 대상으로 FAME 분석을 통한 토양 미
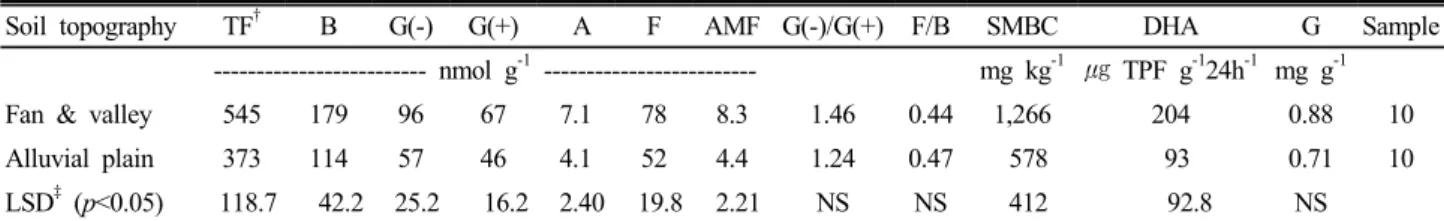
Table 1. Microbial biomass in paddy soils as affected by topography.
Soil topography TF† B G(-) G(+) A F AMF G(-)/G(+) F/B SMBC DHA G Sample
--- nmol g-1 --- mg kg-1 ㎍ TPF g-124h-1 mg g-1 Fan & valley 545 179 96 67 7.1 78 8.3 1.46 0.44 1,266 204 0.88 10
Alluvial plain 373 114 57 46 4.1 52 4.4 1.24 0.47 578 93 0.71 10
LSD‡ (p<0.05) 118.7 42.2 25.2 16.2 2.40 19.8 2.21 NS NS 412 92.8 NS
†TF, total FAMEs; B, total bacteria; G(-), Gram-negative bacteria; G(+), Gram-positive bacteria; A, actinomycetes; F, fungi; AMF, arbuscular mycorrhizal fungi; SMBC, soil microbial biomass carbon; DHA, dehydrogenase activity; G, glomalin.
‡The Fisher’s least significant difference (LSD) was used to detect and separate the mean treatment differences at 5.0% levels of significance. NS, not significant.
생물 군집을 검토하였으며 주성분분석에 의한 주요 변동요 인을 해석하여 친환경 토양관리를 위한 기초 자료를 제공하 고자 수행하였다.
재료 및 방법
논 토양 지점 선정 및 시료채취 방법 경남지역 논 토양의 화학성분과 미생물상의 관계를 분석하기 위하여 2011 년에 곡간 및 선상지 10개소, 하성평탄지 10개소를 선정하였 다. 토양은 비료를 시용하기 전인 3월부터 4월 사이에 표토 를 0-15 cm 깊이에서 500 g 정도를 3반복으로 채취하였다.
토양 시료조제 및 화학성분 분석방법 채취한 토양 은 실험실에서 7일간 풍건하여 2 mm 체를 통과된 것을 화 학성분 분석에 사용하였다. 화학성분 분석은 농촌진흥청 농 업과학기술원 토양 및 식물체 분석법 (NIAST, 2000)을 적 용하여 분석하였다.
토양 미생물 군집 분석 미생물 군집 분석을 위해 채 취한 토양은 -20℃에 2일간 보관하여 동결건조 한 후 미생 물 군집 분석에 사용하였다. 미생물 군집은 개별적으로 미 생물이 가지고 있는 고유 세포벽 지방산을 분석하는 FAME 방법을 이용하였다 (Schutter and Dick, 2000). 또한, 미생물 의 정량은 internal standard 19:0을 이용하여 분석하였다. 미 생물 군집 분석은 GC Agilent 6890N (Agilent Technologies, USA)과 HP-ULTRA 2 capillary column (25 m × 0.2 mm
× 0.33 µm film thickness, Agilent Technologies, USA)을 이용하였다. 칼럼 온도는 170℃에서 270℃가 될 때 까지 분 당 5℃씩 가온하였고 마지막 270℃에서 2분간 유지하였다.
분석된 미생물 세포벽 지방산은 MIDI software program package (MIDI, Inc., Newark, DE)을 이용하여 각각의 지방 산에 대한 미생물 군집을 분석하였다 (Hamel et al., 2006).
총 세균은 i15:0, a15:0, 15:0, i16:0, 16:1ω9, 16:1ω7, i17:0, a17:0, 17:0, cy17:0, 18:1ω7c 및 cy19:0 함량을 합산하여 분 석하였다 (Macalady et al., 1998; Schutter and Dick, 2000).
그람음성 세균은 지방산 16:1ω7c, 18:1ω7c, cy17:0 및 cy19:0 을 합산하였고 (Zelles, 1997) 그람양성 세균은 지방산 i15:0, a15:0, i16:0, i17:0 및 a17:0을 합산하여 구하였다 (Zelles, 1997). 방선균은 지방산 10Me18:0을 사용하였고 (Schutter and Dick, 2000) 곰팡이는 지방산 18:1ω9c와 18:2ω6c를 사 용하였다 (Bradleya et al., 2006). 또한, 지방산 16:1ω5c는 arbuscular mycorrhizal fungi의 biomarker로 이용하였다 (Balser et al., 2005; Frostegård et al., 1993; Olsson et al., 1998). 그리고 그람음성 세균과 그람양성 세균의 비율, 곰팡이와 총 세균의 비율을 구하였으며 cy17:0와 16:1ω7c 비 율 및 cy19:0와 18:1ω7c 비율은 토양에서 미생물 스트레스 지표로 사용하였다 (Bossio and Scow, 1998).
다변량 주성분 분석 및 통계분석 분석된 미생물 특 성은 SAS 프로그램 9.1.3 버젼 (2006)을 사용하였다. 지형별 토양 미생물 특성과 화학성은 5% 수준에서 최소유의차 검정 (LSD)을 하였다. 또한, 토양 화학성분과 미생물 군집은 주 성분 분석을 통하여 지형에 따른 차이를 비교 검토하였다.
결과 및 고찰
논 토양 미생물 함량 비교 경남지역 논 토양의 지형 별 미생물 함량을 FAME 방법으로 분석한 결과는 Table 1과 같다. 경남지역 논 토양 미생물 함량 평균값은 곡간 및 선상 지에서 총 FAME 함량이 545 nmol g-1이었으며 총 세균 함 량은 179 nmol g-1, 그람음성 세균은 96 nmol g-1, 그람양성 세균은 67 nmol g-1, 방선균은 7.1 nmol g-1, 곰팡이는 78 nmol g-1, 내생균근균은 8.3 nmol g-1이었다. 하성평탄지는 총 FAME 함량이 373 nmol g-1이었으며 총 세균 함량은 114 nmol g-1, 그람음성 세균은 57 nmol g-1, 그람양성 세균은 46 nmol g-1, 방선균은 4.1 nmol g-1, 곰팡이는 52 nmol g-1, 내생균근균은 4.4 nmol g-1이었다. 이러한 결과는 시설고추 재배지 (Lee et al., 2011) 보다 낮고 시설딸기 (Min et al., 2011)에 비해 높은 결과였으며 논에서 벼 생육초기 토양 (Kim and Lee, 2011) 보다 높았다. 또한, 곡간 및 선상지는 경남
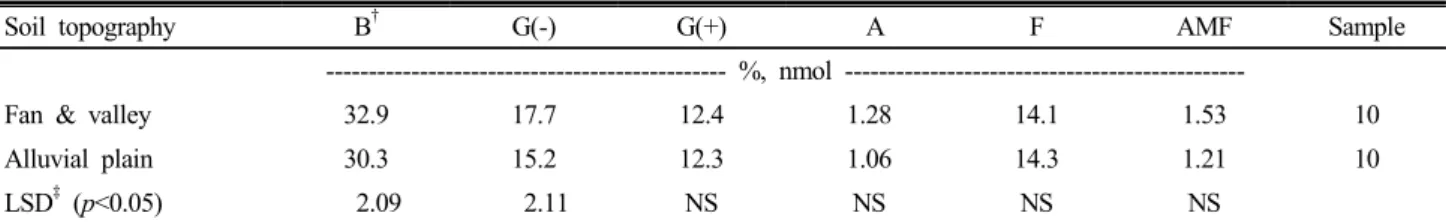
Table 2. Microbial communities in paddy soils as affected by topography.
Soil topography B† G(-) G(+) A F AMF Sample
--- %, nmol ---
Fan & valley 32.9 17.7 12.4 1.28 14.1 1.53 10
Alluvial plain 30.3 15.2 12.3 1.06 14.3 1.21 10
LSD‡ (p<0.05) 2.09 2.11 NS NS NS NS
†B, total bacteria; G(-), Gram-negative bacteria; G(+), Gram-positive bacteria; A, actinomycetes; F, fungi; AMF, arbuscular mycorrhizal fungi.
‡The Fisher’s least significant difference (LSD) was used to detect and separate the mean treatment differences at 5.0% levels of significance. NS, not significant.
Fig. 1. Ratio of 19:0 cyclo to 18:1 w7c in paddy soils. The Fisher’s least significant difference (LSD) was used to detect and separate the mean treatment differences at 5.0% levels of significance. Bars represent one standard deviation of the mean.
지역 밭 토양 (Lee and Ha, 2011) 보다 높았으나 경남지역 과수원 토양에 비해 내생균근균 함량은 낮은 결과를 보였다 (Lee and Lee, 2011).
논 토양에서 곡간 및 선상지는 하성평탄지에 비해 총 FAME, 총 세균, 그람음성 세균, 그람양성 세균, 방선균, 곰 팡이, 내생균근균 함량이 높았다 (p<0.05). 곡간 및 선상지 에서 미생물 함량이 높게 나타난 이유는 Lee and Ha (2011) 가 보고한 바와 같이 경사가 있는 곳에서는 용탈에 의한 비 료의 손실이 많을 것을 판단한 농가에서 퇴비시용량이나 화 학비료를 과다하게 시용한 결과로 해석되었다 (NIAST, 2010).
곡간 및 선상지는 그람음성 세균과 그람양성 세균 비율이 1.46으로 하성평탄지 보다 높았으나 유의성은 없었다. 대체 적으로 경남지역 곡간 및 선상지 논 토양의 그람음성 세균 과 그람양성 세균의 비율은 시설고추 재배지 0.75 (Lee et al., 2011), 논 초기 토양 1.0-1.3 (Kim and Lee, 2011), 밭 토 양 0.98 (Lee and Ha, 2011), 과수원 토양 1.20 (Lee and Lee, 2011) 보다 높았다. 토양 미생물체량은 곡간 및 선상지가 1,266 mg kg-1으로 하성평탄지 578 mg kg-1 보다 유의적으 로 많았으며 (p<0.05) 탈수소효소 활성도 곡간 및 선상지가 204 ㎍ TPF g-1 24h-1으로 하성평탄지 93 ㎍ TPF g-1 24h-1 보다 유의적으로 많았다 (p<0.05). 그러나 토양 글로말린 함 량은 유의적인 차이가 없었다. 이러한 결과로 인하여 토양 양이온 치환용량도 곡간 및 선상지에서 15.0 cmoc kg-1으로 하성평탄지 12.9 cmoc kg-1 보다 높았다 (p<0.05).
미생물 스트레스 지표 토양 환경과 영양적인 스트레 스 지표로 사용되는 cy19:0과 18:1ω7c 비율은 Fig. 1과 같이 곡간 및 선상지에서 0.89로 하성평탄지 0.49 보다 유의적으 로 높았다 (p<0.05). 일반적으로 cy19:0과 18:1ω7c 비율이 낮을수록 미생물이 받는 스트레스는 감소되는 것으로 알려 져 있다 (Mechri et al., 2010). 이러한 경향은 영양원, 산소 부족, 산성 토양, 토양의 수분 부족 등의 다양한 요인에 따 라 cyclopropyl 지방산이 집적됨으로 세균의 스트레스가 증가 되는 것으로 해석되었다 (Grogan and Cronan, 1997; Guckert et al., 1986).
논 토양 미생물 군집 분석 토양 미생물의 함량을 총 FAME 함량으로 나누어 미생물의 군집을 분석하였다 (Table 2). 논 토양 평균 미생물 군집은 곡간 및 선상지가 총 세균 이 32.9%, 그람음성 세균은 17.7%로서 하성평탄지의 총 세 균 30.3%, 그람음성 세균 15.2%에 비해 유의적으로 많았다 (p<0.05).
그람음성 세균은 토양 영양분이 부족할 경우 매우 민감하 게 반응하여 개체수가 감소하는 것으로 알려져 있다 (Kieft et al., 1997). 따라서 이러한 결과는 Table 3과 같이 토양 유기물 함량이 35 g kg-1으로 하성평탄지에 비해 유의적으 로 높았고 (p<0.05) 밭 토양 30 g kg-1 (Lee and Zhang, 2011) 과 과수원 토양 22 g kg-1 (Lee and Ha, 2011) 보다 높아 미 생물의 먹이인 탄소가 풍부하여 그람음성 세균 함량이 많아 진 것으로 판단되었다.
그람양성 세균, 방선균 및 내생균근균 비율은 곡간 및 선 상지가 각각 12.4%, 1.28%, 1.53%로 하성평탄지의 12.3%, 1.06%, 1.21% 보다 많았으나 유의적인 차이는 없었다. 곰팡 이 비율은 곡간 및 선상지에서 14.1%로 하성평탄지의 14.3%
보다 적었으나 유의적인 차이가 없었다.
논 토양의 미생물 군집과 토양 유기물 함량, 양이온 치환 용량 및 유효규산 함량을 포함한 지형에 따른 주성분 분석 결과는 Fig. 2와 같다. 주성분 분석은 토양 미생물 군집을 몇 가지의 성분으로 추출하여 설명하고 예측할 수 있다 (Lee and Kim, 2011; Lee and Yun, 2011; Lee et al., 2011). 주 성분 분석결과 제1주성분이 40.9%, 제2주성분이 20.3%로서
Table 3. Chemical properties of affected soil topography in paddy.
Soil topography pH EC OM Avail. P2O5
Exch. Cation
Avail. SiO2 CEC
K Ca Mg Na
(1:5) dS m-1 g kg-1 mg kg-1 --- cmolc kg-1 --- mg kg-1 cmolc kg-1
Fan & valley 6.4 0.52 35 234 0.49 7.3 1.8 0.39 186 15.0
Alluvial plain 6.3 0.68 24 258 0.30 6.3 1.4 0.46 170 12.9
LSD (p<0.05)† NS NS 7.6 NS NS NS NS NS NS 1.97
†The Fisher’s least significant difference (LSD) was used to detect and separate the mean treatment differences at 5.0% levels of significance. NS, not significant.
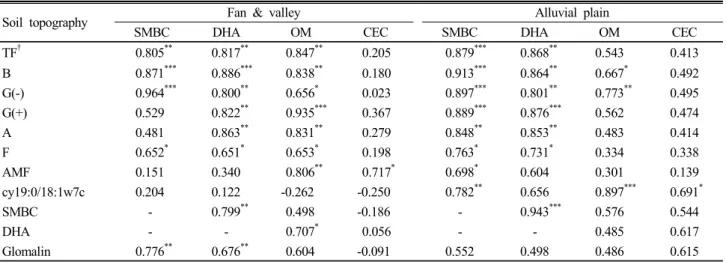
Table 4. Correlation between microbial biomass and chemical properties in paddy soils (n=10).
Soil topography Fan & valley Alluvial plain
SMBC DHA OM CEC SMBC DHA OM CEC
TF† 0.805** 0.817** 0.847** 0.205 0.879*** 0.868** 0.543 0.413
B 0.871*** 0.886*** 0.838** 0.180 0.913*** 0.864** 0.667* 0.492
G(-) 0.964*** 0.800** 0.656* 0.023 0.897*** 0.801** 0.773** 0.495
G(+) 0.529 0.822** 0.935*** 0.367 0.889*** 0.876*** 0.562 0.474
A 0.481 0.863** 0.831** 0.279 0.848** 0.853** 0.483 0.414
F 0.652* 0.651* 0.653* 0.198 0.763* 0.731* 0.334 0.338
AMF 0.151 0.340 0.806** 0.717* 0.698* 0.604 0.301 0.139
cy19:0/18:1w7c 0.204 0.122 -0.262 -0.250 0.782** 0.656 0.897*** 0.691*
SMBC - 0.799** 0.498 -0.186 - 0.943*** 0.576 0.544
DHA - - 0.707* 0.056 - - 0.485 0.617
Glomalin 0.776** 0.676** 0.604 -0.091 0.552 0.498 0.486 0.615
†TF, total FAMEs; B, total bacteria; G(-), Gram-negative bacteria; G(+), Gram-positive bacteria; A, actinomycetes; F, fungi; AMF, arbuscular mycorrhizal fungi; SMBC, soil microbial biomass carbon; DHA, dehydrogenase activity; G, glomalin.
Fig. 2. Principal component analysis between soil microbial communities and soil physicochemical properties. The variance explained by each principal component (PC) axis is shown in parentheses. PC analysis shows loading values for the individual microbial biomarkers. The bars represent one standard deviation of the mean. A, actinomycetes; AMF, arbuscular mycorrhizal fungi; B, bacteria; CEC, cation exchange capacity; DHA, dehydrogenase activity; G, glomalin;
G(-), Gram-negative bacteria; G(+), Gram-positive bacteria;
OM, soil organic matter; Si, soil available SiO2; SMBC, soil microbial biomass carbon. The Fisher’s least significant difference (LSD) was used to detect and separate the mean treatment differences at 5.0% levels of significance.
전체 61.2%의 자료를 설명할 수 있었다. 주성분 분석결과 곡간 및 선상지와 하성평탄지는 PC1에서 유의적인 차이를 나타냈다 (p<0.05). 제1주성분은 토양 유기물 함량 (1.96)이 가장 크게 기여하였으며 총 세균 (1.88), 탈수소효소 활성 (1.80), 미생물체량 (1.79), 글로말린 함량 (1.66), 양이온 치 환용량 (1.46), 그람음성 세균 (1.40)과 방선균 (1.29) 비율 순으로 정의 기여를 하였으며 곰팡이 (-0.72)는 부의 기여 를 하는 것으로 나타났다. 반면 제2주성분은 그람양성 세균 (1.16), 내생균근균 (1.10), 토양 유효규산 함량 (0.83) 순으 로 정의 기여를 하였다. 토양의 미생물체 함량과 토양 탈수 소효소 활성 및 토양 유기물 함량 및 양이온 치환용량의 상 관관계는 Table 4와 같다. 곡간 및 선상지의 미생물체 탄소 함량은 총 FAME 함량 (p<0.01), 총 세균 (p<0.001), 그람음 성 세균 (p<0.001), 곰팡이 (p<0.05) 및 토양 글로말린 함량 (p<0.01)과 유의적인 정의상관이 있었다. 또한, 하성평탄지 의 미생물체 탄소 함량은 총 FAME 함량 (p<0.001), 총 세균 (p<0.001), 그람음성 세균 (p<0.001), 그람양성 세균 (p<0.001), 방선균 (p<0.01), 곰팡이 (p<0.05) 및 내생균근균 (p<0.05) 및 cy19:0과 18:1w7c의 비율 (p<0.01)과 정의상관을 나타냈다. 토 양 유기물 함량은 곡간 및 선상지에서 총 FAME 함량 (p<0.01), 총 세균 (p<0.01), 그람음성 세균 (p<0.05), 그람양성 세균
(p<0.001), 방선균 (p<0.01), 곰팡이 (p<0.05) 및 내생균근균 (p<0.01) 및 탈수소효소 활성 (p<0.05)과 정의상관을 보였으 며 하성평탄지에서 총 세균 (p<0.05), 그람음성 세균 (p<0.01), 및 cy19:0과 18:1w7c의 비율 (p<0.001)과 정의상관을 나타 냈다.
논 토양 지형에 따른 미생물 군집은 토양 화학성과 토양 탈수소효소 활성 등 복잡한 관계를 형성하고 있어 토양 생 태계 관리가 매우 어렵다. 따라서 경남지역 논 토양의 미생 물 군집을 다양하게 유지하기 위해서는 지속적인 모니터링 이 필요할 것으로 생각된다.
요 약
경남지역 논 토양 곡간 및 선상지 10개소와 하성평탄지 10개소를 대상으로 2011년에 미생물 세포벽 지방산 함량을 분석하여 미생물 다양성을 주성분분석으로 해석하였다. 토 양 미생물체량은 곡간 및 선상지가 1,266 mg kg-1으로 하성 평탄지 578 mg kg-1 보다 유의적으로 많았으며 탈수소효소 활성도 곡간 및 선상지가 204 ㎍ TPF g-1 24h-1으로 하성평 탄지 93 ㎍ TPF g-1 24h-1보다 유의적으로 많았다. 논 토양 평균 미생물 군집은 곡간 및 선상지가 총 세균이 32.9%, 그 람음성 세균은 17.7%로서 하성평탄지의 총 세균 30.3%, 그 람음성 세균 15.2%에 비해 유의적으로 많았다. 주성분 분석 결과 토양 유기물 함량과 총 세균 군집 비율이 경남지역 논 토양의 곡간 및 선상지와 하성평탄지의 특성을 구분할 수 있었다.
사 사
본 연구는 농촌진흥청 공동연구사업(과제번호: PJ00690 6222011)의 지원에 의해 이루어진 것임.
인 용 문 헌
Balser, T., K.K. Treseder, and M. Ekenler. 2005. Using lipid analysis and hyphal length to quantify AM and saprotrophic fungal abundance along a soil chronosequence. Soil Biol.
Biochem. 37:601-604.
Bossio, D.A. and K.M. Scow. 1998. Impacts of carbon and flooding on soil microbial communities: phospholipid fatty acid profiles and substrate utilization patterns. Microb. Ecol.
35:265-278.
Bradleya, K., A. Rhae, R.A. Drijberb, and J. Knopsc. 2006.
Increased N availability in grassland soils modifies their microbial communities and decreases the abundance of arbuscular mycorrhizal fungi. Soil Biol. Biochem. 38:1583-
1595.
Frostegård, Å., A. Tunlid, and E. Bååth. 1993. Phospholipid fatty acid composition, biomass and activity of microbial communities from two soil types experimentally exposed to different heavy metals. Appl. Environ. Microbiol. 59:
3605-3617.
Grogan, D.W. and J.E. Cronan. 1997. Cyclopropane ring formation in membrane lipids of bacteria. Microbiol. Mol.
Biol. Rev. 61:429-441.
Guckert, J.B., M.A. Hood, and D.C. White. 1986. Phospholipid ester-linked fatty acid profile changes during nutrient deprivation of Vibrio cholerae: increases in cis/trans ratio and proportions of cyclopropyl fatty acid. Appl. Environ.
Microbial. 52:794-801.
Hamel, C., K. Hanson, F. Selles, A.F. Cruz, R. Lemke, B.
McConkey, and R. Zentner. 2006. Seasonal and long-term resource-related variations in soil microbial communities in wheat-based rotations of the Canadian prairie. Soil Biol.
Biochem. 38:2104-2116.
Kieft, T.L., E. Wilch, K. O’connor, D.B. Ringelberg, and D.C. White. 1997. Survival and phospholipid fatty acid profiles of surface and subsurface bacteria in natural sediment microcosms. Appl. Environ. Microbiol. 63:1531-1542.
Kim E.S. and Y.H. Lee. 2011. Response of soil microbial communities to applications of green manures in paddy at an early rice growing stage. Korean J. Soil Sci. Fert. 44:
221-227.
Lee, Y.H. and H. Kim. 2011. Response of soil microbial communities to different farming systems for upland soybean cultivation. J. Korean Soc. Appl. Biol. Chem. 54(3):423-433.
Lee, Y.H. and H.D. Yun. 2011. Changes in microbial community of agricultural soils subjected to organic farming system in Korean paddy fields with no-till management. J. Korean Soc. Appl. Biol. Chem. 54(3):434-441.
Lee, Y.H. and S.K. Ha. 2011. Impacts of topography on microbial community from upland soils in Gyeongnam Province. Korean J. Soil Sci. Fert. 44(3):485-491.
Lee, Y.H. and S.T. Lee. 2011. Comparison of microbial community of orchard soils in Gyeongnam Province. Korean J. Soil Sci. Fert. 44(3):492-497.
Lee, Y.H. and Y.S. Zhang. 2011. Response of microbe to chemical properties from orchard soil in Gyeongnam Province.
Korean J. Soil Sci. Fert. 44(2):236-241.
Lee, Y.S., J.H. Kang, K.J. Choi, S.T. Lee, E.S. Kim, W.D.
Song, and Y.H. Lee. 2011. Response of soil microbial communities to different cultivation systems in controlled horticultural land. Korean J. Soil Sci. Fert. 44(1):118-126.
Macalady, J.L., M.E. Fuller, and K.M. Scow. 1998. Effects of metam sodium fumigation on soil microbial activity and community structure. J. Environ. Qual. 27:54-63.
Mechri, B., H. Chehab, F. Attia, F.B. Mariem, M. Braham, and M. Hammami. 2010. Olive mill wastewater effects on
the microbial communities as studied in the field of olive trees by analysis of fatty acid signatures. Eur. J. Soil Bio.
l46:312-318.
Min, S.G., S.S. Park, and Y.H. Lee. 2011. Comparison of soil microbial communities to different practice for strawberry cultivation in controlled horticultural land. Korean J. Soil Sci. Fert. 44(3):479-484.
NIAST. 2000. Methods of analysis of soil and plant. National Institute of Agricultural Science and Technology, Suwon, Korea.
NIAST. 2010. Annual report of the monitoring project on agro-environmental quality in 2009. NIAST, RDA, Suwon, Korea.
Olsson, P.A., R. Francis, D.J. Read, and B. Söderström. 1998.
Growth of arbuscular mycorrhizal mycelium in calcareous dune sand and its interaction with other soil micro-organisms as estimated by measurement of specific fatty acids. Plant Soil 201:9-16.
SAS Institute. 2006. SAS Version 9.1.3. SAS Inst., Cary, NC.
Schutter, M.E. and R.P. Dick. 2000. Comparison of fatty acid methyl ester (FAME) methods for characterizing microbial communities. Soil Sci. Soc. Am. J. 64:1659-1668.
Zelles, L. 1997. Phospholipid fatty acid profiles in selected members of soil microbial communities. Chemosphere 35:
275-294.