Big Data Smoothing and Outlier Removal for Patent Big Data Analysis
JunHyeog Choi*, Sunghae Jun**1)
Abstract
In general statistical analysis, we need to make a normal assumption. If this assumption is not satisfied, we cannot expect a good result of statistical data analysis. Most of statistical methods processing the outlier and noise also need to the assumption. But the assumption is not satisfied in big data because of its large volume and heterogeneity. So we propose a methodology based on box-plot and data smoothing for controling outlier and noise in big data analysis. The proposed methodology is not dependent upon the normal assumption. In addition, we select patent documents as target domain of big data because patent big data analysis is a important issue in management of technology. We analyze patent documents using big data learning methods for technology analysis.
The collected patent data from patent databases on the world are preprocessed and analyzed by text mining and statistics. But the most researches about patent big data analysis did not consider the outlier and noise problem. This problem decreases the accuracy of prediction and increases the variance of parameter estimation. In this paper, we check the existence of the outlier and noise in patent big data. To know whether the outlier is or not in the patent big data, we use box-plot and smoothing visualization. We use the patent documents related to three dimensional printing technology to illustrate how the proposed methodology can be used for finding the existence of noise in the searched patent big data.
▸Keyword : Patent big data, Smoothing, Box-plot, Noise, Outlier, Statistical analysis
I. Introduction
빅 데이터는 크기(volume), 속도(velocity), 그리고 다양성 (variety)의 3가지 특성을 가지고 있다 [1-7]. 즉 기존의 데이 터베이스 시스템으로는 저장 및 관리하기가 어려울 정도로 데 이터의 크기가 커지고 있고 기존의 데이터에 새로운 데이터가 추가되는 속도가 매우 빨라지고 있다. 특히 숫자와 문자뿐만 아 니라 사회네트워크서비스(social network service) 등으로부터 다양한 형태의 데이터가 생성되고 있다. 이와 같은 빅 데이터의 다양성에 의해 빅 데이터의 분석에 대한 어려움이 존재한다. 즉 빅 데이터 속에는 문자, 숫자, 그림 등 서로 이질적인 (heterogeneous) 데이터 형태가 함께 존재하게 된다. 따라서
데이터의 이질성을 고려한 분석이 빅 데이터 분석에서 활발 하게 연구되어지고 있다 [1,2,7]. 또한 빅 데이터 분석에서는 노이즈(noise) 문제도 함께 나타난다. 노이즈는 관측된 변수에 포함된 오차(error)를 의미하며 이상치(outlier)와 같이 주어진 데이터의 분석결과에 왜곡된 해석을 일으키는 요인이 된다. 빅 데이터의 다양성으로 인하여 빅 데이터의 분석은 노이즈의 해 결에 대한 고려가 분석에 앞서 이루어져야 한다. 하지만 현재 대부분의 연구에서는 노이즈의 제거에 대한 고민보다는 대용량 데이터의 시각화 및 분석 그 자체에 더 많은 관심이 집중되어 있다. 하지만 빅 데이터 분석에서 노이즈에 대한 해결은 분석 이전에 우선적으로 진행되어야 할 작업이다. 본 연구에서는 이 와 같이 빅 데이터 속에 포함된 노이즈 문제를 해결하기 위하
∙First Author: JunHyeog Choi, Corresponding Author: Sunghae Jun
*JunHyeog Choi([email protected]), Dept. of Secretarial Management, Kimpo College
**Sunghae Jun([email protected]), Dept. of Statistics, Cheongju University
∙Received: 2016. 05. 26, Revised: 2016. 07. 04, Accepted: 2016. 08. 25.
∙This research was supported by KIMPO College's Research Fund
여 빅 데이터의 평활(smoothing)과 상자그림(box plot)의 사용 방법에 대하여 제안한다. 특히 노이즈 제거를 위한 사전탐지의 실제적용을 나타내기 위하여 제안하는 방법론을 특허(patent) 빅 데이터의 분석에 적용하였다. 특허 데이터는 개발된 기술 (technology)에 상세한 결과를 포함하고 있다. 특허제목, 요약, 청구항(claims), 발명자 및 출원인과 같은 문자(text), 출원날 짜, 인용정보(citations) 수와 같은 숫자(numbers), 그리고 개 발된 기술의 도면(drawings)과 그림(figures) 등 다양한 형태 의 데이터가 서로 섞여 있다 [8-9]. 또한 매년 출원, 등록되는 특허 수는 세계적으로 매우 많은 증가를 나타내고 있다. 따라서 특허문서는 대표적인 빅 데이터이다. 본 논문에서는 상자그림 과 평활 곡선의 시각화를 통하여 특허 빅 데이터에도 노이즈가 존재하고 있음을 알아본다. 이를 통하여 향후 특허 빅 데이터의 분석에서 본격적인 분석에 앞서 노이즈를 제거할 수 있도록 한 다. 2절에서는 빅 데이터 평활과 이사이 제거에 대하여 알아보 고 3절에서는 실제 제안하는 방법론을 설명한다. 3차원 프린팅 기술의 특허문서를 통하여 실제 노이즈의 존재에 대하여 4절에 서 알아보고 마지막 절에서는 본 연구의 결론과 향후 연구 과 제에 대하여 알아본다.
II. Big Data Smoothing and Outlier Removal
효과적인 데이터 분석을 위하여 최초 얻어진 데이터에 대한 다양한 변형(transformation) 작업이 필요하게 된다 [10]. 노이 즈제거는 효과적인 데이터 분석을 위한 대표적인 데이터 변형 작 업 중 하나이다. 또한 평활은 대표적인 노이즈제거 기법이다. 평활 은 다양한 통계적 기법을 이용하여 초기 데이터에 포함된 노이즈 를 제거한다. 일반적으로 노이즈는 관측된 변수에 포함된 확률오 차(random error)를 나타내며 추정된 값의 분산을 크게 하여 예 측의 정확성을 떨어뜨린다. 따라서 예측력을 향상시키기 위하여 수집된 데이터에 포함된 노이즈를 제거하는 작업이 필요하게 된 다. 평활과 함께 주어진 데이터의 노이즈를 제거하기 위하여 고려 될 수 있는 또 하나의 방법은 이상치(outlier)의 제거이다. 이상치 는 전체 데이터의 모형구조에서 크게 벗어나는 개체를 의미한다 [10]. 이상치를 제거하지 않은 상태에서 빅 데이터 분석이 이루어 진다면 그 결과는 전체에 대한 왜곡이 발생할 수 있다. 따라서 대부분의 데이터 마이닝 작업에서 이상치는 사전에 탐지하여 제 거한다 [10]. 물론 경우에 따라서 의미 있는 이상치를 빅 데이터 분석에 반드시 추가해야 할 때도 있다. 이 경우에는 기존의 이상치 분석(outlier analysis)을 포함한 다양한 비정규 마이닝(anomaly mining) 기법을 사용하면 된다. 이와 같은 방법은 사기탐지(fraud detection), 네트워크 침입(network attack)과 같은 특수한 경우 에 적용된다. 하지만 대부분의 빅 데이터 분석에서는 이상치를 노이즈 발생 원인으로 간주한다. 따라서 본 논문에서는 빅 데이터 의 노이즈 제거를 위하여 빅 데이터의 평활과 상자그림에 의한
이상치 탐지를 위한 효과적인 방법론에 대하여 연구한다.
III. Noise Removal for Patent Big Data Analysis
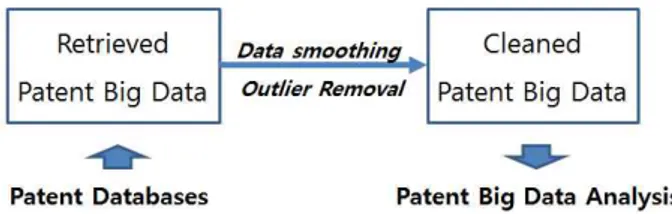
본 논문에서는 특정 분야의 기술분석을 위한 특허 빅 데이터 의 분석을 위하여 빅 데이터에 대한 평활과 이상치 제거 작업 을 수행한다. 그림 1은 제안하는 특허 빅 데이터의 노이즈 제거 를 위한 방법론을 나타내고 있다.
Fig. 1. Removing Noises for Patent Big Data Analysis
전 세계의 특허 데이터베이스로부터 주어진 기술분야에 대 한 특허문서 데이터를 검색한다 [11-13]. 수집된 특허 빅 데이 터로부터 텍스트 마이닝 등을 이용한 전처리(preprocessing)를 통하여 기술 키워드를 추출한다 [14-17]. 본 연구에서는 무료 공개 통계 소프트웨어인 R 프로젝트의 ‘tm’ 패키지를 이용하여 통계분석이 가능한 구조화된 데이터를 구축한다. 최종적으로 구축되는 검색된 특허 빅 데이터(retrieved patent big data)는 테이블 형식으로 각 행(row)은 연도, 그리고 각 열(column)은 추출된 키워드로 이루어진다. 테이블의 각 원소는 특정 키워드 가 특정 연도에 나타난 빈도를 나타낸다. 기술분석에서 특정 키 워드의 빈도가 지나치게 클 경우 기술추세를 파악하기 위한 분 석결과의 해석이 어렵게 되고 적합된 모형이 실제 추세를 왜곡 할 수 있다. 왜냐하면 발생빈도가 지나치게 큰 특정 키워드가 전체 추세의 곡선 기울기에 영향을 미치기 때문이다.
일반적으로 평활화 방법으로는 이동평균법(moving averages), 가중이동평균법(weighted moving averages), 지 수평활법(exponential smoothing) 등이 사용되고 있다 [18].
이와 함께 본 논문에서는 지역가중 다중회귀모형(locally weighted polynomial regression)을 이용한 특허 빅 데이터의 평활을 수행하였다 [19-21]. 다음 그림은 본 논문에서 고려하 는 빅 데이터 평활을 보여준다.
Fig. 2. Patent Big Data Smoothing
그림 2에서 X축과 Y축은 각각 독립변수(independent variable)와 종속변수(dependent variable)의 값을 나타낸다.
평활곡선에서 멀리 벗어난 점들이 많을수록 주어진 데이터에 노이즈가 포함되어 있을 가능성이 커지게 된다. 본 논문에서는 평활화 결과와 상자그림의 이상치 탐지결과를 종합하여 수집된 특허 빅 데이터에 포함된 노이즈에 대하여 결정하게 된다. 특히 지역가중 다중회귀모형의 성능평가를 위하여 절대잔차평균 (mean of absolute residual, MAR)과 표준오차(standard error, SE)를 이용한다. 절대잔차평균은 다음과 같이 정의된다 [18].
(1)
는 i번째 실제 관측 값이고, 는 i번째 예측 값이다. MAR 값이 작을수록 모형의 성능은 우수하게 된다. 모형에 포함된 모 수의 성능평가를 위하여 본 논문에서는 다음과 같은 표준오차 를 사용한다 [18].
(2)
(k+1)은 모형에 포함된 전체 모수의 개수를 나타낸다. SE 값이 작을수록 구축된 모형의 해당모수는 유의하다고 판정된다. 다 음 그림은 상자그림(box-plot)을 이용한 이상치 탐지를 나타내 고 있다.
Fig. 3. Outlier Detection for Patent Big Data
상자그림의 가운데는 중앙값(median)이 되고 좌우로 제1사 분위수(Q1)와 제3사분위수(Q3)로 이루어진 상자가 위치한다.
다음으로 좌측 경계값(Q1-1.5*IQR)과 우측 경계값 (Q3+1.5*IQR)을 구하고 이 값들을 벗어나는 값을 이상치로 판 정한다. 이 때 IQR(interquartile range)은 사분위수범위를 나 타내며 (Q3-Q1)을 통해 계산된다 [22]. 상자의 크기가 커지고 좌, 우측 경계값이 커질수록 해당 키워드 빈도 값의 분산이 커 지게 된다. 이와 같이 본 논문에서는 상자그림과 평활화 결과를
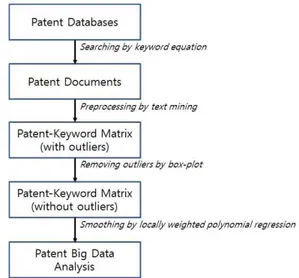
이용하여 주어진 특허 빅 데이터에 포함된 노이즈의 가능성을 확인하고 처리하게 된다. 그림 4는 효율적인 특허 빅데이터의 분석을 위하여 본 논문에서 제안하는 절차를 나타내고 있다.
Fig. 4. Proposed process for Patent Big Data Analysis
선정된 기술분야의 기술 키워드를 이용한 검색식을 이용 하여 전세계 특허 데이터베이스로부터 특허문서를 수집 한다. 텍스트 마이닝의 전처리 과정을 통하여 특허-키워 드 행렬을 구축한다. 다음으로 상자그림을 이용하여 이 상치를 제거한 특허-키워드 행렬을 만들고 이를 이용하 여 평활모형을 적용하여 최종적으로 특허 빅데이터의 다 양한 분석을 가능하게 한다. 본 논문은 다음의 절차에 의 하여 본격적인 특허 빅데이터의 분석에 앞서 빅데이터에 포함된 이상치와 노이즈를 처리하여 보다 효율적인 특허 빅데이터의 분석을 가능하게 한다.
Step1) Collecting patent documents related to target technology
Step2) Preprocessing retrieved patents for structured data
Step3) Smoothing structured patent data for statistical analysis
위와 같은 3단계의 절차를 통하여 특허 빅데이터의 효율 적인 분석이 이루어진다.
IV. Case Study
연구의 타당성을 보이기 위하여 본 연구에서는 제안방법을 3차원 프린팅 기술분석에 적용하였다. 특히 대표적인 3차원 프 린팅 회사인 ‘3D Systems'가 지금까지 출원, 등록한 특허 데이 터를 이용한 기술분석을 수행하였다. 관련된 기존 연구 결과를
이용하여 총 32개의 키워드를 선정하였다 [23-24]. 또한 전체 실험은 대표적인 데이터 분석언어인 R을 이용하였다 [25]. R 을 이용한 기술분석이 최근에 다양한 분야에서 연구되어 지고 있다 [24, 26-28]. 다음 표는 선정된 키워드와 해당 키워드의 전체 발생 빈도를 나타내고 있다.
Table 1. Selected Keyword and its Frequency
Keyword Freq. Keyword Freq.
Three_Dim 84 System 69
Deposition 41 Building 18
Laser 42 Phase 14
Selective 55 Support 29
Solid 63 Technique 20
Modeling 80 Chamber 14
Object 66 Stereolithography 14
Pour 32 Appareil 18
Material 11 Change 10
Composition 37 Manufacturing 19
Forming 56 Powder 15
Production 29 Thermal 10
Control 34 Fabrication 34
Imaging 44 Freeform 17
Sintering 28 Printing 23
Method 143 Rapid 14
각 키워드의 빈도는 1985년부터 2013년까지 출원, 등록된 전체 특허문서에 포함된 각 단어의 빈도를 타나내고 있다. 빅 데이터 분석에서 각 키워드는 변수(variable)의 역할을 하게 되 고 키워드들 간의 연관성을 분석하여 3D Systems 사의 기술분 석이 이루어진다. 먼저 개별 키워드에 대한 상자그림을 통하여 이상치의 존재 여부를 확인한다. 그림 5는 키워드 ‘Three dim’,
‘Deposition’, ‘Laser’, ‘Selective’, ‘Solid’, ‘Modeling’,
‘Object’, ‘Pour’ 에 대한 이상치 탐지 결과를 나타내고 있다.
Fig. 5. Outlier Detection Result: Three_Dim, Deposition, Laser, Selective, Solid, Modeling, Object, Pour
그림 5에서 X축은 각 키워드를 나타내고 Y축은 해당 키워드 의 빈도 값을 나타낸다. 'Three dim', 'Modeling', ‘Object', 그
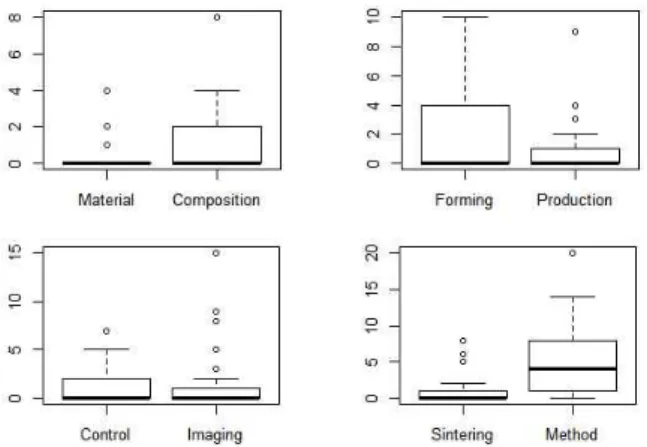
리고 ‘Pour' 은 1개의 이상치를 포함하고 있지만 'Deposition' 은 2개, 그리고 ’Laser', 'Selective', 'Solid' 키워드에는 4개의 이상치가 포함되어 있음을 알 수 있다. 이와 같은 그림을 통하 여 본격적인 특허분석에 앞서서 이상치와 노이즈에 대한 조정 이 가능하게 된다. 그림 6은 키워드 ‘Material’,
‘Composition’, ‘Forming’, ‘Production’, ‘Control’, ‘Imaging’,
‘Sintering’, 그리고 ‘Method’에 대한 상자그림 결과이다.
Fig. 6. Outlier Detection Result: Material, Composition, Forming, Production, Control, Imaging, Sintering, Method
‘Forming' 키워드는 이상치가 포함되어 있지 않고
’Composition', 'Control', 그리고 ‘Method'는 1개의 이상치를 가지고 있지만 나머지 키워드들은 상대적으로 많은 이상치가 포함됨을 확인할 수 있다. 그림 7은 키워드 ’System‘,
’Building‘, ’Phase‘, ’Support‘, ’Technique‘, ’Chamber‘,
’Stereolithography‘, 그리고 ’Appareil‘에 대한 이상치를 확인 하기위한 상자그림 결과를 나타내고 있다.
Fig. 7. Outlier Detection Result: System, Building, Phase, Support, Technique, Chamber, Stereolithography, Appareil
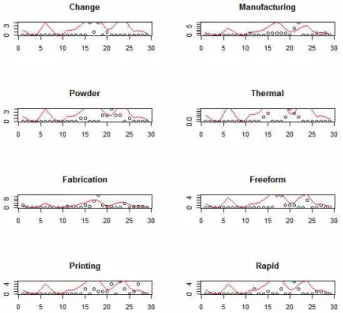
그림 7에서 나타나는 키워드들은 1~2개의 이상치 만을 포 함하고 있음을 알 수 있다. 마지막으로 그림 8은 키워드
‘Change’, ‘Manufacturing’, ‘Powder’, ‘Thermal’,
‘Fabrication’, ‘Freeform’, ‘Printing’, 그리고 ‘Rapid’에 대한 상자그림 결과를 보여 준다.
Fig. 8. Outlier Detection Result: Change, Manufacturing, Powder, Thermal, Fabrication, Freeform, Printing, Rapid
‘Powder'는 1개의 이상치를 포함하고 있지만 나머지 키워드 들은 2~3개의 이상치를 포함하고 있음을 알 수 있다. 3차원 프 린팅 기술에 대한 특허 빅 데이터에 추출된 32개 키워드에 포 함된 이상치를 확인해 본 결과 대부분의 키워드들에서 다수의 이상치를 포함하고 있음을 알 수 있었다. 그러므로 특허 빅 데 이터의 본격적인 분석에 앞서 노이즈 제거가 필요함을 알 수 있었다.
상자그림을 이용한 이상치 탐지와 함께 본 논문에서 제안하 는 또 하나의 노이즈 제거방법은 빅 데이터 평활이다. 다음 그 림은 키워드 ‘Three dim’, ‘Deposition’, ‘Laser’, ‘Selective’,
‘Solid’, ‘Modeling’, ‘Object’, ‘Pour’ 에 대한 평활화 결과를 나 타내고 있다.
Fig. 9. Big Data Smoothing Result: Three_Dim, Deposition, Laser, Selective, Solid, Modeling, Object, Pour
그림 9에서 X축은 시간(연도)을 나타내고 Y축은 각 연도에 해당 키워드가 발생된 빈도 값을 나타낸다. 상자그림에서 확인 된 이상치가 평활화 결과에도 나타나고 있음을 알 수 있다. 앞 의 상자그림에서 극단적인 이상치를 가지고 있던 키워드
‘Laser'는 평화화 결과에서도 전체적인 평활 곡선에서 많이 벗
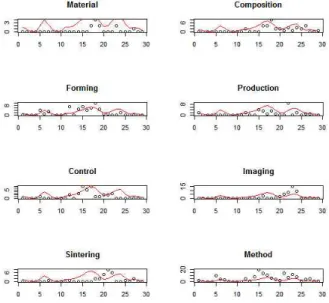
어난 위치에서 확인할 수 있다. 다음 그림은 키워드
‘Material’, ‘Composition’, ‘Forming’, ‘Production’, ‘Control’,
‘Imaging’, ‘Sintering’, 그리고 ‘Method’에 대한 평활화 곡선의 시각화 결과를 나타내고 있다.
Fig. 10. Big Data Smoothing Result: Material, Composition, Forming, Production, Control, Imaging,
Sintering, Method
앞의 상자그림과는 달리 키워드 ‘Forming'과 ’Method'에서 평활 곡선에서 벗어나는 다수의 점을 확인 할 수 있다. 이는 두 변수의 분산이 다른 키워드에 비해 크기 때문이다. 그림 5의 결 과를 보면 이들 키워드에 대한 상자그림이 다른 것들에 비해 길게 퍼져 있음을 알 수 있다. 그림 10는 키워드 ’System‘,
’Building‘, ’Phase‘, ’Support‘, ’Technique‘, ’Chamber‘,
’Stereolithography‘, 그리고 ’Appareil‘에 대한 평화화 결과를 나타내고 있다.
Fig. 11. Big Data Smoothing Result: System, Building, Phase, Support, Technique, Chamber, Stereolithography,
Appareil
앞의 상자그림 결과와는 다르게 키워드 ‘Appareil’에서 평화 곡선에서 벗어난 많은 점들이 나타나고 있음을 알 수 있다. 하 지만 상자그림에서 이 키워드는 별다른 이상치를 보이지 않았 다. 그러므로 노이즈 제거를 위한 상자그림과 평활화의 결과가 항상 일치하지는 않음을 알 수 있었다. 따라서 수집된 특허 빅 데이터의 노이즈를 제거하기 위해서는 어느 한가지 방법에만 의존하지 말고 2가지 방법을 함께 고려할 때 더 효과적임을 확 인할 수 있었다. 마지막으로 다음 그림은 키워드 ‘Change’,
‘Manufacturing’, ‘Powder’, ‘Thermal’, ‘Fabrication’,
‘Freeform’, ‘Printing’, 그리고 ‘Rapid’에 대한 평활화 결과를 보여 주고 있다.
Fig. 12. Big Data Smoothing Result: Change, Manufacturing, Powder, Thermal, Fabrication, Freeform,
Printing, Rapid
다른 키워드의 평활화 결과에 비해 이 그림에서 나타난 키워 드들은 더 많은 점들이 평활곡선에 많이 벗어나고 있음을 알 수 있었다. 마지막으로 노이즈를 제거하기 전과 제거 후의 분석 결과의 성능을 평가하기 위하여 다음의 모형에 대한 회귀분석 을 수행하였다.
P r (1)
반응변수는 'System' 키워드로 하고 설명변수는 3차원 (ThreeDim)과 프린팅(Printing) 키워드로 하였다. 첫 번째 회 귀분석은 노이즈를 제거하지 않고(with noise) 수행했고, 두 번 째는 노이즈를 제거하고(without noise) 수행하였다. 다음 표는 두 회귀분석 결과에 대한 성능 평가 결과를 나타내고 있다.
Table 2. Performance comparison of regression result Measurement With noise Without noise
MAR 1.9539 1.1335
SE of b1 0.1783 0.1328
SE of b2 0.4137 0.2903
R2 0.2744 0.5490
절대잔차평균(MAR)은 노이즈를 제거하기 전에 비해 제거 후 많이 감소하고 있음을 알 수 있다. 또한 3차원(b1)과 프린팅 (b2) 변수의 회귀계수들에 대한 표준오차(SE) 값들도 모두 노 이즈를 제거한 후의 결과가 더 작게 나왔다. 모형의 설명력을 나타내는 결정계수(coefficient of determination, R2) 노이즈 를 제고하고 난 후에 2배의 설명력 향상을 나타내고 있다. 따라 서 특허 빅 데이터 분석에서 본격적인 기술분석에 앞서 수집된 데이터에 포함된 노이즈의 제거가 필요함을 확인할 수 있었다.
V. Conclusions
본 논문에서는 특허 빅 데이터에 포함된 노이즈를 제거하기 위하여 상자그림과 평활 곡선의 사용에 대하여 연구하였다. 최 근 빅 데이터 분석에 의한 의사결정이 사회 각 분야에서 활발 히 이루어지고 있지만 초기 전처리에서 노이즈 처리에 대한 연 구는 많지 않은 실정이다. 본 연구에서는 빅 데이터 평활과 상 자그림을 통하여 이상치의 존재를 확인하고 제거하여 결과적으 로 빅 데이터 속에 포함된 노이즈를 제거하기 위해 노력하였다.
특히 특허 빅 데이터를 이용한 기술분석에 적용하여 회귀모형 의 성능평가를 통해 특허 빅 데이터 분야에서도 노이즈제거의 필요성을 확인 할 수 있었다. 향후 통계학에서 제공하는 다양한 평활화 모형과 이상치 판정 기준을 이용하여 보다 향상된 노이 즈 제거 방법론에 대한 연구가 진행되어야 할 것이다.
REFERENCES
[1] J. J. Berman, Principles of Big Data, Morgan Kaufmann, 2013.
[2] K. Krishnan, Data Warehousing in the Age of Big Data, Morgan Kaufmann, 2013.
[3] B. Chun, S. Lee, “A Study on Big Data Processing Mechanism & Applicability”, International Journal of Software Engineering and Its Applications, Vol. 8, No.
8, pp. 73-82, 2014.
[4] S. Ha, S. Lee, K. Lee, “Standardization Requirements
Analysis on Big Data in Public Sector based on Potential Business Models”, International Journal of Software Engineering and Its Applications, Vol. 8, No. 11, pp.
165-172, 2014.
[5] S. Jeon, B. Hong, J. Kwon, Y. Kwak, S. Song, “Redundant Data Removal Technique for Efficient Big Data Search Processing”, International Journal of Software Engineering and Its Applications, Vol. 7, No. 4, pp.
427-436, 2014.
[6] M. Riondato, Sampling-based Randomized Algorithms for Big Data Analytics, PhD dissertation in the Department of Computer Science at Brown University, 2014.
[7] J. Lu, D. LiBias, “Correction in a Small Sample from Big Data”, IEEE Transactions on Knowledge and Data Engineering, Vol. 25, No. 11, pp. 2658-2663, 2013.
[8] A. T. Roper, S. W. Cunningham, A. L. Porter, T. W. Mason, F. A. Rossini, J. Banks, Forecasting and Management of Technology, John Wiley & Sons, 2011.
[9] D. Hunt, L. Nguyen, M. Rodgers, Patent Searching Tools
& Techniques, Wiley, 2007.
[10] J. Han, M. Kamber, J. Pei, Data Mining: Concepts and Techniques, Third Edition, Waltham, MA, Morgan Kaufmann, 2012.
[11] WIPSON, WIPS Corporation, http://www.wipson.com, 2016.
[12] USPTO, The United States Patent and Trademark Office, http://www.uspto.gov, 2016.
[13] KIPRIS, Korea Intellectual Property Rights Information Service, www.kipris.or.kr, 2016.
[14] I. Feinerer, A Text Mining Framework in R and Its Applications, Dissertation, Department of Statistics and Mathematics, Vienna University of Economics and Business Administration, 2008.
[15] I. Feinerer, K. Hornik, D. Meyer, “Text mining infrastructure in R”, Journal of Statistical Software, Vol.
25, No. 5, pp. 1-54, 2008.
[16] I. Feinerer, K. Hornik, Package ‘tm’ Ver. 0.6, Text Mining Package, CRAN of R project, 2016.
[17] S. Jun, S. Park, D. Jang, “Technology Forecasting using Matrix Map and Patent Clustering”, Industrial Management & Data Systems, Vol. 112, Iss. 5, pp.
786-807, 2012.
[18] B. L. Bowerman, R. T. O’Connell, A. B. Koehler, Forecasting, Time Series, and Regression, An Applied Approach, Independence, KY, Brooks/Cole, 2005.
[19] W. S. Cleveland, “LOWESS: A program for smoothing scatterplots by robust locally weighted regression”, The
American Statistician, Vol. 35, No. 1, pp. 54, 1981.
[20] D. Ruppert, M. P. Wand, “Multivariate locally weighted least squares regression”, The annals of statistics, pp.
1346-1370, 1994.
[21] G. Guo, Y. Fu, C. R. Dyer, T. S. Huang, “Image-based human age estimation by manifold learning and locally adjusted robust regression”, IEEE Transactions on Image Processing, Vol. 17, No. 7, pp. 1178-1188, 2008.
[22] M. Akritas, Probability and Statistics with R for Engineers and Scientists, Boston, Pearson, 2016.
[23] J. Choi, S. Jun, “Bayesian Regression Modeling for Patent Keyword Analysis”, Journal of The Korea Society of Computer and Information, Vol. 21 No. 1, pp.
125-129, 2016.
[24] S. Park, J. Kim, D. Jang, H. Lee, S. Jun, “Methodology of Technological Evolution for Three-dimensional Printing”, Industrial Management & Data Systems, Vol.
116, No. 1, pp. 122-146, 2016.
[25] R Development Core Team, R: A language and environment for statistical computing, R Foundation for Statistical Computing, Vienna, Austria, http://www.R-project.org, 2016.
[26] J. Choi, S. Jun, “A Technology Analysis Model using Dynamic Time Warping”, Journal of the Korea Society of Computer and Information, Vol. 20, No. 5, 113-120, 2015.
[27] S. Jun, S. Park, D. Jang, “Technology Forecasting using Matrix Map and Patent Clustering”, Industrial Management & Data Systems, Vol. 112, Iss. 5, pp.
786-807, 2012.
[28] S. Lee, S. Jun, “Key IPC Codes Extraction Using Classification and Regression Tree Structure“, Advances in Intelligent Systems and Computing, Vol.
271, pp 101-109, 2014.
Authors
JunHyeog Choi received a B.S. degree in Computer Science from Kyunggi University, Korea in 1990, a M.S. and a Ph.D. degree in Computer Science from Inha University, Korea in 1995 and 2000 respectively,
He also received a MBA and Ph.D. degree in Management of Technology from Yonsei University, Korea, in 2003 and 2013 respectively. He worked as a invited scholar in Software research center, at ETRI.
He is currently a professor in the Department of Secretarial Management, Kimpo College. His Research interests include Patent Analysis, Management of Technology, and Technology forecasting and IoT.
Sunghae Jun is Professor in the Department of Statistics, Cheongju University, Chungbuk, Korea. He received B.S., M.S., and PhD degrees from Department of Statistics, Inha University, Incheon, Korea in 1993, 1996, and 2001, respectively.
He also received PhD degree from Department of Computer Science, Sogang University, Seoul, Korea in 2007, and PhD from Information Management Engineering from Korea University, Seoul, Korea in 2013. He was visiting scholar in Department of Statistics, Oklahoma State University, Stillwater, Oklahoma, USA from 2009 to 2010. His current research interests include big data learning and technology forecasting.