Statistical Optimization for Production of Carboxymethylcellulase from Rice Hulls by a Newly Isolated Marine Microorganism Bacillus licheniformis LBH-52 Using Response Surface Method
Hye-Jin Kim
1,2, Wa Gao
1,2, Chung-Han Chung
2,3and Jin-Woo Lee
2,3*
1
Department of Medical Bioscience, Graduate School of Donga-A University, Busan 604-714, Korea
2
BK21 Bio-Silver Program of Dong-A University, Busan 604-714, Korea
3
Department of Biotechnology, College of Natural Resources and Life Science, Dong-A University, Busan 604-714, Korea
Received May 21, 2011 /Revised July 4, 2011 /Accepted July 5, 2011A microorganism utilizing rice hulls as a substrate for the production of carboxymethylcellulase (CMCase) was isolated from seawater and identified as Bacillus lincheniformis by analyses of its 16S rDNA sequences. The optimal carbon and nitrogen sources for production of CMCase were found to be rice hulls and ammonium nitrate. The optimal conditions for cell growth and the production of CMCase by B. lincheniformis LBH-52 were investigated using the response surface method (RSM). The analysis of variance (ANOVA) of results from central composite design (CCD) indicated that a highly significant factor (“probe>F” less than 0.0001) for cell growth was rice hulls, whereas those for pro- duction of CMCase were rice hulls and initial pH of the medium. The optimal conditions of rice hulls, ammonium nitrate, initial pH, and temperature for cell growth extracted by Design Expert Software were 48.7 g/l, 1.8 g/l, 6.6, and 35.7℃, respectively, whereas those for the production of CMCase were 43.2 g/l, 1.1 g/l, 6.8, and 35.7℃. The maximal production of CMCase by B. lincheniformis LBH-52 from rice hulls under optimized conditions was 79.6 U/ml in a 7 l bioreactor. In this study, rice hulls and ammonium nitrate were developed to be substrates for the production of CMCase by a newly isolated marine microorganism, and the time for production of CMCase was reduced to 3 days using a bacte- rial strain with submerged fermentation.
Key words : Bacillus licheniformis, marine microorganism, carboxymethylcellulase, rice hulls, optimization, response surface method
*Corresponding author
*Tel:+82-51-200-7593, Fax:+82-51-200-7505
*E-mail : [email protected]
Introduction
Cellulose can be widely used to produce sustainable bio- mass and bioenergy to replace depleting fossil fuels [38].
Rice hulls are the main byproducts of the paddy process and accounts for 20-25% of the whole weight. More than 113 million metric tons of rice hulls are generated each year throughout the world. Due to its widespread availability and relatively low cost, rice hulls have the potential to serve as the feed stock for the production of fuel ethanol [33]. Three different types of cellulases, endoglucanases (EC 3.2.1.4), cel- lobiohydrolases (EC 3.2.1.91), and β-glucosidases (EC 3.2.1.21), are considered to degrade crystalline cellulose to fermentable sugars [10]. Many efforts have been made to transform cellulosic biomass into fermentable sugars using cellulases [6,19].
Recently, endoglucanases (carboxymethylcellulases) have
been applied in the textile and detergent industries. In the textile industry, endoglucanases are used for removing fuzz from the surface of cellulosic fibers, and enhancing the soft- ness and the brightness of cotton fabric [9]. They are also used to facilitate the removal of soil by swelling the cotton fabric in the detergent industry. Cellulases are also used in improving nutritional quality and digestibility of animal feeds, in processing of fruit juices, and in baking, while de-inking of paper is yet another emerging application [25].
Enzymes produced by marine microorganisms can pro- vide numerous advantages over traditional enzymes due to severe conditions and wide range of environments [20,31].
Hyperthermophilic bacteria have been isolated from marine
sediments for biomass conversion of hemicellulose such as
xylans and mannans [4]. A ĸ-carrageenase produced by a
halo-tolerant marine bacterium was purified and charac-
terized [16]. In this study, a microorganism utilizing rice
hulls as a substrate for production of carboxymethylcellulase
(CMCase) was isolated from seawater and the optimal con-
ditions for the production of CMCase by this marine micro-
organism were investigated using response surface method- ology (RSM).
Materials and Methods
Isolation of marine microorganisms producing car- boxymethylcellulase
To isolate microorganism producing cellulases, seawater from the Kyungsang Province of Korea was suspended with 0.85% (w/v) NaCl. The suspension was then cultivated on marine agar plates at 30℃ for 3 days under aerobic conditions. Isolated cultures were prepared by transferring cells from the agar plates to 200 ml of medium in 500 ml Erlenmeyer flasks. The medium used for the production of CMCase by a carboxymethylcellulase (CMC) hydrolyzing isolated microorganism contained the following compo- nents: 20.0 g/l CMC, 2.5 g/l yeast extract, 5.0 g/l K
2HPO
4, 1.0 g/l NaCl, 0.2 g/l MgSO
4·7H
2O, and 0.6 g/l (NH
4)
2SO
4. The resulting cultures were incubated at 30℃ for 3 days un- der aerobic conditions. Based on the productivity of CMCase, one microorganism was selected for production of CMCase and identified by sequencing of 16S rDNA nucleotides.
Identification of the isolated microorganism
For the nucleotide sequence analysis, bacterial genomic DNA was extracted and purified using a Wizard Genomic DNA Prep. Kit (Promega Co., Madison, USA). Two primers annealing at the 5’ and 3’ ends of the 16S rDNA were 5’-AGAGTTTGATCCTGGCTCAG-3’ (positions 8 to 27, E.
coli 16S rDNA numbering) and 5’-AAGGAGGTGATCC AGCCGCA-3’ (positions 1541 to 1522), respectively [39].
PCR amplification was performed as described in the pre- vious report [18]. The PCR reaction was run for 35 cycles in a DNA thermal cycler (Model No. 9700, Perkin-Elmer Co.
Wellesley, USA). The following thermal profile was used for the PCR: denaturation at 94
oC for 1 min, primer annealing at 60
oC for 1 min, and extension at 72
oC for 2 min. The final cycle included extension at 72
oC for 10 min to ensure full extension of the products. Amplified PCR products were then analyzed in a 1.0% (w/v) agarose gel, excised from the gel, and purified. Purified products were cloned into a pGEM-T Easy vector (Promega Co., Madison, USA) and sub- sequently sequenced using an ALF Red automated DNA se- quencer (Pharmacia, Sweden). The 16S rDNA sequence of the isolate was aligned with those in the GenBank database.
Multiple alignments of sequences and calculations of levels of sequence similarity were performed by using CLUSTAL W [37]. Neighbor-joining phylogenetic analysis was carried out with a MEGA program [22].
Experimental design and optimization for pro- duction of CMCase
The rice bran (X
1), ammonium nitrate (X
2), initial pH of the medium (X
3), and temperature (X
4) were chosen as in- dependent variables and cell growth (Y
1, g/l) and CMCase (Y
2, U/ml) were used as dependent output variables for re- sponse surface optimization. The total number of experi- ments was 30 (=2
k+2k+6), where k is the number of in- dependent variables [34]. The interrelationships of variables were determined by fitting the second degree polynomial equation to data obtained from 30 experiments using mean values of the triplicates of each experiment conducted trice at different occasions. The maximum values of cell growth and production of CMCase were taken as the responses of the design experiment. Statistical analysis of the model was performed to evaluate the analysis of variance (ANOVA).
A multiple regression analysis of the data was carried out with the statistical software, Design-Expert (Version 8.0, Stat-Ease Inc., Minneapolis, USA) and the second order poly- nomial equation (1) that defines predicted response (Y) in terms of the independent variables (X
1, X
2, X
3and X
4) was obtained:
Y = A
0+ A
1X
1+ A
2X
2+ A
3X
3+ A
4X
4+ A
12X
1X
2+ A
13X
1X
3+ A
14X
1X
4+ A
23X
2X
3+ A
24X
2X
4+ A
34X
3X
4+ A
11X
121 + A
22X
22+ A
33X
32+ A
44X
42(1) Where X
1, X
2, X
3and X
4are input variables; A
0is constant;
A
1, A
2, A
3,and A
4are linear coefficients; A
12, A
13, A
14, A
23, A
24, and A
34are cross-product coefficients; A
11, A
22, A
33, and A
44are quadratic coefficients. Combinations of factors (such as X
1X
2) represent an interaction between the individual fac- tors in that term. Then the response is a function of the levels of factors.
Batch fermentation for production of CMCase
Batch fermentations for the production of CMCase by an
isolated microorganism were performed in 7 l bioreactors
(Ko-Biotech Co., Korea). The working volume of 7 l bio-
reactors was 5 l, and inoculum size of batch fermentation
was 5% (v/v). Agitation was provided by three six-flat-blade
impellers in the 7 l bioreactor.
Scanning electron microscopic observations
Samples were fixed by 3.0% (v/v) glutaraldehyde in 0.1 M cacodylate buffer (pH 7.2) with 0.1% (w/v) MgSO
4at 4℃
for 30 min. Fixed samples were post-fixed by 1.0% (v/v) osmium tetroxide in 0.2 M cacodylate buffer (pH 7.4) at 4℃
for 24 hr and serially dehydrated in ethyl alcohol. After crit- ical-point drying, they were coated with gold using a sput- ter-coating system (sputter-coater 5150A, Edward High Vacuum International, Crawley, England) and then exam- ined with a scanning electron microscope (JSM-35CF, JEOL, Japan) which operated with an accelerating voltage of 5 KV.
Images were digitized and stored in tagged image file format in the microscope computer.
Analytical methods
Dry cells weight was measured by directly weighing the biomass after drying to a constant weight at 100-105℃ after collection of cells by centrifugation at 12,000× g for 10 min.
CMCase activity was measured by mixing 0.1 ml of enzyme solution with 0.1 ml of 10.0 g/l CMC in 10 mM sodium phosphate buffer, pH 6.5 at 50℃ for 20 min. The reaction was stopped by adding 3,5-dinitrosalicylic acid (DNS) reagent. The mixture was boiled for 10 min, cooled in ice and its optical density at 550 nm was determined [28].
Glucose (Sigma-Aldrich, UK) was used to prepare a calibra- tion curve. One unit of enzyme activity was defined as the amount of enzyme that released 1 μmol of glucose per min at 50℃.
Results and Discussion Identification of the isolated microorganism
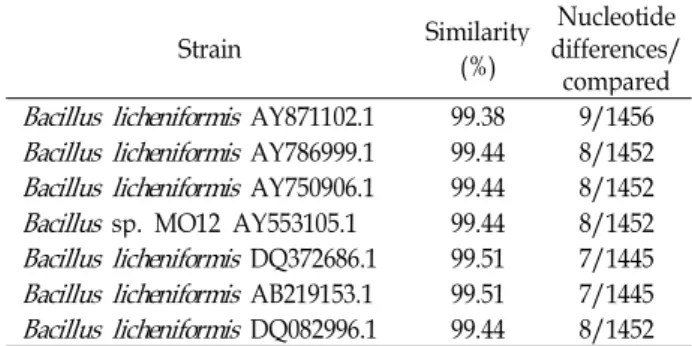
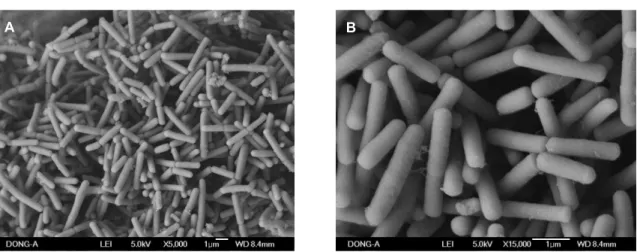
A microorganism hydrolyzing carboxymethylcellulose (CMC) was isolated from seawater in Kyungsang Province in Korea and designated as strain LBH-52. The phylogenetic analysis of strain LBH-52 using its 16S rDNA nucleotide se- quence data showed that this strain had more than 99% ho- mology with Bacillus lincheniformis strians, as shown in Table 1. Based on the evolution distance and the phylogenetic tree resulting from 16S rDNA sequencing and the neigh- bour-joining method [7], this strain was identified as a Bacillus lincheniformis and designated as B. lincheniformis LBH-52, as shown in Fig. 1. The scanning electron micro- scopic observations show that B. lincheniformis LBH-52 is a
Table 1. Similarity of the isolated microorganism with
Bacillus
species based on the 16S rDNA sequencesStrain Similarity
(%)
Nucleotide differences/
compared
Bacillus licheniformis
AY871102.1 99.38 9/1456Bacillus licheniformis
AY786999.1 99.44 8/1452Bacillus licheniformis
AY750906.1 99.44 8/1452Bacillus
sp. MO12 AY553105.1 99.44 8/1452Bacillus licheniformis
DQ372686.1 99.51 7/1445Bacillus licheniformis
AB219153.1 99.51 7/1445Bacillus licheniformis
DQ082996.1 99.44 8/1452Fig. 1. Neighbour-joining tree based on 16S rDNA sequences of
B. licheniformis
complex. Numbers at the nodes in- dicate the levels of bootstrap support based on a neigh- bour-joining analysis of 1,000 re-sampled dataset. Scale bar indicates 0.1 nucleotide substitution per nucleotide position.rod-shaped bacterium, as shown in Fig. 2. B. licheniformis forms spores and produces various extracellular enzymes that are associated with the cycling of nutrients in nature [5,11].
Effects of carbon and nitrogen sources on pro- duction of CMCase
The effects of carbon and nitrogen sources on cell growth
and the production of the CMCase by B. lincheniformis
LBH-52 were investigated. Carbon sources tested in this
A B
Fig. 2. Scanning electron microscopic observations of
B. licheniformis
LBH-52 (A, ×5,000 and B, ×15,000).0 1 2 3 4
lt Ma tra ex
ct ne pto Pe
pto Try
ne xtr t e as Ye
t ac A.C
A.N
co Glu ru seF se Ma cto seS lto ro uc Ric se ra e b
n e h Ric
ull Dry cells weight (g/L)
itrN
en og ou s es rc
bo Car ou n s s rce
A
0 20 40 60 80 100
lt Ma tra ex
ct ne pto Pe
pto Try
ne xtr t e as Ye
t ac A.C
A.N
co Glu ru seF se Ma cto seS lto ro uc Ric se ra e b
n e h Ric
ull CMCase (U/m
L)
itrN
en og ou s es rc
bo Car ou n s s rce
B
Fig. 3. Effect of carbon and nitrogen sources on cell growth (A) and production of CMCase by
B. licheniformis
LBH-52 (B) (AC, ammonium chloride and AN, ammonium nitrate).study were 20.0 g/l glucose, fructose, maltose, sucrose, rice bran, and rice hull. Nitrogen sources were 2.5 g/l malt ex- tract, peptone, tryptone, yeast extract, ammonium sulfate, and ammonium nitrate. The best combination of carbon and nitrogen source for cell growth was sucrose and yeast ex- tract, whereas that for production of CMCase was maltose and ammonium chloride, as shown in Fig. 3. Production of CMCase from 20.0 g/l maltose and 2.5 g/l ammonium chlor- ide was 60.6 U/ml, whereas that from 20.0 g/l rice hulls and 2.5 g/l ammonium nitrate was 50.4 U/ml. Based on their cost and availability as well as productivity of CMCase, rice hulls and ammonium nitrate were chosen as carbon and nitrogen sources for next examination to find out the optimal conditions for the production of CMCase by B. licheniformis LBH-52.
The best combination of carbon and nitrogen sources for
the production of CMCase produced by B. amyloliquefaciens DL-3 were rice hulls and peptone, whereas that by B. subtilis subsp. subtilis A-53, which was isolated form seawater, were rice bran and yeast extract [23]. The composition of the rice hulls used in this study was as follows: 47.0% fiber, 0.2%
crude lipid, 2.4% crude protein, 14.1% ash, and 7.1% water
[13]. Rice bran was reported to be the best carbon source
for the production of CMCase by Bacillus sp. CH43 and
HR68 [27]. A major carbon source for the production of fun-
gal CMCases by Aspergillus and Trichoderma species was re-
ported to be wheat bran [12,24]. Wheat bran was also found
to be the best substrate for the production of an extracellular
and thermostable xylanase by B. lichemiformis in solid-state
fermentation (SSF) [2]. All strains investigated to date for
production of cellulases are inducible by cellulose, lactose
or sophorose, and repressible by glucose, which are reasons
Rice hull (g/L)
20 30 40 50 60
DCW (g/L)
0.0 0.2 0.4 0.6 0.8
Ammonium nitrate (g/L) 0.5 1.0 1.5 2.0 2.5
Initial pH
5 6 7 8 9
Temperature (OC)
25 30 35 40 45
CMCase (U/mL)
0 20 40 60 80 100
Fig. 4. Effects of rice hulls, ammonium nitrate, initial pH, and temperature on cell growth and production of CMCase by
B. licheniformis
LBH-52 within single-factor experiments (●, pH and ○, CMCase).why the best carbon source for the production of cellulases by bacterial and fungal microorganisms is rice hulls, rice bran or wheat bran [8,15]. Induction, synthesis, and secretion of the β-glucanase appear to be closely associated [32].
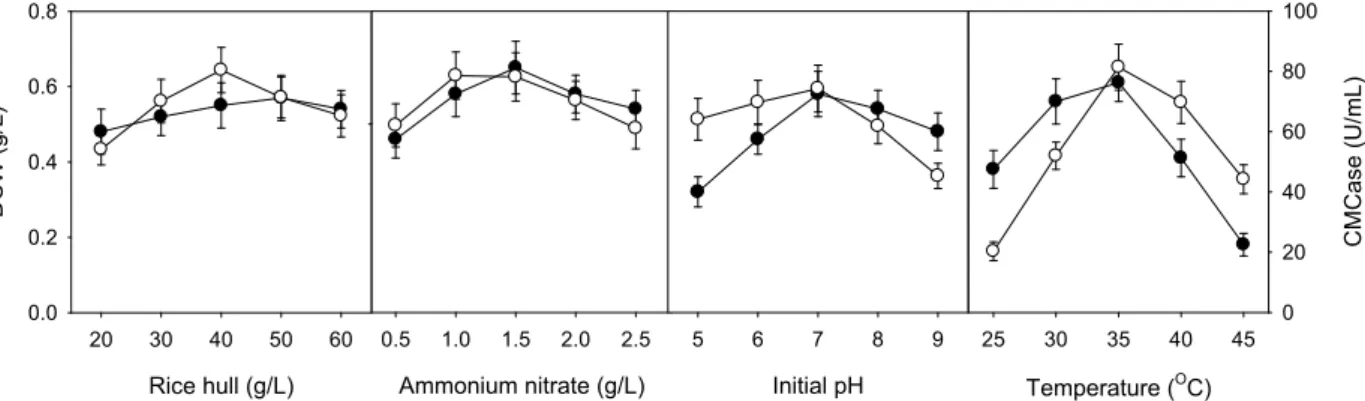
Optimization of rice hulls, ammonium nitrate, ini- tial pH, and temperature for production of CMCase using ‘one-factor-at-a-time’ experiments
Initial pH of the medium and temperature as well as car- bon and nitrogen sources are also very essential factors to cell growth and production of CMCase. Optimal conditions of rice hulls, ammonium nitrate, initial pH, and temperature were investigated using ‘one-factor-at-a time’ experiments.
Composition of basic medium and culture conditions for
‘one-factor-at a time’ experiment were 50.0 g/l rice hulls, 1.5 g/l ammonium nitrate, initial pH of 6.8, and temperature of 30℃. The optimal conditions of rice hulls, ammonium ni- trate, initial pH, and temperature for cell growth of B. lichen- iformis LBH-52 were 50 g/l, 1.5 g/l, 7.0, and 35℃, re- spectively, whereas those for production of CMCase were 40 g/l, 1.0 g/l, 7.0, and 35℃, as shown in Fig. 4.
Optimization of rice hulls, ammonium nitrate, ini- tial pH, and temperature for production of CMCase using response surface method
The optimal conditions of rice hulls, ammonium nitrate, initial pH, and temperature on cell growth and the productio n of CMCase by B. licheniformis LBH-52 were investigated using the response surface methodology (RSM). The minimu m and maximum ranges of variables and the full experiment al plan with respect to their actual and coded values were shown in Table 2. The results of central composite design (CCD) experiments consisted of experimental and
Table 2. Process variables used central composite design (CCD) with actual factor levels corresponding to coded factor levels
Variables Symbol Coded levels
-1 0 1
Rice hulls (g/l) X1 20.0 35.0 75.0
Ammonium nitrate (g/l) X2 1.0 1.5 2.0
Initial pH X3 6.0 6.5 7.0
Temperature (℃) X4 30 35 40
predicted values of four independent variables, as shown in Table 3. Cell growth, measured as dry cells weight (DCW), and production of CMCase from 30 different con- ditions ranged from 0.55 to 0.66 g/l and from 60.2 to 76.6 U/ml.
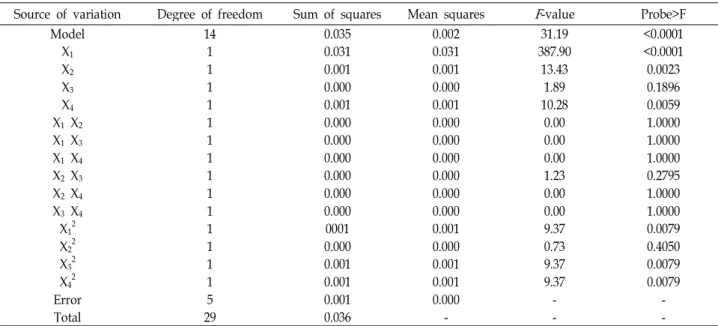
The analysis of variance (ANOVA) of the design for cell growth of B. licheniformis LBH-52 indicated that the model F-value was 31.39, which implied that this model was sig- nificant, as shown in Table 4. There is only a 0.01% chance that a “Model F-value” this large could occur due to noise.
The ANOVA also indicated that the model term of X
1was highly significant (“probe>F” less than 0.0001) and those of X
2, X
4, X
12, X
32, and X
42were significant (“probe>F” less than 0.0500) for cell growth. However, the interactive effects of X
1X
2, X
1X
3, X
1X
4, X
2X
3, X
2X
4, and X
3X
4were not significant.
The regression equation obtained from ANOVA indicated
that the multiple correlation coefficient of R
2was 0.9668. The
model can explain 96.68% variation in the response. The val-
ue of the adjusted determination coefficient (Adj. R
2=0.9358)
was very high to advocate for a high significance of this
model [17]. The predicted determination of coefficient of
0.8910 was in reasonable agreement with the Adj. R
2of
0.9358. From the statistical results obtained, it was shown
that the above model was adequate to predict the cell growth
Table 3. Central composite design and determined response values
Run X1
(g/l) X2
(g/l) X3 X4
(℃) Experimental Predicted
Y1 (g/l) Y2 (U/ml) Y1 (g/l) Y2 (U/ml)
1 50 2.0 7.0 40 0.64 68.2 0.64 68.9
2 35 1.5 6.5 35 0.61 75.4 0.61 65.3
3 35 2.5 6.5 35 0.61 68.5 0.62 67.1
4 50 1.0 7.0 40 0.62 69.1 0.62 69.8
5 35 1.5 6.5 35 0.60 76.6 0.61 65.3
6 20 2.0 6.0 40 0.56 60.2 0.55 60.9
7 20 1.0 7.0 40 0.55 64.1 0.55 64.7
8 35 1.5 5.5 35 0.58 66.5 0.59 65.1
9 35 1.5 6.5 35 0.62 74.2 0.61 75.3
10 35 1.5 6.5 35 0.63 74.4 0.61 75.3
11 20 2.0 6.0 30 0.57 61.7 0.57 62.3
12 50 1.0 6.0 30 0.63 67.5 0.63 68.2
13 20 1.0 7.0 30 0.56 65.5 0.56 66.1
14 65 1.5 6.5 35 0.66 70.6 0.66 69.2
15 20 1.0 6.0 40 0.55 61.1 0.55 61.7
16 35 1.5 6.5 35 0.61 75.8 0.61 75.3
17 35 1.5 6.5 45 0.57 63.7 0.58 62.4
18 50 1.0 7.0 30 0.63 70.5 0.63 71.1
19 50 2.0 7.0 30 0.65 69.6 0.65 70.3
20 20 1.0 6.0 30 0.56 62.5 0.56 63.1
21 35 0.5 6.5 35 0.59 70.0 0.59 68.8
22 20 2.0 7.0 40 0.57 63.2 0.56 63.8
23 35 1.5 6.5 25 0.60 66.5 0.60 65.2
24 35 1.5 6.5 35 0.60 75.2 0.61 65.3
25 5 1.5 6.5 35 0.51 60.3 0.52 59.1
26 20 2.0 7.0 30 0.58 64.7 0.58 65.3
27 35 1.5 7.5 35 0.59 72.3 0.60 71.1
28 50 1.0 6.0 40 0.62 66.1 0.62 66.8
29 50 2.0 6.0 40 0.63 65.2 0.63 65.9
30 50 2.0 6.0 30 0.64 66.6 0.64 67.3
Table 4. Parameter estimates and analysis of variance (ANOVA) of the design for cell growth of
B. licheniformis
LBH-10 Source of variation Degree of freedom Sum of squares Mean squaresF
-value Probe>FModel 14 0.035 0.002 31.19 <0.0001
X1 1 0.031 0.031 387.90 <0.0001
X2 1 0.001 0.001 13.43 0.0023
X3 1 0.000 0.000 1.89 0.1896
X4 1 0.001 0.001 10.28 0.0059
X1 X2 1 0.000 0.000 0.00 1.0000
X1 X3 1 0.000 0.000 0.00 1.0000
X1 X4 1 0.000 0.000 0.00 1.0000
X2 X3 1 0.000 0.000 1.23 0.2795
X2 X4 1 0.000 0.000 0.00 1.0000
X3 X4 1 0.000 0.000 0.00 1.0000
X12
1 0001 0.001 9.37 0.0079
X22 1 0.000 0.000 0.73 0.4050
X32 1 0.001 0.001 9.37 0.0079
X42 1 0.001 0.001 9.37 0.0079
Error 5 0.001 0.000 - -
Total 29 0.036 - - -
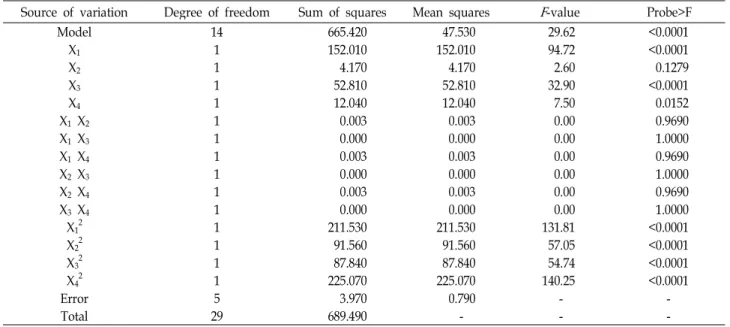
Table 5. Parameter estimates and analysis of variance (ANOVA) of the design for the production of CMCase by
B. licheniformis
LBH-10Source of variation Degree of freedom Sum of squares Mean squares
F
-value Probe>FModel 14 665.420 47.530 29.62 <0.0001
X1 1 152.010 152.010 94.72 <0.0001
X2 1 4.170 4.170 2.60 0.1279
X3 1 52.810 52.810 32.90 <0.0001
X4 1 12.040 12.040 7.50 0.0152
X1 X2 1 0.003 0.003 0.00 0.9690
X1 X3 1 0.000 0.000 0.00 1.0000
X1 X4 1 0.003 0.003 0.00 0.9690
X2 X3 1 0.000 0.000 0.00 1.0000
X2 X4 1 0.003 0.003 0.00 0.9690
X3 X4 1 0.000 0.000 0.00 1.0000
X12 1 211.530 211.530 131.81 <0.0001
X22 1 91.560 91.560 57.05 <0.0001
X32 1 87.840 87.840 54.74 <0.0001
X42 1 225.070 225.070 140.25 <0.0001
Error 5 3.970 0.790 - -
Total 29 689.490 - - -
of B. licheniformis LBH-52 within the range of variables studied. Multiple regression analysis of the experimental da- ta gave the following second-order polynomial equation in terms of coded factors (2) and the optimal conditions of rice hulls, ammonium nitrate, initial pH of the medium, and tem- perature for cell growth extracted by Design Expert Software were 48.7 g/l, 1.8 g/l, 6.6, and 35.7℃, respectively. The max- imum cell growth of 0.64 g/l was predicted by this model.
Y
1(cell growth)=0.610+0.036X
1+0.007X
2+0.003X
3-0.006X
4+0.03X
2X
3-0.005X
12-0.001X
22-0.005X
32-0.005X
42(2)
The ANOVA of the design for the production of CMCase by B. licheniformis LBH-52 indicated that the model F-value was 29.62, which also implied that this model was sig- nificant, as shown in Table 5. The ANOVA also indicated that the model terms of X
1, X
3, X
12, X
22, X
32and X
42were highly significant and that of X
4was significant for pro- duction of CMCase. The regression equation obtained from ANOVA indicated that the multiple correlation coefficient of R
2was 0.9651. The model can explain 96.51% variation in the response. The value of the adjusted determination co- efficient (Adj. R
2=0.9325) was very high to advocate for a high significance of this model. The predicted determination of coefficient of 0.8238 was in reasonable agreement with the Adj. R
2of 0.9325. From the statistical results obtained, it was shown that the above models were adequate to pre- dict the production of CMCase by B. licheniformis LBH-52
within the range of variables studied. Multiple regression analysis of the experimental data gave the following sec- ond-order polynomial equation in terms of coded factors (3) and The optimal conditions of rice hulls, ammonium nitrate, initial pH of the medium, and temperature for production of CMCase were 43.2 g/l, 1.1 g/l, 6.8, and 35.7℃, respectively. The maximum production of CMCase of 75.3 U/ml was predicted by this model.
Y
2(CMCase)=75.27+2.52X
1-0.42X
2+1.48X
3-0.71X
4-0.01X
1X
2-0.01X
1X
4-0.01X
2X
4-2.78X
12-1.83X
22-1.79X
32-2.86X
42(3)
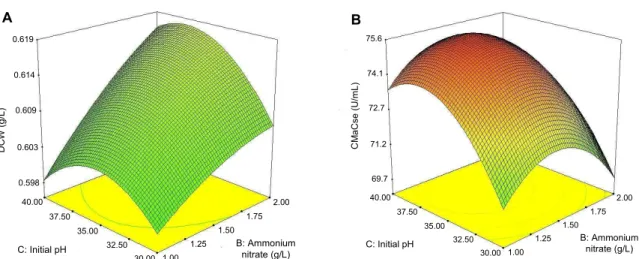
The three-dimensional (3D) response surface plots were
generated to investigate the interaction among variables and
to visualize the combined effects of those on the response
of cell growth and production of CMCase. When the effect
of two factors was plotted, the other two factors were set
at the coded value zero. This kind of graphical visualization
allows the relationships between the experimental levels of
each factor and the response to be investigated, and the type
of interactions between test variables to be determined,
which is necessary to establish the optimal conditions for
cell growth and production of CMCase [26]. In contrast to
the circular shapes, the elliptical nature of curves indicates
significant mutual interactions between variables. There was
found to be a more drastic interactive effect of ammonium
nitrate and initial pH on cell growth than production of
CMCase, as shown in Fig. 5.
DCW (g/L) 0.619
0.614
0.609
0.603
0.598
40.00 37.50
35.00 32.50
30.00 1.00 1.25
1.50 1.75
2.00
B: Ammonium nitrate (g/L) C: Initial pH
A
CMaCse(U/mL)
75.6
74.1
72.7
71.2
69.7
40.00 37.50
35.00 32.50
30.00 1.00 1.25
1.50 1.75
2.00
B: Ammonium nitrate (g/L) C: Initial pH
B
Fig. 5. 3D response surface displaying relative effect of two variables - ammonium nitrate and initial pH on cell growth (A) and production of CMCase by
B. licheniformis
LBH-52 (B).The optimal concentrations of rice bran and yeast extract for cell growth of B. subtilis subsp. subtilis A-53 were 10.0 and 2.5 g/l, respectively, whereas those for the production of CMCase were 50.0 and 1.0 g/l [23]. Like other production of CMCases by Bacillus species, optimal concentrations of carbon and nitrogen sources for cell growth of B. licheniformis LBH-52 were different from those for production of CMCase.
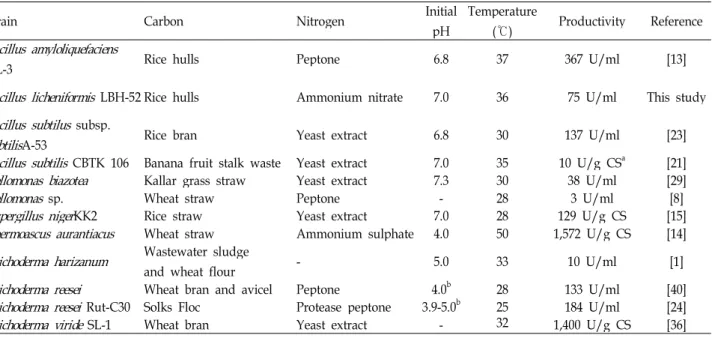
Optimal concentrations of carbon and nitrogen sources for cell growth seem to be generally higher than those for pro- duction of CMCase. The optimal initial pH of the medium and temperature for cell growth of B. amyloliquefaciens DL-3 were 7.2 and 32℃, whereas those for the production of CMCase were 6.8 and 37℃ [13], as shown in Table 6. The optimal initial pH and temperature for cell growth of B. sub- tilis subsp. subtilis A-53 was also different from those for the production of CMCase. Optimal initial pHs for the pro- duction of CMCases by bacterial and fungal microorganisms ranged from 4.0 to 7.3 [21,29]. Optimal temperatures for pro- duction of their CMCases ranged from 25 to 37℃, except for thermophilic microorganisms such as Thermoascus aur- antiacu, which optimal temperature for the production of CMCase is 50℃ [14]. Generally speaking, optimal initial pHs for the production of CMCases by bacterial strains are higher than those by fungal strains. The highest production of CMCase by B. lichemiformis LBH-52 was about 75.3 U/ml under optimized conditions in this study. Even though the productivity of the CMCase by B. lichemiformis LBH-52 was not higher than those by other reported microorganisms, a newly isolated B. lichemiformis LBH-52 can be used for mass production of CMCase for commercial applications due to
cost and availability of carbon and nitrogen sources.
Batch fermentation for production of CMCase
Batch cultures for the productions of CMCase by B. lichen- iformis LBH-52 were performed in 7 l bioreactors. An agi- tation speed and an aeration rate were 400 rpm and 1.0 vvm.
Concentrations of rice hulls and ammonium nitrate, initial pH, and temperature were 43.2 g/l, 1.1 g/l, 6.8, and 35.7℃, respectively. The pH of the culture rapidly decreased until 9 h after cultivation, and then steadily increased until around 6.9, as shown in Fig. 6. The concentration of the dis- solved oxygen in the medium dramatically decreased until 12 hr, and the production of cellulases by B. licheniformis LBH-52 started. Cell growth of B. licheniformis LBH-52 rap- idly increased in the first 12 hr of cultivation. The production of CMCase by B. licheniformis LBH-52 seemed to be parallel with cell growth. The maximal production of CMCase in a 7 l bioreactor for 72 hr under optimized conditions was 79.6 U/ml.
It normally takes 7 to 10 days to produce cellulases by fungal species in solid-state fermentation normally [15]. The times for batch cultures of submerged fermentation for the production of cellulases by bacterial species are shorter than those of solid-state fermentation by fungal ones [13,23]. In this study, it took 3 days to produce the CMCase by B. lichen- iformis LBH-52 in submerged fermentation. Reduced time for production of CMCase in a submerged fermentation can re- sult in increase in productivity and decrease in their pro- duction cost.
Enzymatic saccharification of cellulosic materials such as
Table 6. Comparison of optimal conditions for the production of various CMCases by bacterial and fungal microorganisms
Strain Carbon Nitrogen Initial
pH
Temperature
(℃) Productivity Reference
Bacillus amyloliquefaciens
DL-3 Rice hulls Peptone 6.8 37 367 U/ml [13]
Bacillus licheniformis
LBH-52 Rice hulls Ammonium nitrate 7.0 36 75 U/ml This studyBacillus subtilus
subsp.subtilis
A-53 Rice bran Yeast extract 6.8 30 137 U/ml [23]Bacillus subtilis
CBTK 106 Banana fruit stalk waste Yeast extract 7.0 35 10 U/g CSa [21]Cellomonas biazotea
Kallar grass straw Yeast extract 7.3 30 38 U/ml [29]Cellomonas
sp. Wheat straw Peptone - 28 3 U/ml [8]Aspergillus niger
KK2 Rice straw Yeast extract 7.0 28 129 U/g CS [15]Thermoascus aurantiacus
Wheat straw Ammonium sulphate 4.0 50 1,572 U/g CS [14]Trichoderma harizanum
Wastewater sludgeand wheat flour - 5.0 33 10 U/ml [1]
Trichoderma reesei
Wheat bran and avicel Peptone 4.0b 28 133 U/ml [40]Trichoderma reesei
Rut-C30 Solks Floc Protease peptone 3.9-5.0b 25 184 U/ml [24]Trichoderma viride
SL-1 Wheat bran Yeast extract - 32 1,400 U/g CS [36]a carbon source
b maintenance pH
Time (h)
0 12 24 36 48 60 72
pH
5.0 5.5 6.0 6.5 7.0 7.5 8.0
DO (%)
0 20 40 60 80 100
DCW (g/L)
0.0 0.2 0.4 0.6 0.8 1.0
CMCase (U/mL)
0 20 40 60 80 100 120
Fig. 6. A batch fermentation for the production of CMCase by
B. licheniformis
LBH-52 in a 7 l bioreactor (●, pH; ▲, DO; ■, DCW; and ○, CMCase)rice hulls has been performed by commercial cellulases, in which a major cellulase is CMCase [3,38]. A major constrain in enzymatic saccharification of cellulosic biomass for the production of fermentable sugars is low productivity and the cost of cellulases [35]. In this study, rice hulls and ammo- nium nitrate were developed to be substrates for the pro- duction of CMCase by a newly isolated B. licheniformis. Rice hulls are a byproduct from the rice processing industry and ammonium nitrate is one of the cheapest nitrogen sources.
The process developed in this study can reduce the cost for production of CMCase and solve a significant problem to the ecology and environment, which is mainly due to their
low digestibility, peculiar size, low bulk density, high ash contents, and abrasive characteristics. Reduced time for pro- duction of CMCase using bacterial strain with submerged fermentations results in increase in productivity of cellulases and decrease in their production cost. The next study will be focused on characterization of the CMCase produced by this strain with an expectation of distinctive features such as cold-adapted, halo-tolerant or acidophilic CMCase due to its living in severe conditions and wide ranges of environments.
Acknowledgement
This paper was financially supported by Dong-A University Research Fund.
References
1. Alam, M. Z., S. A. Muyibi, and R. Wahid. 2008. Statistical optimization of process conditions for cellulose production by liquid state bioconversion of domestic wastewater sludge.
Bioresource Technol.
99, 4709-4716.2. Archana, A. and T. Satyanarayana. 1997. Xylanase pro- duction by thermophilic
Bacillus licheniformis
A99 in sol- id-state fermentation.Enzym. Microb. Technol
. 21, 12-17.3. Ballesteros, M., J. M. Oliva, M. J. Negro, P. Manzannares, and I. Ballesteros. 2004. Ethanol from lignocellulosic materi- als by a simultaneous saccharfication and fermentation
process (SSF) with
Kluyveromeces marxianus
CECT 10875.Process Biochem.
39, 1843-1848.4. Blumer-Schuette, S. E., I. Kataeva, J. Westpheling, M. W.
W. Adams, and R. M. Kelly. 2008. Extremely thermophilic microorganisms for biomass conversion: status and prospects.
Curr. Opin. Biotechnol
. 19, 210-217.5. Chakraborty, K. and R. P. Raj. 2008. An extra-cellular alka- line metallolipase from
Bacills licheniformis
MTCC 6824: pu- rification and biochemical characterization.Food Chem
. 109, 727-736.6. Chen, H. and S. Jin. 2006. Effect of ethanol and yeast on cellulase activity and hydrolysis of crystalline cellulose.
Enzym. Microb. Technol
. 39, 1430-1432.7. Chun, J. 1995. Computer-assisted classification and identi- fication of actinomycestes. Ph. D. Thesis, University of Newcastle, Newcastle upon Tyne, UK.
8. Emtiazi, G. and I. Nahvi. 2000 Multi-enzyme production by
Cellulomonas
sp. grown on wheat straw.Biomass Bioenergy
19, 31-37.9. Gavaco-Paulo, A. 1998. Mechanism of cellulase action in tex- tile processes.
Carbohydr. Polym
. 37, 273-277.10. Henrissat, B., H. Driguez, C. Viet, and M. Schulein. 1985.
Synergism of cellulases from
Trichoderma reesei
in the degra- dation of cellulose.Biotechnol.
3, 722-726.11. Hmidet, N., A. Bayoudh, J. G. Berrin, S. Kanoun, N. Jude, and M. Nasri. 2008. Purification and biochemical character- ization of a novel α-amylase from
Bacillus licheniformis
NH1 cloning, nucleotide sequence and expression ofamyN
gene inEsherichia coli
.Process Biochem
. 43, 499-510.12. Jecu, L. 2000. Solid state fermentation of agricultural wastes for endogulcanse production.
Ind. Crops Prod
. 11, 1-5.13. Jo, K. I., Y. J. Lee, B. K. Kim, B. H. Lee, C. H. Jung, S. W.
Nam, S. K. Kim, and J. W. Lee. 2008. Pilot-scale production of carboxymethylcellulase from rice hull by
Bacillus amyloli- quefaciens
DL-3.Biotechnol. Bioprocess Eng
. 13, 182-188.14. Kalogeris, E., P. Christakopoulos, P. Katapodis, A. Alexious, S. Vlachou, D. Kekos, and B. J. Macris. 2003. Production and characterization of cellulolytic enzymes from the ther- mophilic fungus
Thermoascus aurantiacus
under solid state cultivation of agricultural waste.Process Biochem
. 38, 1099-1104.15. Kang, S. W., Y. S. Park, J. S. Lee, S. I. Hong, and S. W.
Kim. 2004. Production of cellulase and hemicellulases by
Aspergillus niger
KK2 from lignocellulosic biomass.Bioresource Technol
. 91, 153-156.16. Khambhaty, Y., K. Mody, and B. Jha. 2007. Purification and characterization of ĸ-carrageenase from a novel γ -proteobacterium,
Pseudomonas elongate
(MTCC 5261) syn.Microbulbifer elongates
comb. Nov.Biotechnol. Bioprocess Eng
. 12, 668-675.17. Khuri, A. I. and J. A. Cornell. 1987. Response surfaces:
Design and analysis. Marcel Dekker, New York, USA.
18. Kim, B. K., B. H. Lee, Y. J. Lee, I. H. Jin, C. H. Chung, and J. W. Lee. 2009. Purification and characterization of car- boxymethylcellulase isolated from a marine bacterium,
Bacillus subtilis
subsp.subtilis
A-53.Enzym Microb. Technol
.44, 411-416.
19. Kim, D. G., E. Y. Kim, J. K. Kim, H. S. Lee, and I. S. Kong.
2011. Application of β-1,3-glucanase from
Pyrococcus furiosus
for ethanol production using laminarian.J. Life Sci
. 21, 68-73.20. Kim, H. J., W. Gao, Y. J. Lee, C. H. Chung, and J. W. Lee.
2010. Characterization of acidic carboxymethylcellulase pro- duced by a marine microorganism,
Psychrpbacter aquimaris
LBH-10.J. Life Sci
. 20, 487-495.21. Krishna, C. 1999. Production of bacterial cellulases by a solid state bioprocessing of banana wastes.
Bioresource Technol
. 69, 231-239.22. Kumar, S., K. Tamura, and N. Nei. 1993. MEGA: Molecular evolutionary genetic analysis. Version 1.01. The Pennsylvania State University, University Park, USA.
23. Lee, B. H., B. K. Kim, Y. J. Lee, C. H. Chung, and J. W.
Lee. 2010. Industrial scale of optimization for the production of carboxymethylcellulase from rice bran by a marine bacte- rium,
Bacillulus
subsp.subtilis
A-53.Enzym. Microb. Technol
. 46, 38-42.24. Lee, S. M. and Y. M. Koo. 2001. Pilot-scale production of cellulose using
Trichoderma reesei
Rut C-30 in fed-batch mode.J. Microbiol. Biotechnol
. 11, 229-233.25. Maeadza, C., R. Hatti-Kaul, R. Zvauya, and B. Mattiasson.
2000. Purification and characterization of cellulases pro- duced by two
Bacillus
strains.J. Biotechnol
. 83, 177-187.26. Malinowska, E., W. Krzyczkowski, G. Lapienis, and F.
Herold. 2009. Improved simultaneous production of myce- lial biomass and polysaccharides by submerged culture of
Hericium erinaceum
: optimization using a central composite rotatable design (CCRD).J. Ind. Microbiol. Biotechnol
. 36, 1513-1527.27. Mayende, L., B. S. Wilhelmi, and B. I. Pletschke. 2006.
Cellulases (CMCases) and polyphenol oxidases from ther- mophilic
Bacillus
sp. isolated from compost.Soil Biol.
Biochem
. 38, 2963-2966.28. Miller, G., L. Blum, R. Glennon, and A. L. Burton. 1960.
Measurement of carboxymethylcellulaase activity.
Anal.
Biochem
. 2, 127-132.29. Rajoka, M. I. and K. A. Malik. 1997. Cellulase production by
Cellulomonas biazotea
cultured in media containing differ- ent cellulosic substrates.Bioresource Technol
. 59, 21-27.31. Rasmussnen, R. S. and M. T. Morrissey. 2007. Marine bio- technology for production of food ingredients.
Adv. Food Nut. Res
. 52, 237-292.32. Ryu, D. D. Y. and M. Mandels. 1980. Cellulase: biosynthesis and applications.
Enzym. Microb. Technol
. 2, 91-102.33. Saha, B. C., L. B. Iten, M. A. Cotta, and Y. Wu. 2005. Dilute acid pretreatment, enzymatic saccharification, and fermenta- tion of RHs to fuel ethanol.
Biotechnol
. 21, 816-822.34. Sen, R. 1997. Response surface optimization of the critical media components for the production of surfactin.
J. Chem.
Tech. Biotechnol
. 68, 263-270.35. Sukumaran, R. K., R. R. Singhania, G. M. Mathew, and A.
Pandey. 2009. Cellulase production using biomass feed stock and its application in lignocellulose saccharification for bio-ethanol production.
Renew. Energy
34, 421-424.초록:통계학적인 방법과 왕겨를 기질로 사용하여 해양에서 분리한 Bacillus licheniformis LBH-52 를 사용한 carboxymethylcellualse의 생산조건 최적화
김혜진
1,2․고와
1,2․정정한
3․이진우
2,3*
(
1동아대학교 대학원 의생명과학과,
2동아대학교 BK21 생물자원 실버바이오 산업화 인력양성 사업단,
3동아
대학교 생명공학과)
왕겨를 기질로 사용하여 carboxymethylcellualse (CMCase)를 생산하는 미생물을 해수에서 분리하였으며 16S rDNA의 염기서열을 분석하여 동정한 결과, Bacillus lichemiformis로 확인되었다. CMCase를 생산하기 위한 최적 의 탄소원과 질소원은 왕겨와 암모니움 나이트레이트이었다. 통계학적인 방법인 response surface method (RSM) 을 사용하여 CMCase를 생산하기 위한 조건을 최적화하였다. 통계학적인 분석 결과, 왕겨가 균체의 생육에 미치 는 영향이 가장 높았으며, 왕겨와 배지의 초기 pH가 CMCase 생산에 미치는 영향이 높았다. Design Expert Software를 사용하여 결과를 분석한 결과, 균체의 생장에 최적인 조건은 48.7 g/l 왕겨, 1.8 g/l 암모니움 나이트 레이트, 배지의 초기 pH 6.8 및 배양온도 35.7℃이었으나, CMCase의 생산에 최적인 조건은 43.2 g/l 왕겨, 1.1 g/l 암모니움 나이트레이트, 배지의 초기 pH 6.8 및 배양온도 35.7℃이었다. 최적화된 조건에서 왕겨를 기질로 사용하여 B. lincheniformis LBH-52가 생산하는 CMCase는 79.6 U/ml이었다. 본 연구를 통하여 왕겨와 암모니움 나이트레이트를 CMCase를 생산하는 기질로 개발하였으며, 해수에서 분리한 미생물을 사용하여 생산기간을 3일 로 단축하였다.
36. Tao, S., L. Beihui, L. Zuohu, and L. Deming. 1999. Effects of air pressure amplitude on productivity by
Trichoderma viride
SL-1 in periodic pressure solid state fermenter.Process Biochem
. 34, 25-29.37. Thompson, J. D., D. G. Higgins, and T. J. Gibson. 1994.
CLUSTAL W: Improving the sensitivity of progressive mul- tiple sequence alignment through sequence weighting, posi- tions-specific gap penalties and weight matrix choice.
Nucleic Acids Res
. 22, 4673-4680.38. Wei, G. Y., W. Gao, I. H. Jin, S. Y. Yoo, J. H. Lee, C. H.
Chung, and J. W. Lee. 2009. Pretreatment and saccharifiction of rice hulls for the production of fermentable sugars.
Biotechnol. Bioprocess Eng
. 14, 828-834.39. Weisburg, W. G., S. M. Barns, D. A. Pelletire, and D. J. Lane.
1991. 16S ribosomal DNA amplication for phylogenetic study.
J. Bacteriol
. 173, 697-703.40. Yu, X. B., J. H. Nam, H. S. Yun, and Y. M. Koo. 1998.
Optimization of cellulose production in batch fermentation by