사물인터넷을 이용한 의약품 콜드체인 관리 시스템
아벨산드라, 백 종 상*, 이 성 로°
Internet-of-Things Based Approach for Monitoring Pharmaceutical Cold Chain
Abel Avitesh Chandra, Jong Sang Back*, Seong Ro Lee°
요 약
사물을 인터넷에 연결시키는 기술인 Internet of Things(IoT)는 새로운 연구분야가 되어 기술적으로 많은 발전이 이루어 져왔다. 이러한 IoT 기술은 사물을 관찰하거나 다루는데 있어 쉽게 접근하도록 하여 네트워크 상에서 인터넷으로 데이터 의 전달을 가능하게 한다. 이는 두가지의 인프라를 필요로 하는데 하나는 데이터를 수집하는 Sensing Entity이고 다른 하나는 데이터를 점유하는 Sensor Cloud이다. 여기서 무선 센서 네트워크는 사물로부터 측정되는 데이터를 인터넷에 연결시키는데 매우 중요한 역할을 하는데 간단한 컴퓨팅 디바이스나 Arduino, Raspberry Pi와 같은 임베디드시스템으로 구성될 수 있다. Sensor Cloud는 사물로부터 측정되어 나오는 데이터의 공유나 처리를 하도록 하는 클라우드 컴퓨팅으로 모니터링 혹은 컨트롤 시스템에 대한 플랫폼을 제공한다. 본 논문에서는 의약품의 저장 조건들을 모니터링 하는 Cold Chain을 제안한다. 제안된 Cold Chain은 생산에서 소비단계까지 이르는 이동이나 저장상태에 대한 여러 환경적 조건인 습도, 온도, 저장 장소 등을 모니터링 하는 시스템이다. 시스템은 두개의 부시스템으로 구성되는데 하나는 이동에 관련된 것을 다루고 다른 하나는 저장에 관련된 것을 다룬다. 이 두 개의 시스템은 보다 향상된 모니터링 방법을 제공하기 위해 Sensor Cloud 시스템으로 통합된다.
Key Words : Internet of Things, Cloud Service, Wireless Sensor Network, Pharmaceutical Cold Chain, Arduino, ZigBee, Near Field Communication
ABSTRACT
There is a new evolution in technological advancement taking place called the Internet of Things (IoT). The IoT enables physical world objects in our surroundings to be connected to the Internet. For this idea to come to life, two architectures are required: the Sensing Entity in the environment which collects data and connects to the cloud and the Cloud Service that hosts the data. In particular, the combination of wireless sensor network for sensing and cloud computing for managing sensor data is becoming a popular intervention for the IoT era. The pharmaceutical cold chain requires controlled environmental conditions for the sensitive products in order for them to maintain their potency and fit for consumption. The monitoring of distribution process is the only assurance that a process has been successfully validated. The distribution process is so critical that anomaly at any point will result in the process being no longer valid. Taking the cold chain monitoring to IoT and using its benefits and power will result in better management and product handling in the cold chain. In this paper, Arduino based wireless sensor network for storage and logistics (land and sea) is presented and integrated with Xively cloud service to offer a real-time and innovative solution for pharmaceutical cold chain monitoring.
http://dx.doi.org/10.7840/kics.2014.39C.9.828
※ 본 연구는 2013년도 정부(교육부)의 재원으로 한국연구재단의 지원을 받아 수행된 기초연구사업(No. 2009-0093828)과 미래창조과학 부 및 정보통신산업진흥원의 IT융합 고급인력과정 지원사업(NIPA-2014-H0401-14-1009) 및 2013년도 정부(미래창조과학부)의 재원 으로 한국연구재단(No.2011-0029321)의 지원을 받아 수행된 연구임의 연구결과임.
First Author : Department of Electronics Engineering, Mokpo National University, [email protected], 학생회원
° Corresponding Author : Department of Information Electronics Engineering, Mokpo National University, [email protected], 정회원
* Department of Electronics Engineering, Mokpo National University, [email protected]
논문번호:KICS2014-05-176, Received May 8, 2014; Revised September 12, 2014; Accepted September 12, 2014
Ⅰ. Introduction
The pharmaceutical cold chain refers to the delivery of pharmaceuticals from the manufacturing stage to the consumption stage. These temperature sensitive products are needed to be kept at the required condition to the very last point so that it is fit for consumption. This applies to all products, both high-risk and low-risk[1]. The members of the pharmaceutical supply chain have various global regularity requirements and standards to meet while handling, storing and distributing environmentally sensitive products[2]. In the early 1990’s, FDA (Food and Drug Administration) started complying with HACCP (Hazard Analysis Critical Control Point) rules as a systematic approach to food safety. From there on, this standard has been applied to other areas including pharmaceutical industry. The HACCP management system underlines various means for product safety and handling and distribution of finished products is among those guidelines. HACCP has now become a universally recognized and accepted standard for product safety by governing authorities including WHO (World Health Organization)[3]. Because of the presence of multiple uncontrolled variables within the distribution process, the development of appropriate temperature and humidity monitoring program is essential to protect the quality of sensitive products and ensure patient safety[2].
Logistical third party companies have emerged and constitute methods for successfully transporting the commodities. Before their emergence, cold chain processes were mostly handled in house by the manufacturer. Specialization has led to not only rely on major shipping service providers but also more focused industry that have developed a niche logistical expertise around the shipping of temperature sensitive products. The reliance on the cold chain continues to gain importance within the pharmaceutical industry as the movement of drugs relies heavily on controlled and uncompromised transfer of shipments.
Over the years, different types of systems and means have been employed for the monitoring
purpose. The traditional method for monitoring is carried out through chemical indicators[4]. These chemical indicators can be of internal or external types and use sensitive chemicals to access physical conditions such as temperature. The indicators change color rapidly when a given parameter is reached. Another technology is the data logging technology which is widely used. One example of such technology is the Sensitech data-loggers[5]. These data-loggers record parameters like temperature and humidity which allow the collection of valuable data about shipments. At the end of the shipments, the logged data can be downloaded and analyzed on computer. The chemical indicators and data-loggers do provide monitoring but are limited in ability to relay information in real-time during shipment from the factory to consumer[6]. A recent technology for monitoring cold chain is RFID.
Passive RFID tag is packaged together with the product and it records the temperature and other critical parameters through the shipment. Along the transit, RFID antennas are stationed which read the recorded data from these passive tags. The data are then updated to the server where real-time monitoring takes place. RFID technology helps to identify potential excursion conditions due to real-time data and provides a complete chain of data history from manufacturer to the last mile. This technology however still lacks in the ability to provide information as it happens which is necessary in this type of monitoring situations.
Ⅱ. Techologies at Work
2.1 The Internet of Things
Initially, the Internet was only designed for computers so that it could access websites, download contents or communicate with other computers. But the evolution of technology resulted in creation of powerful and faster devices which had more capabilities. Together in this evolution was the advancement of electronics technology which led to the development of smaller devices having high processing capabilities with low power consumption.
As a result of these devices, large networks of
sensors could be created which had the ability to obtain and process information and act accordingly.
The idea of connecting things to the Internet goes back a few decades. In 1989, John Romkey and Simon Hackett created the first Internet ‘device’, a toaster that could be turned on and off over the Internet[7,8]. In 1992, another device, a coffee pot named ‘The Trojan Coffee Pot’, was created by Quentin Stafford-Fraser and Paul Jardetzky which was located in the ‘Trojan Room’ within the Computer Laboratory of the University of Cambridge[9].
In the year 1999, the term ‘Internet of Things’
was coined by Kevin Ashton, the director of the MIT Auto-ID center, having the concept of computers to get information about the real world without any help from people and giving information[10]. The vision required major technology improvement at that time.
Presently, many of the obstacles have been solved
[11]. The price and size of wireless radios have dropped tremendously. The IPV6 version of Internet protocol allows billions of devices to be assigned a communications address. Wi-Fi and cellular wireless connectivity are being built into a wide range of devices by electronics companies. The ABI research estimates the shipment of over 10 billion Bluetooth and Wi-Fi enabled devices in 2015[12]. Mobile data coverage has improved significantly and broadband speeds are now offered by many networks.
2.2 Arduino
Arduino is an open-source electronics prototyping platform based on easy to use hardware and software. It is based on a board with a single microcontroller input/output pin for communication and control of physical objects and a development environment for writing software for the board.
Arduino devices have been developed to connect all kinds of objects and its functionality directly relates it to the IoT.
The Arduino project grew largely out of the “Do It Yourself” situation created by the burgeoning popularity of rapid prototyping boards like PIC and Wiring, as well as the response to an increasing
need of artists and designers to easily prototype interactive works[13]. Arduino is among other microcontrollers and microcontroller platforms available for physical computing. All of these tools transform the messy details of microcontroller programming and wrap it up in an easy-to-use package. Apart from offering simplified process of working with microcontrollers, it brings along other advantages which makes choosing Arduino platform worthwhile. The Arduino boards are relatively cheap compared to other platforms, the software runs on multiple operating systems, has easy to use programming environment yet flexible enough for advanced users, open source software which is available for extension by experienced programmers and open source and extensible hardware where advanced circuit designers can make their own version of the module, extending it and improving it.
2.3 Web 2.0
Web 2.0 is the second generation World Wide Web which is focused on the ability for people to collaborate and share information online. It refers to the transition from static HTML web pages to a more dynamic web that is more organized and is based on serving web applications to users. The major difference between Web 2.0 and the traditional World Wide Web (Web 1.0) is the greater collaboration among Internet users and other users, content providers and enterprises. The two major components of Web 2.0 are the technological advancements by Ajax (Asynchronous Javascript and XML) and other new applications such as RSS and eclipse and the user empowerment which they support[14].
Formerly, users simply viewed or downloaded the data contents posted on Web sites. With the new Web, users have more input into the nature and scope of Web content and in some scenarios exert real-time control over it. Open API’s have helped Web 2.0 services develop rapidly and have aided the creation of mash-ups of data from various sources[15]. An Application Programming Interface (API) allows programmers to make use of the functionality of a set of modules without having
access to source code. An API where Programmer is not required to license or pay royalties is often described as open. There has been substantial debate over what constitutes ‘openness’. Some intellectuals argue that it is the data rather than the software that needs to be open and there are those that say being truly open, the user’s data should be able to be moved or taken back by the user at will[16].
2.4 3G Network
3G network is a result of a decade of development and evolution of the GSM standard.
The technology came along to support increased data needs. Common cellular access technologies comprised in 3G are CDMA2000, WCDMA and TD-SCDMA. The 3G technology is founded on the ITU (International Telecommunication Union) group which belongs to the IMT-2000.
The network allows network operators to provide users a bigger range of latest services due to bigger network capacity via heightened spectral efficiency.
The services include video calls, wide-area wireless voice telephony and broadband wireless data services, all included within the mobile environment.
The 3G network cover a very wide area of cellular telephone networks that turn into incorporate high-speed internet connection and video telephony.
2.5 Near Field Communication
Near field communication (NFC) is a wireless short-range and high frequency communication between devices to exchange of data. NFC traces its roots back to radio frequency identification. This technology is based on radio waves which is the data exchange medium between an identification card (NFC tag) and a reader. NFC works when two devices are within a distance of 4 centimeters from each other and supports one card reading at a time[17]. In addition, the readers can read passive RFID tags which are developed with the same standards as NFC but not all of it out there due to many different types of RFID tags developed over the years.
In the beginning of the millennium, Sony and a company called NXP Semiconductors invented the
new NFC technology[18]. Today, the NFC forum creates technical specifications which those developing NFC compatible devices and NFC tags must follow. The specification ensured any NFC device was able to communicate with any other NFC device, one of the major factors making the NFC technology fast and simple. The technology works at 13.56 MHz frequency with data transfer rate of up to 424 Kbits/sec and shares the characteristics of the ISO 14443.
2.6 ZigBee
ZigBee is the name of a communication protocol that uses small, low-power digital radios based on the IEEE 802.15.4 standard for wireless personal area networks (WPANs). The standard itself is managed by the ZigBee Alliance. It is intended to be simpler and cheaper than other WPANs such as Bluetooth and Wi-Fi. The technology is targeted at radio-frequency (RF) applications that require a low data rate, long battery life and secure networking.
The frequency band of ZigBee is 868 MHz in Europe, 915 MHz in America and a 2.4 GHz bandwidth in the rest of the world.
ZigBee is the most widely used technology in wireless sensor networks. The reason for ZigBee being famous for wireless sensor networks is its low data rate (20 kbps – 250 kbps) and low power consumption. On the other hand, the data rates for Bluetooth are up to 1 Mbps and 54 Mbps for Wi-Fi’s 802.11g technology. Sensor readings are typically a few tens of bytes so high bandwidth is not necessary and ZigBee’s low bandwidth helps it fulfill its goals of low power, low cost and robustness[19].
Ⅲ. Design Architecture for Cold Chain Monitoring System
The wireless sensor network of this system is based on Arduino platform. There are two subsystems in the monitoring system. The implementations of the subsystems were carried out using commercially available Arduino Hardware.
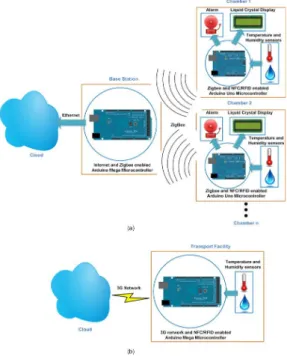
One system is designed for storage facility
Fig. 1. Monitoring setups for storage and logistic facilities. (a) Storage facility. (b) Land transport facility. (c) Sea transport facility.
Fig. 2. Pharmaceutical Cold Chain monitoring subsystems.
(a) Monitoring setup of the Storage facility. (b) Monitoring setup of the Transport facility.
monitoring whiles the other for logistics. The subsystems operate in a similar manner but use different means to convey their data. Due to the factors associated with the environment, slightly different type of hardware was used for both subsystems. Figure 1 shows the monitoring setup.
The block diagrams of the subsystems are shown in figure 2.
3.1 Temperature and Relative Humidity The term humidity refers to the amount of water vapor present in the air and can be specified by a number of physical quantities[20]. The water vapor in the air exerts a partial pressure which is called the vapor pressure and is the most useful measure of the water content in the air. It is usually denoted by “e”.
There exists an interesting relationship between the temperature of the air and the amount of water vapor which the air can hold. The maximum amount of water vapor which can be present in the air depends on the air temperature. The higher the air temperature, the more the vapor it can hold. When air holds the maximum possible water vapor at a given air temperature and pressure, the air is said to be saturated. If more vapor is added at this stage, or if the air is cooled below the saturation point, the excess vapor condenses into tiny drops of dew. The temperature at which dew begins to form is known as dew point and at this temperature the pressure of the water vapor in the air becomes saturated.
Pressure exerted by the water vapor in a saturated condition at a given temperature and pressure is called saturation vapor pressure and is denoted by
“es”. The relative humidity (RH) of the air is expressed as:
× (1)
The relative humidity is therefore defined as the percentage ratio of the actual vapor pressure (e) to the maximum possible vapor pressure (es) at a given temperature.
The relationship between temperature and saturation vapor pressure is given as:
×
(2)
where es=saturationvaporpressureinmillibars,T = temperature in ⁰C. The above equation can be used
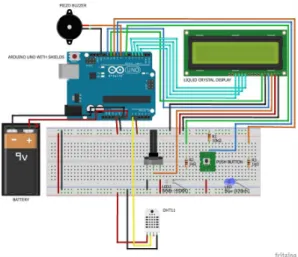
Fig. 3. Connections of the hardware components of the node.
to compute the saturation vapor pressure for different temperature values.
The most convenient method for determining the relative humidity is through the use of wet and dry bulb thermometers called psychrometer. When the bulb of a thermometer is covered by a small piece of wet muslin or cloth, it will register lower temperature than a similar naked thermometer. The low value of temperature at the wet bulb thermometer is due to the fact that when the air is unsaturated, there is evaporation of water from the wet cloth into the surrounding air. The latent heat of vaporization is taken from the air which is thereby cooled. Cooling of the air and increase of moisture content by evaporation from the cloth continue until the surrounding air is saturated and beyond this the wet bulb records a steady reading lower than that of the dry bulb. The difference in the readings between the dry bulb thermometer and the wet bulb thermometer in relation to the air temperature gives a measure of the actual vapor pressure as well as the relative humidity of the air. The psychrometric equation for determining the vapor pressure of the air can be expressed as:
(2)where e = the pressure of the vapor present in the air, es=thesaturationvaporpresentattemperatureTW of the wet bulb thermometer, T = the temperature of the dry bulb thermometer, TW = the temperature of the wet bulb thermometer and P = the pressure of the air.
3.2 Monitoring at the Storage facility
The warehouses serve an important role for storing the products which may be on their way through the supply chain or at their final destination.
The network setup at storage facility is star topology where the nodes connect to a central base station.
There can be any number of nodes depending on the number of chambers to be monitored. The communication between nodes and base station is done through ZigBee. The base station is a gateway which conveys the network’s data to the cloud.
The nodes are the heart of any wireless sensor network. The hardware components of the node are:
Arduino Uno microcontroller, NFC/RFID shield, series2 XBee radio and DHT11 temperature and humidity sensor. The node also consists of an external circuit that comprises LCD, Piezo Buzzer, LEDs and Switch to perform task and perceive processes happening at the node. The DHT11 temperature and humidity sensor has good measurement range of 20-90% relative humidity and 0-50⁰C temperature with accuracy of ±5% and ±2⁰C respectively.
The NFC/RFID reader is the Adafruit PN532 NFC/RFID controller shield for Arduino[21]. The shield is good for 13.56MHz and NFC applications.
The shield uses PN532 chipset which is a popular NFC chip on the market and is also the chip embedded in most NFC enabled phones. The shield Arduino library currently supports reading/writing tags only. The antenna has a range of 10 centimeters (4 inches) which is the maximum possible range for the 13.56MHz technology. The shield is designed to use either of the I2C or SPI communication protocols. I2C is the default protocol and is used to communicate with Arduino Uno microcontroller.
Hence the pins of Uno used by the shield are digital pin 2 for interrupt, SDA & SCL and analog pins 4 and 5 for I2C communication.
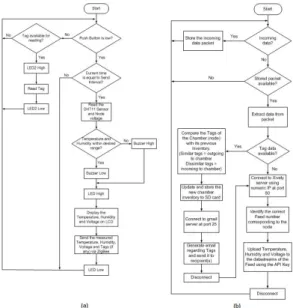
The program on the Arduino Uno microcontroller
Fig. 4. Flowchart of the Arduino programs (a) Node (b) Base Station.
performs the tasks with reference to the defined interval. The interval is the time frame at which the node sends its data to the base station. The interval depends on the monitoring personnel but needs to be short enough so that abnormal measurements can be recognized as timely as possible. The Arduino program in this work has been defined an interval of 5 minutes. Within the 5 minutes timeframe, the microcontroller does not do anything and allows reading of tags for products incoming and outgoing the chamber by a push of the button. The tag reading time is denoted when blue LED is turned off. Successful tag readings are indicated with the white LED. When the 5 minutes time interval elapses, the sensor readings are taken and compared with predefined range for each parameter (temperature and humidity only). Any parameter falling out of range triggers the local alarm (i.e.
buzzer). The blue LED then lights up and sensor readings and tags (if any) are transmitted to the base station via ZigBee. After the packet is sent, blue LED turns off and microcontroller goes back to its 5 minutes wait state before sending another packet.
Flowchart in figure 4 shows the processes taking place in the program.
The base station is where all the data from the
nodes are collected. It comprises Arduino Mega microcontroller, Ethernet shield with SD card and series2 XBee radio and is powered by a DC adapter.
The high processing capability of Arduino Mega makes it suitable for this application as it requires receiving data from various nodes, processing the data and establishing internet connections to send those data.
The Ethernet shield is the simplest way to connect Arduino to internet. It uses a RJ45 cable to connect to the network. The shield is based on Wiznet W5100 ethernet chip and provides a network stack capable of both TCP and UDP. It also supports up to 4 simultaneous socket connections.
For the Ethernet shield to work well with Arduino Mega, additional wiring is required. This is not the case with Arduino Uno. Arduino communicates with both the W5100 and SD card (on the Ethernet shield) using the SPI bus. The SPI bus is on digital pins 10, 11, 12 and 13 on Uno and pins 50, 51 and 52 on Mega. On both the boards, pin 10 is used for selecting the W5100 and pin 4 for the SD card. On Mega, pin 53 (hardware SS pin) is not used for selecting either the W5100 or the SD card but it is kept as an output otherwise SPI interface does not work. W5100 and SD card share the SPI bus so only one is active at a time. Hence the pins 11, 12 and 13 on the Ethernet shield were jumper wired to pins 50, 51 and 52 on Mega respectively.
The base station continuously waits for data packets from nodes. Once it starts receiving from a node, it stores all the data before performing actions to it. As the packet is fully received, the program goes on to extract specific data from the packet.
There are two types of operations which can be performed on the received data; data preparation for emailing and data preparation for uploading to Cloud Service. If the received data contain tags, they are processed to find the incoming, outgoing tags as well as the inventory in the chamber (node) by comparing the tags with previous inventory information. After this process is completed, the chamber inventory is updated and stored in the micro SD card for next comparison. SD card is employed to sustain inventory data of each node
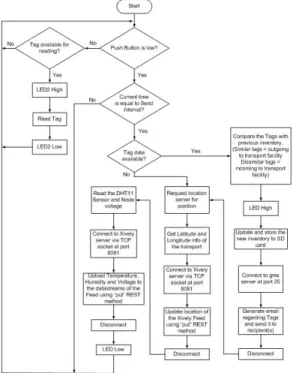
Fig. 5. Circuit diagram of the monitoring system in transport facility.
when microcontroller is reset. The processed information is then used to generate email for the recipient(s). After the email is sent, the next step is to prepare the remaining data for Xively cloud service. In cases when there are no tags, the program comes directly to this step. Each node has a designated Feed (channel) on the cloud service with unique feed ID and API key. The corresponding feed ID and API key of the node is used to upload the Temperature, Humidity and node Voltage to Xively. The upload action is performed via “put” REST method. The program then returns to listen for incoming data and perform these actions on the next set of data.
3.3 Monitoring of Transport facility
Monitoring of pharmaceuticals in logistics is the other subsystem of the monitoring system. The products on the move have to be continuously monitored since there can be more chance of product spoilage due to its distant location at a given time that can result in slow response to an event. The hardware used in this monitoring is similar to the warehouse monitoring except for the gateway that passes the data to the cloud service.
The system can be implemented in transports both on land and sea as long as there is availability of mobile network.
The hardware components of this subsystem are:
Arduino Mega microcontroller, 3G+GPS shield for Arduino, NFC/RFID shield and DHT11 temperature and humidity sensor. The node also consists of an external circuit that comprises LEDs and Switch to perform task and perceive processes happening at the node.
The high processing power of ATmega2560 microprocessor on Arduino Mega with high memory and clock speed make the Arduino Mega ideal for this application. The 3G+GPS shield for Arduino[22]
from Cooking Hacks Electronics enables the connectivity to high speed WCDMA and HSPA cellular networks. The SIM5218 3G module can attain maximum speeds of 7.2Mbps download and 5.5Mbps upload. The module supports both A-GPS and S-GPS and provides three operating modes:
mobile-assisted mode, mobile-based mode and standalone mode. A-GPS includes the mobile-assisted and mobile-based modes. With internal GPS the module is capable of locating devices outdoors and indoors. The module uses predefined AT commands to perform tasks and these are programmed within the Arduino IDE of the Mega microcontroller. The shield uses I2C protocol to communicate with Arduino Mega. The pin connection of the shield to Arduino Mega is via digital pin 2 (for switching on the module), TX and RX. There is a pin conflict when using the 3G+GPS and NFC/RFID shields together. Hence the default pin 2 was changed to pin 4 for the NFC/RFID shield in the Arduino IDE.
The operation of the transport node is similar to the storage facility except that the process of node and base station is combined into a single hardware.
With a fixed time interval for data upload, the program reads the sensors and allows reading of tags for keeping track of the inventory. Tags can only be read when microcontroller is not busy sending data over the internet. The blue LED lights up when microcontroller is connected to the internet.
The system reads the tags only when the button is pressed and successful reads are indicated by the white LED. Moving further in the Arduino code, the cases when tag readings are present, the program performs the additional task of generating and
Fig. 6. Arduino program flowchart of the transport
facility. Fig. 7. Xively data hierarchy.
sending email consisting of information regarding the incoming, outgoing tags and the inventory at that point in time. The SIM5218 does not support SMTP and POP3 over email servers that use SSL function hence Gmx mail service was used for this purpose.
This does not affect the intended recipient(s). The email account that the program uses can be logged in from ordinary computers to access the email history of the sent email from the 3G+GPS module.
Each time inventory changes, it is stored in the micro SD card of the 3G+GPS shield. It is stored for comparison next time tags are read to deduce the new inventory and saving on SD card helps retain the information during microcontroller resets.
Once email is sent, next process is obtaining the GPS coordinates of the transport facility. After attaining the latitude and longitude, connection to the Xively server is carried out to upload the coordinates to the node’s feed. Finally, the temperature and humidity is measured through the DHT11 sensor and node voltage from analogue pin 1 and uploaded to the Xively feed. The SK telecom cellular network was used to establish connections
with the web clients and servers.
3.4 The Xively Cloud Service
Xively which was formally known as Pachube and Cosm is a platform for Internet of Things launched by LogMeIn. Xively cloud service enables IoT-based innovations by offering an open, platform as a service that provides real-time messaging, directory and data services, including a times-series database and analytics, all which are accessible through a standards based API.
The resources of Xively were accessed through developer account. There is a hierarchy of data types used to represent data in the Xively platform. Xively enables the developers to create products by connecting devices in development stage. After development stage, the prototypes can be turned into products by moving to deployment stage. Finally the batches of products can be managed and devices supported in real time.
Signing up for a developer account lets the addition of development devices to the workbench.
The Xively workbench issues a Feed number to store data on and API key. These are required in the Arduino code of the device for communication. The API key gives read, write, create and delete permissions to a device. The device’s data is therefore stored in its Feed using an API key for permission. Within the Feeds are different sets of data (in this case; temperature, humidity and voltage) called datastreams or channels. The Xively API presents a collection of RESTful resources. The
Fig. 8. The Zapier service acts as a bridge between Xively triggers and applications.
RESTful method is a method for operating on the resources and these are: GET, PUT, POST and DELETE. The Feeds of Xively has two types of data: Data and Metadata. The Data are data within datastreams and Metadata is extra information associated with Feeds such as physical location of the device, description of the Feed, creator, date of creation, etc. Xively supports reading and writing data through 3 resources: Feeds, Datastreams and Datapoints. Reading data from one or more datastreams returns a list of historical datapoints within the specified range.
Trigger is another API resource of Xively. It is also referred to as notifications which provide ‘push’
capabilities by sending HTTP POST requests to a URL of the user’s choice when one or more conditions for a datastream is satisfied. The triggers can be made to fire when a value of a channel matches certain criteria. The criterion includes datastream value going above or below a certain threshold, datastream freezing or datastream is updated. Zapier is a popular service for performing trigger actions on user’s choice of applications. It is a service that enables the automation of tasks between web applications. Connecting a Xively trigger to Zapier lets the Feeds send a Tweet with Twitter, post on Facebook, activate a call or SMS with Twilio, send email or influence any number of apps. Zapier is not a free service and has pricing plans for users to choose from. The free plan allows creation of 5 zaps which can execute at minimum every 15 minutes.
Ⅳ. Results and Discussion
The monitoring devices were tested in the laboratory. The measured parameters were visualized
using the Xively cloud service. Placing the measured data on cloud helps to ease the monitoring process.
As the monitoring data is also required by the regularity authorities, this process makes data easily visible for quick evaluation of distribution and storage companies. With the cloud service, quick abnormalities can be reported and actions can be taken accordingly to make the storage and distribution processes safer.
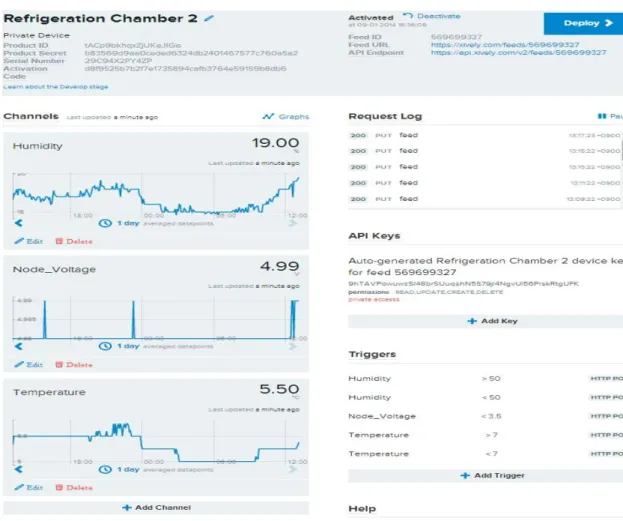
The data upload from the monitoring devices to cloud service is instant. The microcontrollers need to be reset daily to ensure monitoring carries on without getting affected by any possibility of non-responsiveness of the microprocessors. Figure 10 shows the developer workbench of a monitoring environment. The data of the measured parameters (Humidity, Node Voltage and Temperature) are visualized in a graphical manner. Xively allows viewing of the graphs in two ways: by raw datapoints or by averaged datapoints. Raw datapoints can be viewed for a minimum period of 5 minutes to a maximum period of 1 hour and averaged datapoint for a minimum period of 6 hours to a maximum of 3 months.
The workbench also illustrates the settings configured for the particular chamber. In figure 10, the trigger configurations for chamber 2 are shown.
HTTP POST action is performed when RH goes above or below 50% and likewise for temperature with a value of 7⁰C. There could have been more trigger configurations such as HTTP POST for temperature values going above or below 3⁰C but due to free account on Zapier which allows only a certain number of zaps, few configurations were made. The trigger action is performed only once when a criterion is met. For instance, when temperature reading goes past 7⁰C, HTTP POST is executed automatically and would not execute anymore even if the value remains above the threshold value. Another trigger is configured which denotes the datapoint going below 7⁰C to indicate the datastream has returned to its normal state.
Embedding GPS coordinates is also possible for Feeds. Latitude and longitude information is used by the portal to indicate the position of the facility on
Fig. 9. Map showing the location of transport facility.
Fig. 10. Xively Developer Workbench showing the monitoring of a chamber.
a map. This is helpful in monitoring transport facility. Figure 9 shows the location of transport
facility at a given time. The coordinates were updated every 5 minutes along with the storage conditions.
Zapier service plays a very important role in this monitoring system. The service enables the triggers from Xively to reach the clients/personnel involved in the monitoring task. Zapier acts like a bridge between Xively and the notifying application. There are numerous applications available for performing the notification task via Zapier. The application used in this project was email service.
The configured triggers on Xively do not have much option that can allow modification to be applied to it. Through Zapier, users have control over those triggers and allow changes to be applied to it from time to time, for instance, turning off/on a zap, changing the notifying application, modifying
the notification body, etc. From the GUI of Zapier service, information about zaps can also be deduced, such as account usage, task history, active zaps and so forth.
When a trigger on Xively is fired, the notification gets to the recipient almost instantly. In this experiment, email accounts were configured as the notifying application. During the setting up process of zap, any number of recipients can be added hence all the interested personnel can be notified of an event. Figure 11 shows a sample email notification regarding the node voltage of chamber 1.
Apart from monitoring the environmental conditions of a storage area, the system also caters for the inventory of products. The tags read through NFC/RFID shield allows the products moving in and out of the chamber to be monitored. The corresponding inventory and tag movement within a storage area is notified through email. This information does not pass through Xively but sent directly to the recipient(s) through email server.
Fig. 11. An email notification about node voltage.
Fig. 12. Email notification regarding tag movement within transport facility Carrier 1.
Ⅴ. Conclusion
This paper has looked at an application of wireless sensor network, the pharmaceutical cold chain, and how it’s monitoring can be improved by using the Arduino sensor network and cloud service infrastructure. The system has proved to be reliable by being able to provide the information about storage environments in the cold chain in real time and resulting in more visibility of the chain from the manufacturing to the final distribution stage. The
alert feature of the sensor cloud allows notifications to be generated to prevent occurrences of critical conditions as well as identifying the process which become invalid. Internet of Things has big potential in revolutionizing the way we interact with our environment. With the expansion of embedded ICT infrastructure which has resulted in deployment of a wide range of embedded systems in our environment, the idea of IoT can be applied to these networks to obtain an interoperable and easy to manage sensor networks. Apart from flexible and easily manageable networks, the cloud services provide other benefits such as common processing, computational and analytical tasks on sensor data can be hosted online therefore freeing the devices from running heavy applications leading to low power consumption and longer network lifetime.
References
[1] J. Tennermann(2012), Cold Chain for Beginners, Available:http://www.pharmpro.com/articles/2012/
06/cold-chain-beginners
[2] R. H. Bishara, “Cold chain management - an essential component of the global pharmaceutical supply chain,”
American Pharmaceutical Rev., 2006.
[3]
Hazard Analysis Critical Control Point System (HACCP), Available:http://www.who.int/foodsafety/
fs_management/haccp/en/
[4]
Temperature Indicators, Available: http://ww
w.coldchaintech.com/products/temperature-mon itoring/temperature-indicators/[5]
Dataloggers, Available: http://www.sensitech.c
om/products/dataloggers[6] D. Stiles(2012), Improving the pharma cold chain, Available: http://www.globalcoldchainnews.com/
?p=4060
[7] “Australian UNIX systems user group newsletter,” AUUG Incorporated, vol. 12, p. 54, 1991.
[8]
The Internet Toaster, Available: http://www.liv
inginternet.com/i/ia_myths_toast.htm[9] Q. S. Fraser(1995), The Trojan Room Coffee
Pot, Available: http://www.cl.cam.ac.uk/coffee/
qsf/coffee.html
[10] K. Ashton(2009), That ‘Internet of Things' thing, Available:http://www.rfidjournal.com/articles/v iew?4986
[11] An Introduction to the internet of things (IoT), Lopez Research 2013.
[12] A. Narendran(2013), Wireless connectivity
chips shipment to surpass 5 billion by 2013,
Available: http://m2mwire.net/?p=1978 [13] K. Leung, Arduino: A Brief History, Available:http://www.kenleung.ca/portfolio/arduino-a-brie f-history-3/
[14] M. Rouse(2011), Web 2.0(or Web 2), Available:
http://whatis.techtarget.com/definition/Web-20- or-Web-2
[15] P. Anderson, What is Web 2.0? Ideas,
technologies and implications for education,
JISC Technology and Standards Watch2007.[16] T. Bray(2006), OSCON - Open Data, Available:
http://www.tbray.org/ongoing/When/200x/2006 /07/28/Open-Data
[17] T. Wozniaki, History of Near Field Communi-
cation, Available: http://www.nearfieldcommu
nicationnfc.net/history.html[18] HISTORY, Available: http://www.nfcnearfieldc ommunication.org/history.html
[19] G. Legg(2004), ZigBee: Wireless Technology
for Low-Power Sensor Networks, Available:
http://www.eetimes.com/document.asp?doc_id=
1275760
[20] P. R. Rakhecha and V. P. Singh, “Design storm estimation,” in Applied Hydrometeorology, pp. 219-243, 2009.
[21] Adafruit PN532 NFC/RFID controller shield for Arduino + Extras, Available: https://www.adafruit.
com/products/789
[22] Libelium, 3G +GPS shield for Arduino, Available: http://www.cooking-hacks.com/docu mentation/tutorials/arduino-3g-gprs-gsm-gps#st ep14
아벨산드라 (Abel Avitesh Chandra)
2012년 4월 : Bachelor of Engineering Technology in Electrical and Electronics University of the South Pacific
2014년 8월 : Master of Science in Engineering Department of Electronics Engineering Mokpo National University
<관심분야> Machine Learning, Wireless Sensor Networks, Computational Intelligence, Information Technology, Internet of Things
백 종 상 (Jong Sang Back)
2014년 2월 : 목포대학교 정보 전자공학과 공학사(공학인증) 2014년 2월~현재 : 목포대학교
전자공학과 석사과정
<관심분야> 무선네트워크 설 계, 해양무선통신, PLC
이 성 로 (Seong Ro Lee)
1987년 2월 : 고려대학교 전자공 학과 학사
1990년 2월 : 한국과학기술원 전 기 및 전자공학과 석사 1996년 8월 : 한국과학기술원 전
기 및 전자공학과 박사 1997년 9월~현재: 목포대학교 정
보전자공학과 교수
<관심분야> 디지털통신시스템, 이동 및 위성통신시스 템, USN/텔레매틱스응용분야, 임베디드시스템