ISSN: 2508-7894 © 2020 KODISA & KAIA.
KJAI website: http://www.kjai.or.kr
doi: http://dx.doi.org/10.24225/kjai.2020.8.1.1
A Development of Healthcare Monitoring System Based on Internet of Things Effective
Song-Eun KIM1, Ji-Hui MUN2, Kyoung-Sook KIM3, Min-Soo KANG4
Received: January 15, 2020. Revised: April 20, 2020. Accepted: June 05, 2020.
Abstract
The Recently there has been a growing interest in health care due to the COVID-19 situation. In this paper, we intend to develop a healthcare monitoring system to provide users with smart healthcare systems in line with the healthcare 3.0 era. The system consists of a wireless network between various sensors, Android smartphones, and OLEDs using Bluetooth, and through this, a health care monitoring system capable of collecting user's biometric information and managing health by receiving data values of sensors connected to Arduino. In conclusion, the user's BPM value was calculated using the heart rate sensor, and the exercise intensity can be adjusted through this. In addition, a step derivation algorithm is implemented using an acceleration sensor, and calorie consumption can be measured using the step and weight values. As such, the heart rate, step count, calorie consumption data can be transmitted to a smartphone application through a Bluetooth module and output, and can be output to an OLED for users who are not easy to access the smartphone. This healthcare monitoring system can be applied to various groups and technologies.
Keywords: Healthcare Monitoring System, Heart Rate, Acceleration, Applications, OLED Major classifications: Health Science, Internet of Things
1. Introduction
1There has been a growing interest in health care caused by the recent COVID-19 situation. As a result, the need for a smart healthcare system that can serve various groups is increasing. Even if you don't visit a hospital or go to a specialized institution, each individual is served regardless of time and place. The paradigm of healthcare has passed from the 1.0 era of public health to the 2.0 era of disease treatment and has now entered the 3.0 age of health life
1 First Author, Student, Department of Medical IT, Eulji University, Korea, Email: [email protected]
2. Student, Department of Medical IT, Eulji University, Korea, Email: [email protected]
3. Student, Department of Medical IT, Eulji University, Korea, Email: [email protected]
4. Corresponding Author, Professor, Department of Medical IT, Eulji University, Korea. Email: [email protected]
© Copyright: The Author(s)
This is an Open Access article distributed under the terms of the Creative Commons Attribution Non-Commercial License (https://creativecommons.org/licenses/by-nc/4.0/) which permits unrestricted non-commercial use, distribution, and reproduction in any medium, provided the original work is properly cited
since the 21st century. The purpose of the healthcare 3.0 era is not simply to treat and cure diseases, but to lead a healthy life through disease prevention and management. In this paper, we would like to develop a healthcare monitoring system that provides monitoring services for biometric signals to reduce time and cost problems through pre- management of diseases to users. (Kim, 2012)
2. Literature Review
In the "Design and Implement of U-Healthcare Monitoring System Based on SOA" recognized the growing need for U-Health Care services that can monitor and manage biometric information anytime and anywhere and identified problems with existing U-Healthcare services (Yun, Kim, & Park, 2009). In this paper, it was confirmed that the SOA-based u-healthcare monitoring system can be designed and implemented to facilitate the reconstruction of services. (Yun, 2009) In addition, Cho and two others,
"Study on the Implementation of Mobile Healthcare System
Using Hybrid App" organized a mobile healthcare system with gateway functions and monitoring functions based on hybrid apps to configure a ubiquitous healthcare monitoring system. (Cho, 2013) Imran Khan and six others,
"Healthcare Monitoring System and Transformation Monitored Data into Real Time Clinical Feedback Based on IoT using Raspberry Pi," suggested IoT-based intelligence that understands patients with chronic diseases or elderly patients refrain from visiting health institutions and continuously monitors their health accordingly. Data obtained from blood such as heart rate sensor and pressure sensor were monitored by Arduino UNO and Pi-camera and supplied to the database using Wi-Fi. (Khan et al., 2019) In this paper, we are trying to help measure health conditions in everyday life through the number of heart beats, the number of steps, and the calculation of calories, and we can monitor them. In particular, we would like to monitor smart healthcare in two ways to provide convenient services to users without smart devices or users with poor access to smart devices.
3. System Configuration 3.1. H/W configuration
The healthcare monitoring system in this paper is produced using the Arduino UNO board. This was used in this study because it is possible to test various sensors that are intended to be implemented as a microcontroller board based on ATmega328. (Lee & Cho, 2015) Using these Arduino boards, a DM447 heart rate measurement sensor is used to measure the heart rate through the healthcare monitoring system. The light from the LED in the cardiac sensors measures the heart rate by taking advantage of the fact that the amount of light reflected when blood flow increases during the heart rate. To measure the heart rate, first measure the heart rate/pulse, then calculate the pulse for one minute to obtain beats per minute, and each time the heart pumps blood, the resistance value of LDR increases.
These resistance variations are converted using an OP-AMP using a signal conditioning circuit. (Webster, 1997)
Figure 1: Axis direction of MPU-6050
The MPU-6050 is a six-axis sensor like Figure 1, with acceleration sensors, angular velocity sensors, and temperature sensors, and temperature sensors are not used in this project. Each channel has a built-in Analogue to Digital Converter (ADC), and the connection with Arduino is connected via a 12C bus interface. An algorithm was designed to measure the amount of variation in the accelerometer, analyze the movement between two points over time, and measure the variation value of the movement to determine that it was hung if the value exceeded any or more. Next, Bluetooth is an NFC technology that sends and receives data through a 2.4GHz wireless link and connects the above sensors to Android phones and OLEDs to collect biometric information of users in real time and implement a monitoring system. OLED stands for organic light emitting diodes and is made of panels that emit light on their own without needing backlight like LCDs. Because OLEDs do not have backlight brightness, they operate at low power and are suitable for IoT or wearable devices.
3.1. S/W configuration
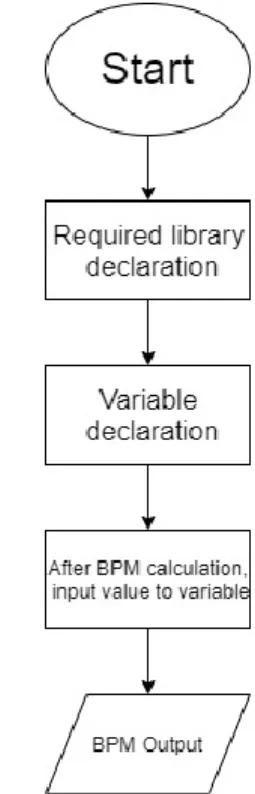
The healthcare monitoring system in this paper is produced using First, it is a flow chart that outputs the heart rate using DM447.
Figure 2: Heart rate output flow chart
With the above process, the heart rate can be obtained
and output to the monitor, and the user can check it through
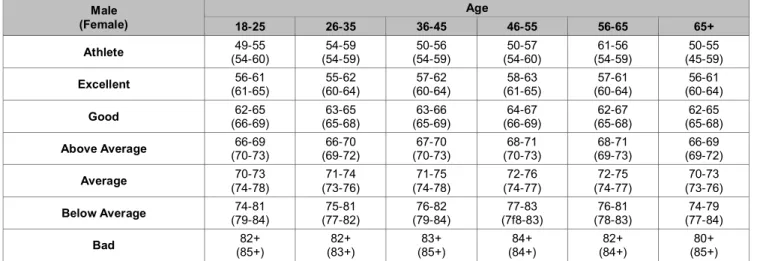
the UI. The appropriate heart rate according to gender is as follows.
Table 1: Male (Female) normal heart rate range
Male (Female)
Age
18-25 26-35 36-45 46-55 56-65 65+
Athlete 49-55
(54-60)
54-59 (54-59)
50-56 (54-59)
50-57 (54-60)
61-56 (54-59)
50-55 (45-59)
Excellent 56-61
(61-65)
55-62 (60-64)
57-62 (60-64)
58-63 (61-65)
57-61 (60-64)
56-61 (60-64)
Good 62-65
(66-69) 63-65
(65-68) 63-66
(65-69) 64-67
(66-69) 62-67
(65-68) 62-65
(65-68)
Above Average 66-69
(70-73) 66-70
(69-72) 67-70
(70-73) 68-71
(70-73) 68-71
(69-73) 66-69
(69-72)
Average 70-73
(74-78)
71-74 (73-76)
71-75 (74-78)
72-76 (74-77)
72-75 (74-77)
70-73 (73-76)
Below Average 74-81
(79-84)
75-81 (77-82)
76-82 (79-84)
77-83 (7f8-83)
76-81 (78-83)
74-79 (77-84)
Bad 82+
(85+)
82+
(83+)
83+
(85+)
84+
(84+)
82+
(84+)
80+
(85+)
Using normal heart rate range in Table 1, users can apply it in many places, which can also be used to control the intensity of exercise. To control the intensity of exercise, it is recommended to measure the target heart rate. The target heart rate measurement expression is as follows.
(Maximum Heart rate - Heart rate when stabilized)
* exercise intensity (%) + Heart rate when stabilized In order to calculate the above equation, one must know the maximum heart rate and intensity of exercise. First of all, the formula for maximum heart rate can be obtained by dividing the average person and the athlete.
Table 2: Formula for maximum heart rate
Public maximum heart rate 220-age Athlete maximum heart rate 205-age / 2
Exercise intensity can be set differently depending on the goal of exercise.
Table 3: Formula for exercise intensity
Improving athletic ability High intensity 85-100%
Improving cardiopulmonary
endurance Medium intensity 70-85%
Weight loss Low, Medium
intensity 60-70%
First workout Low intensity 50-60%
The above Table 2 and Table 3 provide customized health care services by setting the target heart rate by utilizing the heart rate measured using the heartbeat sensor.
This is a flow chart for measuring steps using an acceleration sensor.
Figure 3: Step Measurement Flow Chart
Figure 4: Method for measuring the number of steps of MPU-6050
Figure 4 shows a motion algorithm that judges to walk using a variable range of acceleration. To measure the variance of a given value above a certain value, a processing threshold such as a threshold is required. In this way, if the graph of acceleration fluctuation exceeds the threshold, which is the reference point, it is judged that you have walked. The formula for measuring the variance of the most basic vector value is as follows.
dis = √(𝑥1− 𝑥0)2+ (𝑦1− 𝑦0)2+ (𝑧1− 𝑧0)2 After calculating the number of steps with the MPU- 6050, the calculation formula for measuring the calorie consumption according to this is as follows.
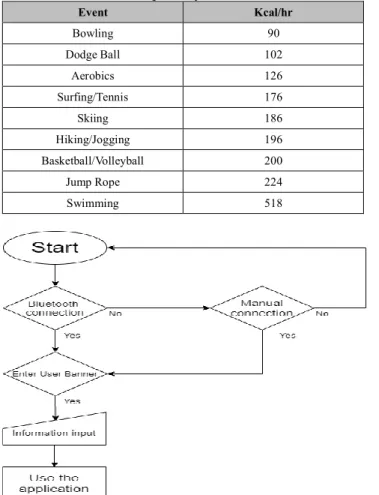
weight × 𝑠𝑡𝑒𝑝𝑠 10000× 5.5 Table 4: Calorie consumption by exercise
Event Kcal/hr
Bowling 90
Dodge Ball 102
Aerobics 126
Surfing/Tennis 176
Skiing 186
Hiking/Jogging 196
Basketball/Volleyball 200
Jump Rope 224
Swimming 518
Figure 5: Bluetooth Connection Flow Chart
Through this, you can calculate the calorie consumption
* Hr by exercise and calculate the calorie consumption by
step, as well as check the calorie consumption by exercise.
The following is a flow chart for connecting Bluetooth.
When Pseudo Code is written through the above S/W configuration, it is as follows.
// Measure heart rate
#define Interrupts
// Set low level interrupt for BPM calculation
#include <headerfile>
// Library Declaration for the Use of Heartbeat Sensors
Variables declaration;
// Declaration of variables void setup() {
Serial.begin(9600);
// Set serial communication speed to output heart rate
if (When the pulsesensor start) { Print something;}}
// Print out text when heart rate sensor starts void loop() {
BPM calculation // Calculate BPM value
if (When heart rate is recognized) Print BPM;
// BPM output when heart rate is recognized // Measure MPU6050 step
#include<headerfile>
// Add MPU6050 HeaderFiles
#include<MPU6050>
// Declare object reference variables that can write MPU6050 classes
float xavg,yavg,zavg;
// Record variables void setup() { Wire.begin();
// I2C initialization Serial.begin(115200);
// serial monitor initialization Accelgyro.initialize();
// acceleration initialization Adjust_offset ;
// offset initialization Void loop() {
Calculation
// Calculation by Sensor
If (When Walking) { Calling Callback ; } // Call each time walk Count } } // Step counting
// Connect Bluetooth
#include <SoftwareSerial.h>
// Call the serial communication library SoftwareSerial BTSerial(Rx Pin, Tx Pin);
// SoftwareSerial (Rx, Tx) Settings
4. Results and Discussion
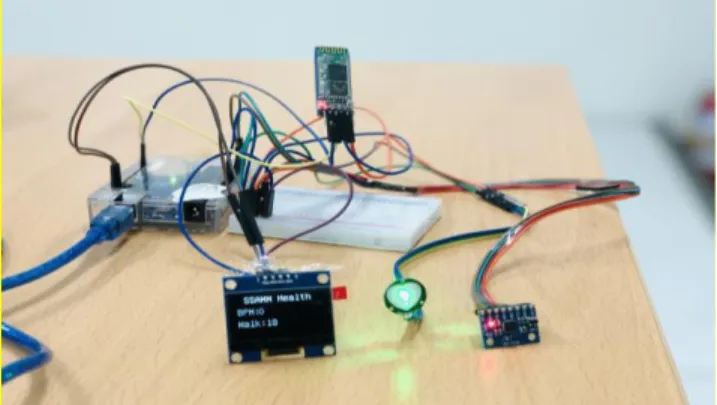
In this paper, a wireless network was formed between various sensors, Android smartphones and OLEDs using Bluetooth, and through this, a healthcare monitoring system was implemented that can collect biometric information and manage the health of users by receiving data values of sensors connected to Arduino.
Figure 6: Healthcare Monitoring System
The system in Figure 8 collects user data through two sensors. First, the user's health can be managed by measuring the heart rate through the heart rate sensor, and an alarm can be given and an exercise intensity can be adjusted when an emergency occurs. The existing monitoring system using a heartbeat had a problem of setting the overall average section rather than tailoring it to the individual user.
In order to improve this problem, the heart rate section is measured according to the user's age, gender and exercise status to provide a stable heart rate section. In order to control exercise intensity using these heart rate data, when not in exercise state, gender is distinguished, and a different color graph is displayed for each range through UI. If not, adjust the exercise intensity according to the user's condition.
Secondly, the number of steps can be derived by using an acceleration sensor. The calorie consumption can be measured using the derived steps and the user's body weight.
At this time, the user can enter the target number of steps and calorie consumption, and effective exercise is possible.
Figure 7: Heart rate, steps serial monitor output Figure 9 shows the user's heart rate and steps output to the serial monitor. Arduino's serial monitor allows you to check the BPM's values and steps.
Using the figures identified on the serial monitor, the heart rate, steps, and calories are calculated through Bluetooth communication. It monitors the health status of users in real time to help them measure and manage their health, and adjust the intensity of exercise depending on the health status of users. In addition, when a user's BPM reaches a certain section, it is recognized as an emergency situation and can be quickly rescued by sending user information and location data. These functions are implemented through the application, and in order to reduce the hassle of having to use a smartphone every time to check health information, the user's biometric information is also printed on OLED for more convenient real-time monitoring.
Figure 8: Mobile application execution screen In this way, the user's biometric information and health information are transmitted in real time and output to the application and the OLED. As a result, the user's biometric information and health information are continuously stored and managed to provide customized services to the user and following pages should begin 1.0 inch (2.54 cm) from the top edge. On all pages, the bottom margin should be 1-3/16 inches (2.86 cm) from the bottom edge of the page for 8.5 x
void setup(){
Set transmission speed of serial monitor and Bluetooth module; }
// Set transfer rate after initialization void loop(){
if (BTSerial.available()) Serial.write(BTSerial.read());
// Output to Receive Data SerialMonitor if (Serial.available())
BTSerial.write(Serial.read()); }
// Output to Receive Data Bluetooth Serial
11-inch paper; for A4 paper, approximately 1-5/8 inches (4.13 cm) from the bottom edge of the page.
5. Conclusions
In the wake of the healthcare 3.0 era, more and more people are seeking to lead a healthy life by preventing diseases, raising the need for health care services without restrictions on time and space. Accordingly, the healthcare monitoring system was studied in this paper, focusing on these consumer needs. We calculated the user's BPM value using a heart rate sensor, which can control the intensity of movement. In addition, the step elicitation algorithm has been implemented using acceleration sensors and calorie consumption can be measured using the step and weight values. As such, it is possible to print heartbeat, gait, and calorie consumption data to smartphone applications and OLEDs through Bluetooth modules. However, future research plans to supplement and implement this information because it requires a lot of power consumption and internal battery capacity to receive and continuously monitor information from users in real time.
These healthcare monitoring systems can be applied to a variety of groups and technologies. For example, it can be applied to elderly people with dementia and children's groups, as well as elderly and single-living senior citizens, and technology can be applied to sporting goods, daily necessities and various other things. Currently, researchers in this paper plan to study smart mountain climbing sticks
that can combine healthcare monitoring systems with hiking sticks to provide convenient and customized services for hikers when hiking. Smart mountaineering sticks will be easier and more appropriate to deal with the various variables that occur when hiking, as the number of hikers has increased due to the prolonged COVID-19 crisis.
References
Cho, Y. H., Kim, S. W., & Jeong, P. S. (2013). A Study on the Implementation of Mobile Healthcare System using Hybrid App. Journal of the Korea Institute of Information and Communication Engineering, 17(2), 503-514.
Imran. K., Kamran, Z., Asif, M., Waqar, U., Muhammad, A., Saif- ul-Islam, & Kim, H. J. (2019). Healthcare Monitoring System and transforming Monitored data into Real time Clinical Feedback based on IoT using Raspberry Pi, 2019 2nd International Conference on Computing, Mathematics and Engineering Technologies (iCoMET), 2, 1-6.
Kim, K. M. (2012). Implementation of Patient Monitoring System based on Mobile Healthcare. Journal of The Korea Society of Computer and Information, 17(12), 12-21.
Lee, I. G., & Cho, M. G. (2015). Arduino Based Smart Home System for the Elderly Living Alone. IEMEK J. Embed. Sys.
Appl, 10(5), 307-315.
Webster, J. (1997). Design of pulse oximeters (pp. 13-20), London, UK : CRC Press
Yun, S. H., Kim, D. H., & Park, J. T. (2009). Design and Implementation of U-Healthcare Monitoring System Based on SOA. Journal of Korean Institute of Communications and Information Sciences, 34(10B), 988-993