* Corresponding Author: [email protected]
Manuscript received November 05, 2020 / revised December 04, 2020 / accepted December 04, 2020
1) 호남대학교 경영학과 제1저자 2) 호남대학교 경영학과 교신저자
1. Introduction
Along with the growth of fresh e-commerce, the fresh food industry in China
A Study of Cold Chain Logistics in China:
Hybrid Genetic Algorithm Approach
1 )중국 콜드체인 물류에 관한 연구: 혼합유전알고리즘 접근법
진 성
1), 장 은 미
2)*(Xing Chen and Eun-Mi Jang)
요 약 본 연구에서는 중국에서 유통되고 있는 냉장식품 (-1℃ to 8℃)에 대한 콜드체인 물류 (Cold chain logistics: CCL) 모델이 개발되었다. CCL 모델은 분배센터 (Distribution center: DC)와 배 포대상지점 (Distribution target points: DT)으로 구성되어 있으며, CCL 모델의 목적함수는 모든 유통 업체의 총 유통경로를 최소화하는 것이다. 목적함수를 통한 최적결과 도출을 위해 혼합유전알고리즘 (Hybrid genetic algorithm: HGA) 접근법을 제안한다. HGA 접근법은 개선된 K-means 방법과 유전 알고리즘을 결합하여 구성된다. 사례연구에서는 유통경로와 유통 가능한 거리 기준으로 CCL 모델에 대해 3개의 시나리오를 고려하였으며, 이를 제안된 HGA접근법을 사용하여 해결하였다. 결과분석을 통해 제안된 HGA접근법을 사용할 경우 유통비용이 절감되고, 마일리지가 약 19%, 20%, 16% 정도 감소됨을 확인하였다.
핵심주제어: 콜드체인 로지스틱스, 분배센터, 분포 대상지점, 하이브리드-유전 알고리즘, K-means 알고리즘
Abstract A cold chain logistics (CCL) model for chilled food (-1℃ to 8℃) distributed in China was developed in this study. The CCL model consists of a distribution center (DC) and distribution target points (DT). The objective function of the CCL model is to minimize the total distribution routes of all distributors. To find the optimal result of the objective function, the hybrid genetic algorithm (HGA) approach is proposed. The HGA approach was constructed by combining the improved K-means and genetic algorithm (GA) approaches. In the case study, three scenarios were considered for the CCL model based on the distribution routes and the available distance, and they were solved using the proposed HGA approach. Analysis results showed that the distribution costs and mileage were reduced by approximately 19%, 20% and 16% when the proposed HGA approach was used.
Keywords: Cold chain logistics; Distribution center; Distribution target point, Hybrid genetic algorithm, K-means algorithm
has maintained a growth rate of more than 50% for five consecutive years, from 2011 to 2016, that is higher than the industry average of 30% (Wu et al., 2018). To ensure freshness and low loss rate, fresh agricultural products need cold chain logistics (CCL) (Yuan, 2015).
The CCL involves temperature-controlled transport and storage system of for refrigerated goods, thus maintaining food quality and safety (Montanari, 2008; Taoukis et al., 2016).
In general, refrigerated food can be divided into three categories based on storage temperature: frozen at –18℃ or below, cold-chilled at –1℃ to 8℃, and exotic-chilled at 10℃ to 15℃ (Fernie and Sparks, 2004).
Taking into consideration strawberry cold chain as an example in the United States, the temperature was generally fluctuating from 0.7℃ to 3.7℃ during pre-cooling, cold storage, transport, and retail (Pelletier et al., 2011). In Japan, the temperature of refrigerated iceberg lettuce was found to fluctuate in the range of 3℃ to 15℃ during transporta (Koseki and Isobe, 2005).
Compared with frozen food and exotic chilled food, the research on chilled food has attracted more attention of scholars because of the need to sell within a short period and their sensitivity to temperature (Ndraha et al., 2018). Fruit and vegetable products have always been the main subjects of research.
Therefore, in this study, we analyze the CCL for the chilled food.
The use of temperature-controlled CCL can significantly reduce physiological metabolism activities, nutrient consumption, and water loss, ensuring freshness and quality of chilled food. For example, in winter, fruits of Hainan Province are transported to other cities, covering more than 2700 kilometers in China, by using various delivery methods
(Balakrishnan et al., 2016).
Between 2010 and 2015, the number of registered refrigerated transport trucks increased from 26,000 to 81,000 (Teng and Chen, 2017). It is estimated that by 2025, the demand for cold chain products will be expected to be increased by 18.8%, and the demand will be increased from 200 million tons to 450 million tons (Duan, 2014). So we can know that the CCL industry in China has entered a period of rapid development in recent years. With the fast scaling of the CCL industry, the equipment cost of CCL has increased, and the distribution pressure of CCL companies has also increased. However, the loss rate of fresh food during transportation is 20 – 25% in China, far higher than the loss rate of 5% in developed countries (Cai et al., 2010; Yun and Tiao, 2017).
In order to keep freshness in a short time, and cope with the transportation demand of chilled food, the problem of designing an efficient transportation route needs to be solved. By optimizing the CCL distribution path, delivery time can be shortened and customer satisfaction can be improved. It can also save costs and improve operational efficiency (Zhang et al., 2018). A reasonable and efficient distribution route of the CCL is an effective means to solve this problem(
Yun, 2020; Kang and Lee, 2018). Therefore, an efficient CCL is needed.
Genetic algorithm (GA) approach is used to solve the problems of optimization of distribution routes in many studies. Zhou (2016) proposed a vehicle routing optimization model of the CCL with simultaneous delivery and pickup and used a GA to solve model. Lan et al. (2015) considered the road traffic problems based on the CCL and developed an improved GA to verify the effectiveness of the model. Wang et
al. (2018) constructed a low-carbon CCL model considering the optimization of distribution routes and proposed a cyclic evolution GA. It can be concluded that GA is an effective method for solving the optimization path problem. So, we decide to use GA method to design an efficient distribution route in the CCL model. However, these studies only analyzed the improved offspring populations in GA approach.
In our study, we aim to find a better solution to improve the quality of initial population in GA.
Thus, K-means method is considered.
K-means method is a clustering method that was first proposed by Punj and Steward (1983). Clustering methods are classified as hierarchical and non-hierarchical (Johnson et al., 2012). K-means method has a higher rate of classification for clustering the simulated and real-world data (Balakrishnan, 2016). The clusters are created by associating every observation with the nearest mean. the centroid of each clusters becomes the new mean. Thus similar values are clustered together. The initial population is randomly generated in traditional GA approach, whereas in K-means method, excellent generations are clustered. Therefore, it is possible to generate an excellent initial parent population by combining GA and K-means approaches.
Thus, we hope to generate a superior initial population by combining those two methods.
This study analyzes the status of CCL in China. The purpose is to find an effective way to prevent transportation loss and ensure quality of CCL in China. In the CCL model, our purpose is to optimize the distribution routes. In methodology, we propose a hybrid genetic algorithm (HGA) approach which is a combination of the improved K-means and GA. The purpose of combining these two methods is to effectively utilize the powerful classification capability of K-means and the
exploration capability of GA. We hope to find better solutions using the HGA approach in the CCL. Moreover, there is no research on combining GA and K-means methods to solve distribution route problems.
The remainder of the paper is organized as follows. Section 2 presents the weakness of the CCL in China. Section 3 introduces the structure of the CCL model. Section 4 explains the CCL model using a mathematical formulation. Section 5 details the HGA approach for solving the mathematical formulation.
Section 6 describes the performance of the CCL model in numerical experiments. Section 7 provides the conclusion.
2. Weakness of CCL in China
The phenomenon of “chain breakage" in the process of the CCL is serious in China. The availability CCL equipment is inadequate, the pre-cooling is not systematic, and the transportation capacity of cold storage is unworkable. These problems lead to substantial loss in the circulation and high logistics costs. The factors restricting the development of CCL are as follows:
2.1 Poor Infrastructure
The main production areas are still dominated by traditional civil cold storage in China (Korn and Graubard, 1999; Victora et al., 2011). ) and there are fewer refrigerated vehicles used for chilled food. Existing cold chain transport vehicles mostly use mechanical refrigeration system. The defects of this system are complex structure and heavy energy consumption. Thus, the temperature and humidity fluctuation range in the cold chain transportation is increased, and
the quality of the chilled food significantly affected (Malta et al., 2015).
2.2 Insufficient Technology Integration
Chilled food are mostly agricultural products, that are perishable. Therefore, higher transportation efficiency and fresh-keeping conditions are required in the distribution process. However, the CCL in many areas still involve pre-cooling after harvest. The lack of technological measures has been causing rot and deterioration in the circulation link (Marchioni et al., 2013).
In contrast, the use of modified atmosphere storage for chilled food in developed countries has led to more than 70% of the total output (Vitolo et al., 2006).
2.3 Lack of Laws and Regulations
The laws and regulations governing the CCL are not updated in China, and the standard system is inadequate (Bailey et al., 2010). Presently, only the national standard of
“CCL Service Specification for Aquatic Products" has been implemented reference standard for the CCL process and packaging specifications is not prevalent in China. There are other shortcomings as well, such as low market acceptance, narrow scope of application, and high costs.
2.4 Backward Information Flow
The construction of the CCL information platforms is lagging in China with the platform coverage being relatively narrow. There is a lack of information asymmetry between the cold storages, thereby leading to critical setbacks. These factors cause low logistical efficiency and reduced sale of chilled food.
3. CCL model
Compared with general supply chain, the CCL has special characteristics. First, chilled food has apparent particularities, including perishability, changeable and flexible. Second, the difficulties inherent to increasing the profit from chilled food by operating the supply chain within a short time (Merkuryev et al., 2009). It is difficult to apply the general supply chain theories to the CCL.
Therefore, an effective delivery process is vital, and the CCL model aims to solve this issue.
The CCL model has distribution centers (DC), and distribution target points (DT). The DC has a certain number of delivery personnel, and these delivery personnel complete the delivery tasks according to the DT of the determined location. Each delivery personnel independently selects the delivery order according to the assigned target. They start from the DC, and return after all the delivery tasks are completed. In the process of delivery, the actual time of reaching the DT is ignored. The time spent on the road is only considered. It is necessary to design the delivery path with the shortest delivery route and time.
4. Mathematical Formulation
The following assumptions should be considered for the mathematical formulation of the CCL model:
- The coordinate positions of the DC and the DT are determined and known.
- The distance between the DC and each DT is known, and the distance between each DT is known.
- The number of delivery personnel is determined and the delivery speed of the staff is constant.
- In a delivery plan, the DT is only assigned to one delivery personnel, and it is not repeated.
- In one delivery plan, all DTs must complete the delivery.
- Considering the delivery capacity of the delivery personnel, there is a certain upper limit, and the delivery tasks of each delivery personnel should be similar.
- The weather, road conditions and other factors are not considered (Park et al., 2012).
The index sets are as follows.
-Index Set
: distribution center in each delivery route plan
: distribution target points in each delivery route plan
: longest point in each delivery plan from the DC to each DT
: distance of distribution routes
: number of delivery route plan from the DC to each DT-Decision Variables
: takes the value of 1 if distribution center is opened and 0 otherwise in each delivery route.
: takes the value of 1 if distribution target point is passed and 0 otherwise in each delivery route.In the DC, there are several , .... and
, the DT are shown as , ...., and . The distance between each DC and DT is
. There areM
sequences in each deliveryroute plan, which means that the -th delivery clerk delivers his assigned delivery target in a certain order.
The objective function is to minimize the total distribution routes of all distributors (TD) in the CCL model, and its mathematical formulation is follows.
Minimize TD
=
(1) Subject to
≤
(2)
(3)
≥ (4)
(5)
∀∈
(6)
∀∈
(7)Equation (1) refers to the sum of the length of distribution routes, and
represents the sum of the distribution routes from the first DC to the last DT in each distribution route plan. In Equation (2),
represents the longest delivery path in each distribution plan. Equation (2) shows that the longest delivery path among the delivery personnel cannot exceed 30% of the average delivery path (Yang et al., 2010). Equation (3) shows that only one facility should be opened at each DC, but several DT are passed, and it is shown in Equation (4). Meanwhile, any DT must be delivered by a delivery personnel: any delivery personnel will only delivery a single target point in their delivery sequence, these are shown in Equation (5).
Equations (6) and (7) show that each decision variable should take a value of 0 or 1.
5. Proposed HGA Approach
In the CCL model, multiple delivery personnel are assumed to disperse from a distribution center. An efficient distribution plan should ensure that the distribution paths do not cross each other. The area assigned to each delivery personnel is a fan shape (De Benoist, 2008). Therefore, K-means approach is considered. K-means approach is a simple and efficient clustering algorithm. The traditional K-means randomly selects points in the data set as cluster centers, and then calculates cluster centers for each sample, and finally, it divides into clusters corresponding to the cluster center with the smallest distance (Brasil, 2013). For each cluster, its clustering center is re-calculated, and the new clustering center generates a new distance from each sample. This iteration is repeated until stop condition is reached.
In the proposed HGA approach, instead of randomly generating initial clustering centers, the following steps are taken. When selecting the first clustering center and recording as ( = 1), select the point farthest from the DC, recording as , and then assume that centers have been selected ( ). The further away from the current cluster centers, the higher the probability of becoming the center. Calculate the shortest distance between each sample and the current clustering center, expressed by
, and then calculate the probability of selection as the next clustering center. In other words, it is the distance dispersion of the optimal routes. The process of modified K-means algorithm is as follows:1) Select
cluster centers repeatedly and record them as {, ...., }.2) The remaining samples are classified into separate clusters according to the minimum distance from the initial clustering center is generated, and its clustering center is recalculated for each sequence.
3) The new cluster sequence is generated based on the new distance from the DC.
This process is repeated until there is no change.
4) All the distribution sequences are determined according to the number of each cluster.
In the improved K-means approach, the cluster centers are as far away as possible from the current center, and the crowding and malformed distribution of clusters are avoided. Meanwhile, the clusters are distributed along with the periphery of the DC that controls the size of the clusters.
As mentioned above,
cluster centers will form a polygon around the DC point. When the distance of newly generated cluster center is less than its distance from the current cluster center, the new cluster center will move inside the polygon. For example, when the distance between two adjacent cluster centers is the same as the distance between the cluster centers and the distribution center, then these three points will form a regular triangle. Therefore, all cluster centers will form a hexagon, and the value of cannot be greater than 6.When the steps of modified K-means algorithm are completed, the steps of GA are implemented. The next steps are as follows:
5) The encoding of the DT is implemented, the distribution sequences
are obtained, each DT is encoded in multiple segments.6) The initial population is produced after
encoding, and each refers to a distribution route plan.
7) The fitness of each individual is evaluated, and the top 20% is selected.
8) Each from the new population is produced from the ordered crossover and mutation operator (Yun et al., 2019). Crossover rate is 0.5, and mutation rate is 0.1.
9) The iteration is continued until the stop condition is reached
6. Numerical Experiments
Taking into consideration Shanxi province in China as an example, the production and consumption of apples in China account for more than 50% of the world. Among them, the arid area of northwest China accounts for two-thirds of country’s apple cultivation area.
Specifically, the Shanxi province in China is the largest producer accounting for 25% of the apple production (Baike Knowledge, 2020). The location of Shanxi province is shown in Fig. 1.
Fig. 1 Location of Shanxi province
The distribution of apple production in Shanxi province is shown in Fig. 2. Most apple producers in this province have only a few professional delivery vehicles and simple CCL facilities, and endure complex transportation routes and high costs.
Fig. 2 Distribution of apples in Shanxi province
Compared with the fixed transportation route of the export apple CCL and the large demand from a single customer, the domestic apple CCL faces a complicated distribution route and large number of small customers.
More than 95% of enterprises are unable to achieve full CCL.
Any distribution location in Fig. 2 can be regarded as a DC. Within the range of the farthest distance that can be delivered, 40 DTs are set. When the traditional GA approach is used to design the distribution path, the initial population is 300, the proportion of excellent individuals is 30%, crossover rate is 0.5, mutation rate is 0.1, the total number of generations is 10,000, and the total mileage is 830.512. The result is shown in Fig. 3.
Fig. 3 Traditional GA Results
When the proposed HGA approach is implemented, the initial population is 300, the
proportion of excellent individuals is 30%, the crossover rate is 0.5, mutation rate is 0.1, and total number of generations is 10,000.
The coordinates of the DT are represented within horizontal and vertical coordinates (0, 100), and there are 40 discrete points that are randomly generated. The position of DC is set to (50, 50), and the number of distribution personnel is set to 4. It means that four distribution areas are created.
Python 3.5 programming version is used to implement in an IBM compatible PC of 3.4GHZ.
Three scenarios of different sizes are considered in the HGA approach. In first scenario, 40 points are divided into four clusters according to the distribution plan.
Considering the uneven distribution of DT, the 10 DTs which distributed on the upper left of the DC are removed.
After the calculation is completed in Scenario 1, the total distribution route mileage is 669.768. The distribution route of Scenario 1 is shown in Fig. 4.
Fig. 4 Proposed HGA Results in Scenario 1
Compare with the result in Fig. 3, the scattered path becomes more concentrated, and the distribution mileage is reduced by approximately 19% (=(830.512-669.768)/830.512).
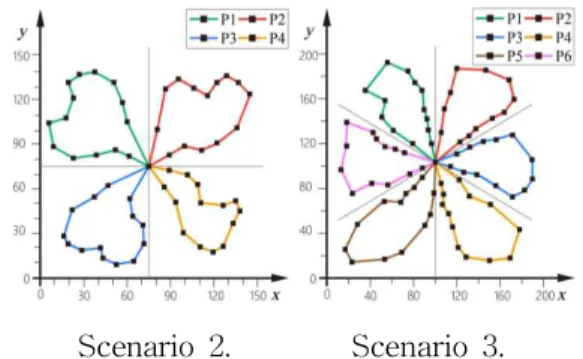
To verify the stability of the proposed HGA approach, two other scenarios are considered. In the second and third scenarios, the number of DTs is increased to 60 and 80 in the same DC, and the distribution distance
is increased to 150 and 200, respectively. The distribution path is redesigned
As shown in Fig. 5, the initial population of Scenario 2 is 500 and that of Scenario 3 is 1000. The discrete points of 60 and 80 are randomly generated within the horizontal and vertical coordinates, (0, 150) and (0, 200), respectively. The position of DC is set to (75, 75), (100, 100), and the number of distribution personnel is set to 4 and 6.
Scenario 2. Scenario 3.
Fig. 5 Proposed HGA Results in Scenarios 2 and 3
As shown in Fig. 5, the distribution mileage is reduced by approximately 20%
(=(1107.349-885.879)/1107.349) and 16%
(=(1245.768-1046.445)/1245.768) in Scenarios 2 and 3, respectively. Thus, it is confirmed that the HGA approach is an effective way to address the issues in distribution routes.
However, the K value and discrete point of the initial cluster is manually set, and the method of dividing the classification area affects the result. This is a limitation of the HGA approach that must be addressed in further future studies.
7. Conclusion
In this study, the CCL model for chilled food in China was developed. The two differences between the CCL and general
supply chain were that the chilled food is perishable and there were difficulties in increasing the profit through operating the supply chain management in a short time (Merkuryev et al., 2009). Therefore, an effective delivery process is vital.
The proposed CCL model included distribution center (DC), and distribution target points (DT). A HGA approach which combines the improved K-means with GA approach was adopted. In the HGA approach, instead of randomly generating initial clustering centers, excellent initial parent population was produced. The numerical experiments were implemented with Shanxi Province in China as an example, in three scenarios.
The results of three scenarios showed that the scattered path becomes more concentrated, and the mileage of distribution routes are saved. We could confirmed that the performance of HGA approach provids better results than the traditional GA approach. The mileage of the three distribution routes were reduced by 19%, 20%, and 16%. However, the HGA approach has some limitations in setting the initial value and classification area. In future research, reasonable setting of initial value and effective area classification will be considered.
References
Bailey, R. L., Dodd, K. W., and Gahche, J. J.
(2010). Total folate and folic acid intake from foods and dietary supplements in the United States: 2003–2006,
The American Journal of Clinical Nutrition
, 91(1), 231–237.Balakrishnan, P. V. S., Cooper, M. C., Jacob, V.
C., and Lewis, P. A. (2016). Comparative performance of the FSCL neural net and
K-means algorithm for market segmentation,
European Journal of Operational Research
, 93, 346-357.Baike Knowledge. (2020).
Introduction of Shanxi Province apple industry, https://baike.baidu.c om/
item/%E9%99%95%E8%A5%BF%E8%8B%B9%E6%9E%9C/1485193?fr=aladdin (Accessed on Oct. 21, 2020)
Brasil, amd Ministério, da Saúde. (2013).
Programa Nacional de Suplementação de Ferro, Manual de Condutas Gerais,
Ministério da Saúde, Brasilia.Cai, X., Chen, J., and Xiao, Y. (2010).
Optimization and coordination of fresh product supply chains with freshness-keeping effort,
Production and Operations Managemen
t, 19(3), 261-278.De Benoist, B. (2008). Conclusions of a WHO Technical Consultation on folate and vitamin B12 deficiencies,
Food and Nutrition Bulletin
, 29(2), 238–244.Duan, X. (2014). Research on multi-objective optimization vehicle routing problem with time windows of CCL, Master Thesis, Shenyang:
Northeastern University.
Fernie, J., and Sparks, L. (2004).
Logistics and retail management: Insights into current practice and trends from leading experts,
London and Sterling, VA: Kogan Page.Johnson, R. A., and Wichern, D. W. (2012).
Applied multivariate statistical analysis
, Prentice-Hall, Upper Saddle River, NJ.Kang, Ch. W., and Lee, S. J. (2018). A study on the influence of SCM execution factors on competitive advantage through business agility: Focused on display industry,
Journal of the Korea Industrial Information Systems Research
, 23(3), 35-48.Korn, E. L., and Graubard, B. I. (1999).
Analysis of health surveys
. Wiley, NY.Koseki, S., and Isobe, S. (2005). Prediction of pathogen growth on iceberg lettuce under real
temperature history during distribution from farm to table,
International Journal of Food Microbiology
, 104, 239-248.Lan, H., He, Q., and Bian, Z.. (2015) Distribution routing optimization of cold chain logistics with consideration of road traffic conditions,
Journal of Dalian Maritime University
, 41(4), 67-74.Malta, D. C., Andrade, S. S. C. A., and Stopa, S. R. (2015). Brazilian lifestyles: National Health Survey results, 2013 Brazilian lifestyles: National Health Survey results, 2013.
Epidemiol Serv Saúde
, 24(2), 217–226.Marchion,i D. M. L., Verly-Jr, E., and Steluti, J.
(2013). Folic acid intake before and after mandatory fortification: a population-based study in São Paulo, Brazil.
Cad Saúde Pública
, 29, 2083–2092.Merkuryev, Y., Merkuryeva, G., Piera, M., and Guasch, A. (2009).
Simulation-based case studies in logistics
, London, UK: Springer London.Montanari, R. (2008). Cold chain tracking: A managerial perspective.
Trend in Food Science and Technology
, 19, 425-431.http://www.ars.usda.gov/ba/bhnrc/fsrg. (Accessed on July. 22th, 2020)
Ndraha, N., Hsiao, H. I., Vlajic, J., Yang, M. F., and Lin, H. T. V. (2018). Time-temperature abuse in the food cold chain: review of issue, challenges, and recommendations,
Food Control
, 89, 12-21.Taoukis, P. S., Gogou, E., Tsironi, T., Giannoglou, M., Dermesonlouoglou, E., and Katsaros, G. (2016). Food cold Chain management and optimization.
In emerging and traditional technologies for safe, healthy and quality food
. Switzerland: Springer International Publishing.Teng, Y., and Chen, B. (2017). Seizing opportunities in China’s cold chain logistics.
China Bus. Rev. https://www.chinabusinessre
view.com/%20seizing-%20opportunities-%20in-
%20chinas-%20cold-%20chain-%20logistics/
(Accessed 16 September 2020)
Park, J. Y., Nicolas, G., and Freisling, H. (2012).
Comparison of standardised dietary folate intake across ten countries participating in the European Prospective Investigation into Cancer and Nutrition,
British Journal of Nutrition
, 108(3), 552–569.Pelletier, W., Brecht, J. K., do Nascimento Nunes, M. C., and Emond, J. P. (2011).
Quality of strawberries shipped by truck from California to Florida as influence by postharvest temperature management practices,
HortTechnology
, 21, 482-493.Punj, G., and Steward, D. W. (1983). Cluster analysis in marketing research: review and suggestions for applications,
Journal of Marketing Research
, 20(2), 134-148.Victora, C. G., Barreto, M. L., do Carmo Leal, M., and Lancet Brazil Series Working Group et al. (2011). Health conditions and health-policy innovations in Brazil: the way forward.
The Lancet
, 377, 2042–2053.Vitolo, M. R., Canal, Q., and Campagnolo, P. D.
B. (2006). Fatores associados ao risco de ingestão insuficiente de folato entre adolescentes,
Journal de Pediatr
, 82, 121–126.
Wang, S. Y., Tao, F. M., and Shi, Y. H. (2018).
Optimization of location-routing problem for cold chain logistics considering carbon footprint,
International Journal of Environment Research and Public Health
, 15, 87-102.Wu, W., Cronje, P., and Nicolai, B. (2018).
Virtual cold chain method to model the postharvest temperature history and quality evolution of fresh fruit-a case study of citrus fruit packed in a single carton,
Computers and Electronics in Agriculture
, 144, 199-208.Yang, Q., Cogswell, M. E., and Hamner, H. C.
(2010). Folic acid source, usual intake, and folate and vitamin B-12 status in US adults:
National Health and Nutrition Examination Survey (NHANES). 2003–2006.
The American Journal of Clinical Nutrition
, 91(1), 64–72.Yuan, X., Zou, P., and Zhu, J. (2015).
Development trend, problems and countermeasures for cold chain logistics industry in China,
Journal of Agriculture Science and Technology
, 17(1), 7-14.Yun, L. Y., and Tiao, J. X. (2017). Pricing and cold-chain service level decisions in a fresh agri-products supply chain with logistics outsourcing,
Computers and Industrial Engineering
. (111), 56-66.Yun, Y. S., and Chuluunsukh, A. (2019). Green supply chain network model: genetic algorithm approach,
Journal of the Korea Industrial Information Systems Research
, 24(3), 31-38.Yun, Y. S. (2020). Sustainable closed-loop chain model for mobile phone: Hybrid genetic algorithm approach,
Journal of the Korea Industrial Information Systems Research
, 25(2), 115-127.Zhang, L.Y., Gao, Y., Sun, Y. S., Fei, T., and Wang, Y. J. (2018). Application on cold chain logistics routing optimization based on improved genetic algorithm,
Automatic Control Computer Science
, 53(2), 169-180.Zhou, P. (2016). Heuristic ordered crossover operator for TSP,
Computer Engineering and Design
, 28(8), 1896-1897.진 성 (Xing Chen)
∙정회원
∙전남대학교 무역학과 경영학석사
∙조선대학교 경영학과 경영학박사
∙(현재) 호남대학교 경영대학 경영학과 조교수
∙관심분야: 물류/SCM, 유전알 고리즘, 생산최적화, 융합경영
장 은 미 (Eun-Mi Jang)
∙Tokyo Sanno대학교 경영학 학사
∙숭실대학교 경영학과 경영학석사
∙숭실대학교 경영학과 경영학박사
∙(현재) 호남대학교 경영대학 경영학과 조교수
∙관심분야: 진성 리더십, 인사·조직