IEG 환경지질연구정보센터
4
0
0
전체 글
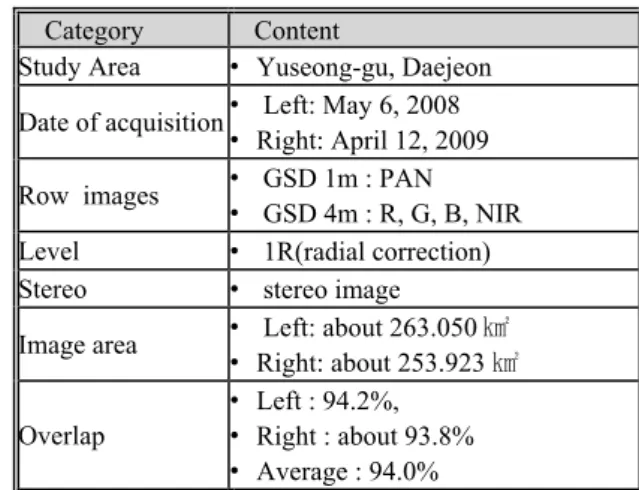
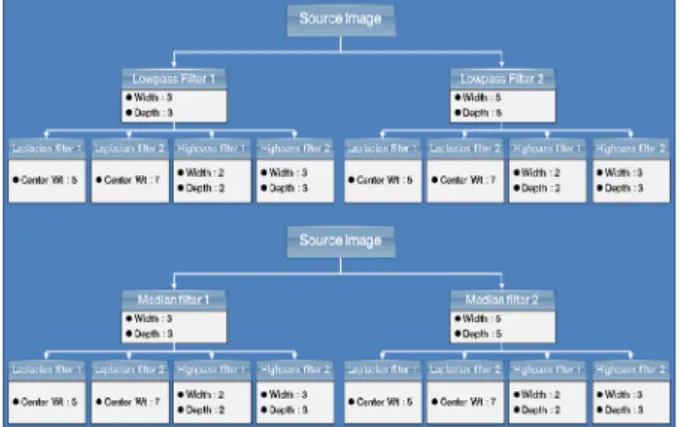
(2) KOMPSAT-2 images are able to obtain the 1m panchromatic images and 4m multispectral images. In this experiment the 1meter panchromatic and 4 meter multispectral stereo images, header information, and RPC(rational polynomial coefficient) data are used for the study area. Table 1 shows the specification of the KOMPSAT-2 images. The KOMPSAT-2 images are stereo images obtained from May 6, 2008 and April 12, 2009. The area of the left image is about 263.050 ㎢,, and that of the right image is about 253.923 ㎢. The overlap is about 94%. For the orientation analysis of the KOMPSAT-2 images, GCP and RPC information collected from a 1:1,000 digital map was used. The orientation analysis results are dX= ±1.49m, dY= ±1.09m, and dL= ±1.85m. They are better than ±2m, which is the absolute orientation accuracy of 1:5,000 digital map. In the study, orientation analysis was followed by the generation of a grid DEM(5m×5m) with epipolar images. For DEM interpolation algorithm, bilinear interpolation was used. Figure 4 DEM generated from KOMPSAT-2 images . Differential rectification was carried out with the generated DEM to make orthoimage. Bilinear interpolation was used as the interpolation of image resampling, which was done with 4 pixel units.. 2.3 Results of Experiment. The precision analysis of Thematic information extracted from each experimental case was conducted qualitatively and quantitatively. 1) Qualitative Analysis As for qualitative analysis, Thematic information extracted as original images and positioning information was extracted from each experimental case. Hydrosphere The hydrosphere failed to show sufficient differences before and after filtering. The border of the hydrosphere after filtering was extracted as an orthopedic form against the border before filtering.. 2.2 Methods of Experiment. Image filtering can be roughly segmented into image smoothing and edge detection. Because image division requires smoothing interrelations between adjacent pixels and clear extraction of edges of segmented objects, multiple filtering using both image smoothing and edge detection was applied. Image smoothing used Median Filter and Lowpass Filter, while edge detection used Laplacian Filter and Highpass Filter. As for methods of experiment, 16 experimental cases by association of critical values of parameters of each filtering technique were selected, were applied to filtering, and were analyzed for precision by extracting Thematic information from each image.. Figure 3. Results of Extraction - Hydrosphere Forest Before filtering, the forest was not easily extracted as an orthopedic form because of effects of adjacent grassland, vacant land, and shadow, but after filtering, could be extracted as an orthopedic form.. Figure 4. Results of Extraction – Forest Grassland As for grassland, a dark field was wrongly classified as forest before filtering, but after filtering, this incorrect classification was reduced. Figure 2. Experimental Cases.
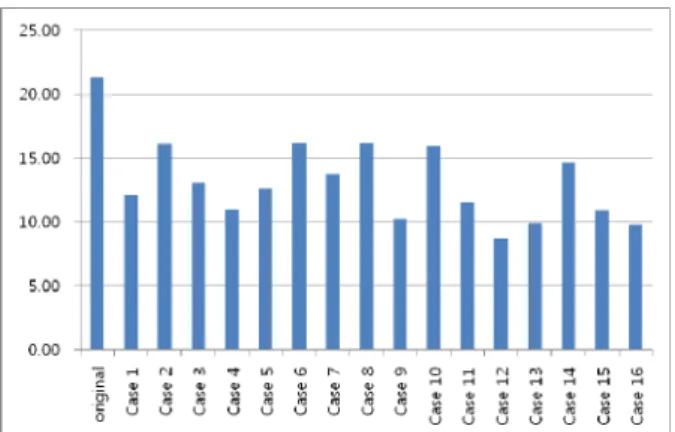
(3) Figure 5. Results of Extraction – Grassland. Figure 8. Results of Extraction – Raw Land. Shadow Because shadow was extracted from hydrosphere and forest, it was hard to classify shadow fields adjacent to a hydrosphere before filtering, but after filtering, shadows adjacent to hydrospheres and forest could be separated.. Buildings As buildings are classified by reference of LiDAR data, there was not a significant difference. Figure 9. Results of Extraction – Buildings Figure 6. Results of Extraction – Grassland Roads and Urban Area The results of Thematic information of roads after filtering showed an orthopedic form when compared to the images before filtering.. Based on the qualitative analysis, in general the Thematic information extracted after filtering was extracted orthopedically from form and borders when compared to that before filtering. 2) Quantitative Analysis. Figure 7. Results of Extraction – Roads and Urban Area Raw Land The Raw Land showed relatively similar classification results between before and after filtering.. As for quantitative analysis, the amount of error based on size on the basis the Thematic information produced as digitizing by using the original images from the Thematic information was extracted from each experimental case. The amount of error of the original images was 21.32% and that of experimental cases was between 8.72% and 16.22%, indicating that the amount of error was reduced in the latter. The amount of error of the hydrosphere and buildings showed less of a difference between before and after filtering, while the forest, grassland, and vacant land were reduced in the amount of error after filtering..
(4) design using object-oriented segmentation Algorithms: A move towards standardization, Expert System with Applications, 32, 616-624. Renaud Mathieu, Jagannath Aryal, "Object-oriented classification and Ikonos multispectral imagery for mapping vegetation communities in urban areas", Presented at SIRC 2005 –The 17th Annual Colloquium of the Spatial Information Research Centre University of Otago, Dunedin, New Zealand November 24th-25th 2005. Figure 10. Results of Quantitative Analysis 3. CONCLUSION. The results of application of image smoothing and edge detection filtering in order to improve precision of Thematic information by using object-based classification were as follows. First, the Thematic information extracted after filtering was orthopedically extracted from forms and borders when compared to that before filtering. Second, the amount of error of the original images was 21.32% and that of experimental cases was between 8.72% and 16.22%, indicating that the amount of error was reduced after filtering. References and/or Selected Bibliography References from Journals: Baatz, M., Benz, U., Dehghani, S., Heynen, M.,Holtje, A., Hofmann, P., Lingenfelder, I.,Mimler, M., Sohlbach, M., Weber, M., &Willhauck, G., 2004. eCognition Professional:User guide 4.; Munich: Definiens-Imaging.. G. M. ESPINDOLA, G. CAMARA, I. A. REIS, L. S.BINS, and A. M. MONTEIRO, 2006. Parameter selection for region-growing image segmentation algorithms using spatial autocorrelation, International Journal of Remote Sensing, 27(14): 3035-3040. Lee Hyeon-jik, 2008, How to Make Actual Orthoimages Using Multi-Dimensional Spatial Information, Journal of Korea Society of Surveying, Geodesy, Photogrammetry, and Cartography, No. 3 of Vol. 26,pp241∼253. Lee Hyun-jik, Ru Ji-ho, Yu Young-Geol, Lee Kyu-Man, 2008, GENERATION of GEO-SPATIAL INFORMATION USING KOMPSAT-2 IMAGERY,Proceeding of ISRS2008,pp13-16 Lee Hyun-jik, Ru Ji-ho, Yu Young-Geol, 2009, Automatic Extraction Plan of Land Cover by using Kompsat-2 Imagery, Proceeding of ISRS2009, pp289292. Ruvimbo Gamanya, Philippe De Maeyer, and Morgan De Dapper, 2007. An automated satellite image classification. Zhan, Q.; Molennar, M.; Tempfli, K. Hierarchical object based structural analysis toward urban land use classification using high-resolution imagery and airbone LIDAR data. International Archives of Photogrammetry and Remote Sensing, 33, Part 7: 1751-1758. 2002. References from Books: Yu Bok-mo, Tony Schenk, 2003, Modern Digital Photogrammetry, Pearson Education Korea..
(5)
수치

관련 문서
If the receiver received image type (II), then the data-hiding key is used to do data extraction and together recover the cover image.. If the receiver received image type
Phase profile of conventional DOE Obtained diffraction image. Optical vortices appear in the diffraction image generated by
In addition, the thermal flow analysis and imaging ultrasonic thermography detection method are comparatively analyzed to improve the detection reliability for
Although image retrieval method using outline and vertex of figure is used to express spatial information, search speed is relatively slow and it is
In this study, 3D PCL scaffolds were fabricated by using notch type nozzle via fused deposition modeling (FDM) to improve the cell adhesion and
It is necessary to reconsider the Chinese brand image in the current market environment of the world where the influence of China is increasing. Therefore, in this
Taubin, “The QBIC Project: Querying Image by Content using Color, Texture and Shape,” Proceedings of SPIE Storage and Retrieval for Image and Video Databases, pp.. Pala,
Creative activities of expressing internal world of human beings have meanings in expressing the internal meaning beyond expressing the image of an object,
